UNIVERSIDADE DE LISBOA FACULDADE DE CIÊNCIAS DEPARTAMENTO DE INFORMÁTICA
ROOT CAUSE ANALYSIS
IN LARGE AND COMPLEX NETWORKS
Tiago Filipe Rodrigues de Carvalho
MESTRADO EM SEGURANÇA INFORMÁTICA Dezembro 2008
UNIVERSIDADE DE LISBOA FACULDADE DE CIÊNCIAS DEPARTAMENTO DE INFORMÁTICA
ROOT CAUSE ANALYSIS
IN LARGE AND COMPLEX NETWORKS
Tiago Filipe Rodrigues de Carvalho
Orientador Hyong S. Kim Co-Orientador
Nuno Fuentecilla Maia Ferreira Neves
MESTRADO EM SEGURANÇA INFORMÁTICA Dezembro 2008
I
Resumo
Uma grande parte do sucesso de uma empresa depende do desempenho da função de Tecnologias de Informação. Em redes de grandes dimensões, devido à evolução do número de clientes e às constantes mudanças nas necessidades das empresas, as dependências entre sistemas e elementos de rede têm vindo a tornar-se cada vez mais complexas. Consequentemente, a localização das causas originais de problemas de desempenho de sistemas é uma tarefa complexa. A rede tem de ser analizada como um todo porque, mesmo durante a ocorrência de uma falha, todos os sistemas podem parecer estar correctos quando analizados separada e instantâneamente. O objectivo deste projecto é o estudo de uma solução automática de análise de causas originais de falhas em redes complexas e de grandes dimensões. Neste trabalho, é apresentado o Etymon, uma ferramenta que identifica os componentes e métricas mais relevantes para explicar os problemas que afectam o trabalho diário dos utilizadores finais.
O presente trabalho propõe uma arquitectura modular para executar as acções necessárias para encontrar uma explicação para um problema de desempenho. A análise começa por processar registos de falhas (trouble-tickets) de forma a identificar os principais períodos de desempenho degradado. O tráfego de rede é analizado continuamente para identificar as dependências entre componentes e mantê-las actualizadas. Usando a informação sobre dependências, é criado um modelo da rede que representa o ambiente para uma aplicação específica. De seguida, é avaliado o estado de cada componente do modelo durante o período do problema com base em desvios do seu comportamento habitual. Finalmente, é feita a pesquisa no modelo por caminhos causais em que o primeiro componente corresponde à causa original do problema.
Para testar a aplicação desenvolvida foi utilizada a rede empresarial de um operador de telecomunicações Europeu. Assim, foram enfrentados todos os desafios inerentes a uma rede de produção, como por exemplo, possível insuficiência de informação sobre algumas aplicações, interações complexas entre aplicações, e um grande número de fluxos de dados. A aplicação Etymon introduz conceitos como caminhos causais, modelo de rede específico para um ambiente de uma aplicação, informação sobre dependências condicionada a um contexto específico, correlação temporal de anomalias, e classificações de causas.
Palavras-chave: análise de causa-raiz, problemas de desempenho, redes complexas e de grandes dimensões, QoS, Etymon.
II
Abstract
A huge share of a company’s success relies on the performance of its IT infrastructure. In large networks, due to the evolution of the number of clients and changes in the company requirements, the dependencies among systems and network elements tend to become increasingly complex. Consequently, the localization of root-causes of performance problems is a very challenging task. The network must be analyzed as a whole because, despite the failure, all systems may seem to work fine when analyzed separately. The purpose of this project is to study an automatic root-cause analysis of failures in large and complex networks. We present Etymon, a tool that identifies the most relevant network components and metrics to explain performance problems affecting the daily work of end-users.
We propose a modular architecture to perform the tasks necessary to find explanation root-cause of a problem. The analysis starts by processing trouble tickets in order to identify the major performance issues. Traffic monitoring and analysis are continuously performed on the network to identify the dependencies among components. Using the dependency information, we create a network model that represents the environment for a specific application. We then evaluate the state of each component of the model during the time when the trouble ticket is issued, based on deviations from observed normal behavior. Finally, we search the model for causal paths that start on a root-cause component and provide an explanation for the failure. The testbed for our application is the enterprise IT network of a large European Telecom operator. Therefore, we face challenges of applying such tools to a production network. For example, the challenges are possible lack of information about applications, complex interactions, and high number of workflows. Etymon introduces concepts such as environment-specific network model, context-conditioned dependency information, temporal correlation of the anomalies and rankings of root-cause components and metrics.
III
Acknowledgments
This thesis represents a lot of hard work. But my effort would be useless if not for the priceless support from some people who helped me overcome all obstacles.
I would like to thank Professor Hyong Kim for his guidance and suggestions. His valuable experience was vital to keep this project on the right track.
To Luís Costa, Ricardo Marques, Ricardo Oliveira for all the companionship and interesting discussions throughout the course.
To Sihyung Lee, for making my stay in Pittsburgh so pleasant. Thanks to you, I was able to take full advantage of my experience there. To Andrew Turner, many of the ideas expressed in this work stem from our interesting brainstorms.
To José Alegria for his support, incentive and trust in my capabilities. To Adriana Luz, Ricardo Ramalho, Tiago Mendo, Nuno Almeida, Paulo Serrão, Fernando Carvalho, Pedro Simões and Rui Martins who spared no effort to provide all the information I needed.
To my family and friends, who suffered the most during this project. I promise to make up for my absence in the last 16 months.
A special thanks to my wife Cláudia for her support, comprehension and patience. My success will always be yours too.
IV
V
Table of Contents
1 Introduction ... 1 1.1. Related Work ... 2 1.2. Main Challenges ... 3 1.3. Contributions ... 4 2 Background ... 7 2.1. The Network ... 72.2. The Monitoring Application ... 9
2.3. The Network Record Application ... 11
2.4. Limitations ... 11 3 Etymon Overview ... 12 3.1. Architecture ... 12 3.1.1. Online mode ... 14 3.1.2. Offline mode ... 15 3.2. Event Correlator ... 15
3.2.1. Issue Identification through Problem Ticket Filtering ... 15
3.3. Traffic analysis and network discovery ... 17
3.4. Network Model ... 18
3.4.1. Generic Model ... 19
3.4.2. Model Dependencies ... 21
3.4.3. Nodes and Metrics ... 24
3.5. Time series analysis ... 25
3.6. Cause and Effect Probability ... 28
3.7. Root Cause Candidates Selection ... 31
3.7.1. Independent Analysis of Components ... 31
3.7.2. Causal Path Lookup ... 32
3.8. The graphical user interface ... 33
4 Results ... 35
4.1. Traffic Analysis Results ... 35
4.2. Issue Identification ... 37
4.3. Model Statistics ... 41
4.4. Root Cause Listings ... 41
VI
6 Conclusion ... 51 7 Bibliography ... 54
VII
List of Figures
Figure 1 – Sample diagram of an application with multiple dependencies ... 8
Figure 2 – Generic architecture of the monitoring application ... 10
Figure 3 – Etymon architecture ... 13
Figure 4 – From ticket registration to performance issue detection ... 16
Figure 5 – TCP State Machine ... 18
Figure 6 – Generic Network Graph ... 20
Figure 7 – Example of one level of the model ... 22
Figure 8 – Cause and effect on the evaluation time period ... 26
Figure 9 – Relation between issue vectors for metrics with different cycles ... 29
Figure 10 – Calculation of the component state ... 30
Figure 11 – Example of identification of relevant components using independent analysis ... 32
Figure 12 – Traffic Analysis Interface ... 34
Figure 13 – Network model interface ... 34
Figure 14 – Frequency of the detected flows ... 36
Figure 15 – Abnormal flow identified on a limited period ... 36
Figure 16 – Graph of related traffic flows ... 37
Figure 17 – List of top issues ordered by number of tickets ... 38
Figure 18 – Distribution of the Issues Duration ... 39
Figure 19 – Distribution of the number of tickets and locations per issue... 40
Figure 20 – Distribution of the issues start time through the hours of a day... 40
VIII
List of Tables
Table 1 – Ticket filtering and grouping ... 17
Table 2 – List of possible metrics ... 25
Table 3 – Distribution of values for a distribution regarding the standard deviation ... 27
Table 4 – Statistics of the network model for the first issue (id=9579) which affects 19 sites ... 41
Table 5 – Results of the independent analysis of components for the first issue (id = 9579) ... 42
Table 6 – Results of the causal path lookup for the first issue (id = 9579) ... 43
IX
A distributed system is one in which the failure of a machine I’ve never heard of can prevent me from doing my work.
1
1 Introduction
Nowadays, the pressure for companies towards the short-term profit is overwhelming. A company is expected to operate continuously in any environment and sales are the top priority for the daily management. In large companies, new products are constantly being created and new promotions and campaigns are launched in a weekly or monthly basis. These demands tend to increase faster than the support IT infrastructure.For the Telecom companies, for instance, the number of applications in daily operation is very large. From the moment a client requests a new phone or DSL line, until the moment it is installed in his house, a high number of interactions must occur within the IT infrastructure of the company. It starts with the application that registers the request for a new DSL line. Then, a new record must be placed in the application that manages the teams that will physically install the line, and configure the circuits. This application will interact with other system that identifies the place where the client lives, and retrieves the information about the relevant paths of the network. After the installation, another application is responsible for triggering physical tests to the phone line to check for any possible problems. In addition to these applications, there are other applications that manage calls in the call centers, handle billing, or simply process the monthly invoices. Failures may happen not only in the application but also in the network. The network covers almost the entire country and comprises a large number of routers, switches, firewalls and links with different capacities. There are many possible points of failure than can affect the company’s daily work and may have a significant impact on the company’s image.
Another source of problems is the frequent release of new products and promotions. These changes usually require adjustments to the applications. Sometimes, due to lack of time or negligence, these new developments are not adequately tested and the impact on the current infrastructure can be disastrous. Some examples are common: a new SQL query, if not adequately tested can take a long time to run and consequently block many other users and applications; a new request can demand transferring a large file over the network to a remote store with a low bandwidth connection. Sometimes, the quick fixes applied to solve these problems are themselves a source of performance issues.
Finally, another important aspect is the natural evolution of the company’s services and of the IT infrastructure. Throughout the years the number of employees and clients has grown and therefore the applications add to cope with more demanding usage profiles. The usual solution is to keep adding more resources (i.e. more and better servers, increase memory, upgrade links etc.) and deploy improved and more complex applications. As the network and systems became more complex, more intricate solutions are necessary to allow new applications to communicate with older and legacy applications. The middleware solutions adapted to make this interaction possible constitute new points of failure. The personnel that use and manage the system as changed also. Some undocumented changes were lost, and valuable know-how about the network and the applications was lost.
2
All these changes and evolutions can make managing network and systems a chaotic task. It is vital to the company to have adequate control over the network and its systems. For instance, there must be detailed records of all elements on the network as hosts, servers, links, routers and switches. Real-time monitoring is another fundamental function to be used to generate alarms, trend analysis or technical risk assessment. These tasks should be performed automatically and several monitoring solutions are available (either commercial or open source). But, in large and complex networks, these applications generate a large amount of data that is very hard to filter and analyze manually. The main purpose of this project is to study a root-cause analysis of failures in large and complex networks. The final solution must be as automatic as possible. For the reasons stated earlier, the task of identifying the root cause for a performance problem experienced by the end-user a large enterprise IT network is very difficult. Sometimes the problem has its origin in a dependency that the network and systems operators did not even had knowledge of and also, despite the failure, all systems may seem to work fine when checked individually.
The first step of the analysis is acquiring as much information as possible from the network. Due to the constant changes on the network and systems, one cannot trust completely the existing network systems architectures diagrams, so one of the first components of a root cause analysis tool must be a network discovery mechanism. This component should also identify dependencies among systems. A second important component is fault diagnosis, i.e. one should identify faulty behavior by one node of the network or by some component of the system. Having identified faults in several nodes, they have to be correlated in order to understand which fault is responsible for the failure perceived by the user.
One of the main goals of this project is to create a useful tool to apply in the company whose network is used as testbed. Thus, focus has been given in creating small applicable modules that could not only be used as a component of root-cause analysis system, but also be applied independently and provide interesting information to system managers. Another purpose is to identify what are the requirements to improve the accuracy of this root-cause analysis tool. For this reason, a real and very complex testbed is used rather than a scenario created from scratch. Using a real and complex network for such a short term project introduced some obstacles: lack of information about the systems, high number of workflows for which there is no documentation available, difficulty to implement some important metrics in production systems, huge amounts of data to process, and naturally, the existence of numerous complex interactions between the same systems which may add some noise in the service dependency discovery process.
1.1. Related Work
One of the most complete projects in the field of root-cause analysis found in the literature today is probably Sherlock [1]. Its main advantage is that the network is considered in its entirety instead of analyzing only a specific application. The authors describe techniques for building a dependency model that allows the identification of root-cause candidates. The model also simulates the effect of fail-over and load balancing mechanisms. The inference graph model consists of nodes and edges. The node represents an associated probability of having performance problems and the edge represents a dependency in the system. Detection of the root-cause is limited to a server or service
3
and does not address finer resolution. The authors argue that the model can be applied to any granularity but the methods used to identify the dependencies could be limiting as they are based on simple traffic analysis. The analysis uses the response time to detect and understand problems. The first component of this project infers causality relations among TCP flows that establish between the servers that compose the entire ecosystem. The correlation of these flows follows a similar approach to two convolution algorithms in [2]. The first one involves recognizing RPC-like communication and combining the calls and responses into path sequences. The second one organizes messages exchanged between each pair of nodes in a time series, and then correlates them by calculating the convolution of each pair of functions. Applying this procedure recursively, the authors obtain possible paths used in the application. The latter approach uses any kind of messages, thus it is more generic but less accurate than the one based on remote procedure calls. The method used for RPC communications can be extended to other protocols.
In Pinpoint [3], a unique ID is assigned to every HTTP request that enters the system. This tool is intrusive, as it must intercept all requests in order to assign them the unique IDs. This is easy to do on a basic J2EE platform, but almost impossible to implement pervasively in a large network with diverse software and hardware systems. Pinpoint is evaluated using simple J2EE web applications without intricate relations among a large number of servers. Besides Pinpoint, other approaches [4] [5] require the programmers to instrument applications to reveal relevant events. Instrumentation of large and sometimes legacy applications in a compatible fashion could be a very expensive task. Another approach with a higher level of control is Magpie [6]. Magpie makes an extensive use of event monitoring in all the components in the system. By capturing all the relevant events and guaranteeing their causal order, Magpie is able to identify the workload of the application. In order to organize these events, an event schema must be generated and is as complex as the number of different events monitored. Although it is difficult to apply this approach on the entire network supporting several interacting applications and to every possible event, it could be effective if it is applied in specific points of the IT infrastructure.
1.2. Main Challenges
The following list presents challenges of this project:
Complexity of networks and dependencies: To find the root cause of a problem in a large distributed network, using only a manual analysis is often very difficult or even impossible. Using an automatic tool, although we are able to do more processing in less time, we lose some of the benefits of a manual analysis done by experts: we lose intuition! Due to the lack of this human characteristic it is very hard to choose, among a large set of elements, those that should be analyzed most deeply. It is also hard to configure all the possible dependencies in such a system. The overabundance of elements in such a network and the complexity of the dependencies among them is one of the main challenges to address in this project;
Number of metrics: The number of metrics available is always an issue, no matter if we have too many or too few available. In the most frequent case, we lack some metrics which are important to explain a problem. In this case, the application should try to identify some
4
component or group of components where the root cause may be located, i.e. the application should reduce its granularity. In contrast, when the number of metrics available is too large, we have complexity and performance issues. Too many metrics is equivalent to too much processing and it is harder to distinguish the most important metrics.
Automation of procedures: An application that overcomes the problem of manual analysis should be, by definition, as automatic as possible. One must minimize the amount of expert opinion needed to construct models, configure them, etc. This field of research is addressed by Expert Systems [7], where all components of the system are correlated automatically using their attributes. The construction of an automatic system raises many issues:
- How to find which metrics are behaving badly? One approach is to focus on modeling failure behavior. This is an approach to avoid because different failures tend to have different manifestations. Therefore, such method is prone to false positives. Another approach is to identify deviations from normal behavior. In any case, how should we process these anomalies to obtain a node state?
- How should metrics influence the state of a component? This is one of the most difficult questions to answer without introducing some expert opinion. Different failures may be identified by different metrics. Therefore, the state of the component should use as much past history as possible to understand how to use metrics to evaluate the state of a specific component.
1.3. Contributions
The main goal of this project is to create a functional root cause analysis tool that could be helpful for problem diagnosis in a large enterprise networks. The system is called Etymon1. As it is shown in the related work, most of the current solutions make extensive use of instrumentation of applications. The company whose testbed is chosen has an ongoing project that monitors part of IT infrastructure. The project is named Pulso2 [8] and has been extending its scope throughout the past few years. Pulso plays a major role in this project, as it constitutes the main data source used to feed Etymon.
This section describes three components of an automated root cause analysis system: network discovery, failure diagnosis, and network model.
The major contribution is the study of the deployment of such a system in a large and complex production network, which has been adapted to the company’s needs over several years. This implies major changes to standard applications, many times without sufficient documentation, monitoring, logging capabilities and with “unexplainable” collateral effects on the performance of the application.
In such a large system, it is extremely hard to characterize its use and what constitutes a performance error. The company has a trouble ticket system used to identify performance issues.
1 Etymon is a Greek word for “true meaning of a word”.
2 The Portuguese word “pulso” means both “pulse” (for representing the act of monitoring and sensing the
5
This application stores end-users complains, which represent the best sign that an abnormal behavior is affecting the application’s performance. This method can later be replaced by automatic methods of failure diagnosis, possibly based on the knowledge acquired from the analysis of the issues raised by users.
We provide our system with five main properties, so that it can fit well in such large scale network. The application should be:
Usable – the application should be immediately useful to network operators, despite its accuracy in identifying root-causes of failures. Therefore, a set of views are carefully designed and implemented to analyze data. Using this view, network and system operators can easily identify the most relevant elements to analyze from a large dataset. Therefore, they must have access to features like ticket analysis, traffic analysis and correlator, network model, components and metrics relevant to study a performance problem;
Automatic – the developed tool must search for causes using automatic mechanisms whenever possible, minimizing any intentional human intervention or opinion. Therefore, the methods are mainly based on the recent relations among application components and on the detection of deviations with respect to a baseline of the recent behavior. The use of these applications in production systems is locally stable, i.e. the usage of each application is more or less the same when seen in a time window of a few weeks, which allows the application of anomaly-based methods;
Adaptable – the application fits and adjusts well to the discovery of new components and to the inclusion of new metrics on the underlying monitoring systems. The network model is dynamic and contains a different view for each problem, including only the most relevant elements. The model uses information available in the company’s underlying applications that monitor the network and keep records of each network element. Whenever a new element is added to these applications, it is reflected on our application in the relevant models;
Granular – the model is easily extendable to increase the resolution of root-cause identification. Whenever we have more information about a specific component, we may be able to pinpoint a more detailed root-cause. Consequently, all mechanisms used must be generic and should be applied to any type of component added to the model. This property will facilitate the implementation of extensions to the application by adding new model components that will be processed as any other component, but that will add a new level of detail to the application;
Accurate – the application improves the accuracy of a normal intuitive analysis. Although it is hard for an application to surpass the years of user experience, it should be able to pinpoint components as being problematic in a more accurate way than users would do in a manual analysis. The advantage of automatic applications is that they can scan the complete set of dependencies of an application, without being biased by any frequent anomalies of a system.
Scalability – the application must be able to process data for all nodes represented in the network model, in an efficient. Analyzing past issues involves access to large databases with historical data, which slows down the entire process. Therefore, the statistics needed to determine the network state are updated in real time, whenever a new measurement is
6
available. Then, if a relevant event is detected, the network state can be saved for later analysis.
This project is strongly related to the company whose network is used as testbed. Therefore, the feedback to be given to the company constitutes an extra requirement. When we tried to correlate components to create the network model, we noticed some inconsistencies that could thwart any automatic analysis. The network and the information available constitute the main advantage and, at the same time, a challenging task. There are numerous metrics available covering many of the areas of the analysis but, even so, root-cause analysis demands some more metrics to be able to find a coherent causal path, i.e. an explanation of how components have affected each other until they provoked the complain of a user. Therefore, the feedback about what needs to be reorganized, what extra metrics should be obtained and what parts of a system should be documented, is very important.
7
2 Background
Root cause analysis projects require a huge amount of information. To be able to identify problems in the network, systems or interactions among them, we need information about the network architecture, mechanisms to trigger the collection of metrics and traffic samples and to constantly monitor the state of all elements that may be involved in this kind of analysis. When one starts an analysis, it is hard to choose a subset of elements where we are sure to find the original cause, thus every single element may have its own importance.In order to choose the testbed, several criteria have to be fulfilled. The main requirements that influence the choice of the company and testbed to use during this project are:
Existence of widely deployed monitoring tools which are easy to interact with: the enterprise IT network chosen has developed and implemented during the past four years a tool that monitors and stores information about systems, network and application. The diversity of metrics is very large and is growing continuously. This not only allows some rich insights for the current analysis, but also opens hopeful perspectives for evolution in the near future for this tool;
Existence of information about the network and systems and how they are related: another tool available in the enterprise IT network monitors relations among systems and maintains records about the hosts identified. This tool is frequently updated with information about the systems, including their characteristics and functions. This allows the recognition of the IP addresses in our traffic analysis, making it possible to include its statistics in the network model used for root cause analysis;
Existence of complex and diverse relations among systems: many of the papers about root cause analysis present solutions to approach the problem. But one of the main drawbacks found in most of them, is that they usually test their results using simplistic application architectures. Normally, these results are obtained for systems involving nothing fancier than a web server with a database and a DNS for name resolution. Actually, although they are important scenarios due to its pervasiveness on most companies, they are not challenging because the relations between systems are very simple and similar throughout the network. Also, the chosen testbed should be challenging in terms of the network architecture. The testbed used in this project includes end-users spread throughout the country and more than one data center where the main systems are localized.
2.1. The Network
The enterprise IT network possesses several important applications. The employees, and potential end users of the applications, are spread all over the country and are connected by a private internal network. The density of end users is not homogeneous as most users are naturally located near the larger cities. Therefore the network capacity is much higher in the larger cities than in some remote locations. All this asymmetry must be accounted for in an analysis of the complaints made by users.
8
The testbed application is one of the most critical and used within the enterprise IT network. Therefore, the set of users of this application is a proportional sample of the overall set of employees. Another aspect of this application is that it deals with several different types of information and therefore it must interact with a high number of different systems. This constitutes an ideal environment to test the solutions developed in this project.
The application has been developed inside the company and its functionalities have been augmented throughout its development. During its evolution, the application had to be changed in order to add new features, to add new interactions with other applications often resorting to middleware systems, to cope with new system requirements due to the increasing number of users and clients and so on. This fact increased the complexity of the system and the difficulty to explain performance problems detected by the users. We should add to this, the disparity of technology used in the several systems. For instance the operating system can vary from Linux to Windows while the databases can go from Oracle to MSSQL servers.
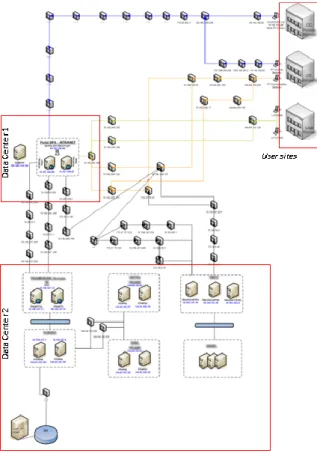
To have a sense of how complex the used system is consider Figure 1.
Figure 1 – Sample diagram of an application with multiple dependencies
As we can see the end users (user sites) communicate with a single application. Many times they are unaware of the other applications, with which the central application must communicate to provide some service. Some of the servers are in different data centers, thus introducing other possible points of failure. The smaller boxes represent routers. Thus, we can verify that between a user and the application or between data centers, the paths are long and traverse many routers. This gives an
9
idea of how complex the system is, and of the quantity of elements that may fail when a user makes a request.
We may easily conclude that the tool to be developed must consider each application as being part of a large ecosystem. This ecosystem includes not only the target application, but also every single system that communicates with it (even in second or third order, i.e. applications that communicate with the target application through one or more other systems). It should also include the network that supports the communication between all systems, and between each system and its end-users.
2.2. The Monitoring Application
The company which supplied the testbed application for this project has implemented in past few years a project for event processing and monitoring (Pulso), covering a large fraction of the IT infrastructure. In this section we provide a description of the system’s architecture and of the metrics available. This information is important because this monitoring project is the major source of information used in the root cause analysis tool.
As we referred before, new metrics are difficult to implement in production systems and a lot of time is necessary to obtain the authorizations, thus the main option is to use only the metrics available in the company’s monitoring tool at the start time of this research project. The idea behind this is that a huge and complex model, with many middle components without any information, tends to be less useful than a simpler model where all elements contain some information about its state. Naturally, this approach should only be followed if the model is able to adapt to new knowledge being acquired and inserted into the application.
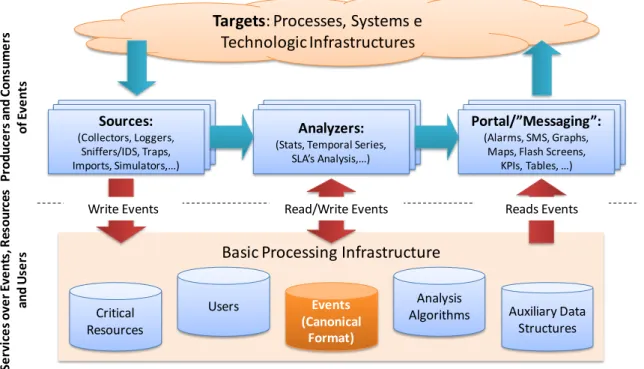
Figure 2 represents the architecture of the system. As we can see the philosophy of the Pulso system follows the ideas developed under the subject of Complex Event Processing [9]. In this type of systems, all measurements are treated like events that should be stored using a canonical format. Each event can trigger some processing that result on different events with a higher degree of abstraction. In this system, the events are metrics applied over servers, network links, applications, etc.
The low level events are used in this system to evaluate the state of the components. The model is created using the information available about the network. The network records contain the existent servers, applications, and links and provide some attributes which we use to construct our model. Naturally the model is only as complete as the network records.
10
Figure 2 – Generic architecture of the monitoring application
The system metrics are collected from a large number of servers which use different technologies. These servers are in production thus the retrieval of metrics should not require making major changes to the system and should have a minimal impact on it. This makes more difficult the obtainment of some metrics in specific operation systems and/or applications. Examples of system metrics obtained at the machine level are CPU usage, load average, memory, etc.
Some other metrics depend on the specific purpose of the system. For instance, in a database we can collect several metrics which can also vary with the database type (Oracle, MSSQL, MySQL, etc.). Other types of servers, such as mail or web servers, may also have specific metrics. Examples of application-specific metrics are server-side transactions response time, number of application/server errors, database wait time, etc.
Within the Pulso system, the network is seen as a black box. The measurements are made to end-to-end links between critical points of the network. These points correspond normally to two types of locations: data centers where the main servers are located and the end user sites. The links are defined for a pair <data center, user site>. For each of the links the system provides measurements of bandwidth and latency.
Other type of links is considered when the analysis is made in the transport and application layers. Here, the application defines application links, which connect some user site to some application. The metrics collected refer to aspects of the communication to or from a specific application. Some of the metrics available are number of timeouts, resets, end-to-end duration of a transaction, etc.
Targets: Processes, Systems e Technologic Infrastructures
Portal/”Messaging”: (Alarms, SMS, Graphs,
Maps, Flash Screens, KPIs, Tables, …) Analyzers:
(Stats, Temporal Series, SLA’s Analysis,…) Sources: (Collectors, Loggers, Sniffers/IDS, Traps, Imports, Simulators,…) Auxiliary Data Structures Analysis Algorithms Events (Canonical Format) Users Critical Resources
Basic Processing Infrastructure
Write Events Read/Write Events Reads Events
P ro d u ce rs a n d Co n su m e rs o f E ve n ts Se rvi ce s o ve r Eve n ts , R es o u rce s an d U se rs
11
2.3. The Network Record Application
There is also an application that keeps track of the network hosts. This application monitors network traffic and stores information about the flows seen on the network. It can be fed with more information manually, by introducing a list of the network hosts and of their purpose, or automatically, by using tools like NMAP to retrieve information about a host. The automatic analysis is rather limited, as the servers often do not allow this type of scans or provide insufficient information.
The information contained in this application is useful to correlate the data gathered in our traffic captures with the components defined in the monitoring application. For instance, whenever we want to correlate two servers, we can identify their IPs using this application, and then lookup the frequency of their relation in a specific traffic capture.
2.4. Limitations
There are several limitations to this work due to the time available for the project and to some operational constraints. The time available, together with the fact that we are working with a production environment, does not allow the retrieval of some metrics considered relevant and that are not being collected by the monitoring system. The probe to retrieve some metrics in a production server must be extensively tested and specific authorizations are required. Therefore, the approach for this project, given its scope, is to develop an end-to-end application using whatever information is available.
Another limitation is that we only have probes to capture traffic from one server to another, i.e. we have mirrors for the traffic generated and received by the most critical servers. Naturally, this prevents us from obtaining information from the control plane. The traffic captures are used and analyzed to detect the network and transport flows between servers. Although it would be interesting to verify and analyze some of the lower level protocols (for instance, routing protocols), this is considered to be out of the scope of this project due to this limitation.
12
3 Etymon Overview
Etymon deals with finding a root cause of problems identified by internal end-users3 of a large enterprise IT network. The application starts by filtering and grouping failure information reported by the end-users. These tickets are processed to identify periods of unavailability or performance degradation. For each period of degraded performance, Etymon constructs a model of the IT infrastructure using the information available on Pulso and obtained in traffic analysis. Afterwards, a time series analysis is computed for all metrics identified for each node of the model. This analysis identifies patterns of behavior of the recent past for each metric. Subsequently, the state of each node can be computed by analyzing deviations from the pattern or identifying abnormal events. The application runs either in online or offline mode. In online mode the failure reports are received continuously and patterns are updated on the fly using the recent past values. This mode allows quick identification of root cause candidates as processing is being performed continuously. The offline mode is the most used to test the application. Using this mode we can calculate the network model and patterns on demand and identify a root cause in the past. Naturally, these computations are time and CPU consuming and therefore the application takes some time to identify the root cause candidates. Naturally, to speed up processing one can use pre-calculated patterns at the expense of a reduced accuracy.This section describes the architecture of the application, where both modes are presented and the main components are described. Then we focus on each specific component. First, in Section 3.2 we describe the event correlator module and the process of filtering failure reports and identifying performance issues. Section 3.3 describes the traffic analysis components and the main outputs possible from this component. Section 3.4 describes the network model and how it is computed using information from Pulso and information obtained through the traffic analysis. Sections 3.5 covers the time series analysis, which allowed us to compute the probability of a node being affected by a failure or being a cause of the failure. These computations are presented in Section 3.6. Finally, in Section 3.7 we describe the component that finger-points the components and metrics that may identify the root causes of the problem.
3.1. Architecture
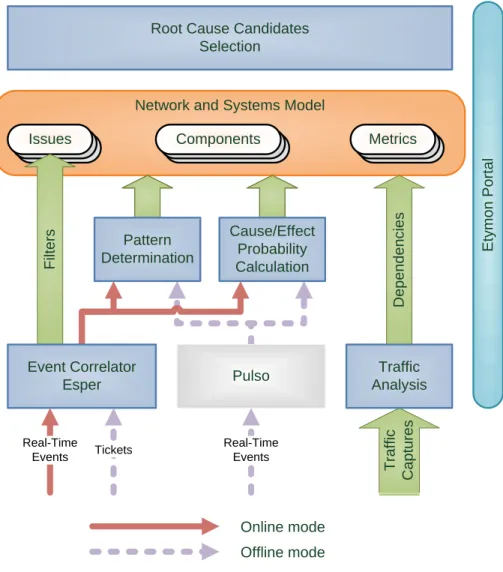
The Etymon application has several components that can be applied individually or in sequence for ongoing events. Figure 3 depicts the several components and data flows for online and offline event processing.
3 Internal users are company employees that need to use its applications and IT infrastructure to execute their
13
Network and Systems Model Root Cause Candidates
Selection T ra ff ic C a p tu re s Issues Issues Issues F ilt e rs D e p e n d e n c ie s Components Components Components Metrics Metrics Metrics Cause/Effect Probability Calculation Traffic Analysis E ty m o n P o rt a l Pulso Pattern Determination Online mode Offline mode Event Correlator Esper Real-Time Events Real-Time Events Tickets
Figure 3 – Etymon architecture
The main inputs of the application are the events collected by Pulso. As seen previously, these events are collected in real time and stored on a central database. The tool has two possible modes of operation:
Online mode: this mode is used to identify and analyze performance issues as they occur. The online mode is represented in Figure 3 by solid arrows.
Offline mode: this mode is used to identify and analyze performance issues that have occurred in the past. The offline mode is represented in Figure 3 by dashed arrows.
The core components of the tool, which are represented in the darker boxes, are the following: Event Correlator (uses Esper Java Framework) [10]: complex event processor framework that receives events and triggers the corresponding methods for pattern calculation or state update. The Esper engine enables the implementation of Complex Event Processing (CEP) applications [9]. A CEP engine, like Esper, is a platform to allow easy development of applications that process and analyze real time data. Esper implements an in-memory database which is better suited to applications where a high number of events needs to be processed quickly and frequent queries are made to correlate real time data;
14
Traffic Analysis: traffic stream analyzer responsible for identifying flows, calculate traffic statistics and output conclusions about network nodes’ roles and dependencies among nodes and flows;
Pattern Determination: component used for detection of abnormal events either by comparison with an usual pattern of behavior, a prediction based on the recent past or a a chosen threshold;
Causal and/or Effect Probability Calculation: module that computes the state of each node given a specific period. In the online mode this period has a fixed size ending on the current time instant. In the offline mode this period corresponds to the duration of the issue plus an extra fixed period where the causal behavior may have happened;
Root Cause Candidates Selection: module responsible for crawling the graph and search for the most problematic component or metrics in the graph. The path between these nodes and the root issue influences the overall probability of the node being pinpointed as a cause for the problem.
The technology used is an Apache/Tomcat web server for the graphical user interface and a database MySQL for data storage. The application is entirely developed using Java.
3.1.1. Online mode
When in online mode, the Etymon tool can receive events from several sources. Mainly, the sources used are the database and data collectors from the company’s monitoring application and the ticketing application which receives the end users reports for problems. The initial component in this mode is the event correlator. This component allows the setup of filters and correlation operations over the streams of events. The stream of events corresponding to the tickets opened by the end users constitutes the first input of the application. This stream is analyzed to identify periods of degraded performance in each application. This information will then trigger the creation of a network model. A model is built based primarily on the information retrieved from the tickets about the systems and network locations affected. The ticket filtering and model creation operations are described in Section 3.2.1 and Section 3.4 respectively.
The online mode bases the state calculation on a fixed-size past period. All nodes for which information is received must be updated continuously. The patterns must be available whenever a user desires to analyze the model state or whenever an issue is detected and, consequently, the root cause candidates need to be determined.
The performance of the online operation is better than that of the offline mode because the patterns are immediately updated whenever an event enters the application. Therefore, this mode is used to pinpoint causes to issues that occur at the time of the analysis. The event correlator module is responsible for triggering these updates and for sending the events for the pattern calculation component. Also, the state of the model nodes can be updated as soon as the pattern update is performed. The methods used to calculate the patterns or other abnormal events detection are described in Section 3.5.
15 3.1.2. Offline mode
In the offline mode the user can request an analysis of a past issue. The application can, for instance, analyze an input file containing the tickets opened for a specified period. These files are in the CSV format and are obtained through queries to the Ticketing application of the company. The ticket filtering operation uses, as in the case of the online mode the event correlator module, to process the events (see Section 3.2.1).
When the user chooses one of the issues the application creates a model based on it. The process follows the same steps of the online mode but, in this case, all time series analysis, pattern detection and state calculation must be computed. For the state calculation, the analysis period includes the time interval of the issue plus some previous period. The size of this extra period is determined by the duration of the issue.
As a consequence, an offline analysis is considerably slower due to data retrieval constraints. The Pulso database contains large volumes of data and the patterns must be computed for a large period, which increases the time needed for data retrieval queries
The offline mode is useful to evaluate issues that are inserted in the application some time after their occurrence. For the past issues, that have been detected online by the application some optimizations can be made. For instance, the online mode can save information about the state immediately after an issue as occurred. Whenever the user desires to analyze the issue again the model can be quickly loaded from the database.
3.2. Event Correlator
The event correlator model is based on the Esper framework. The input data is aggregated in streams of events. This framework executes a call-back function whenever a new event of a specific stream arrives. The programmer of a module using the Esper framework must define the call-back function, the stream aggregation and mapping between functions and event streams. Events on Esper are tuples. The streams are defined by specifying a query that will be applied to each of the tuple. These queries are defined using the EsperSQL language that, as the name implies, is very similar to SQL. The inputs for this component can be either real time events of input files containing a list of events to be processed in batch.
3.2.1. Issue Identification through Problem Ticket Filtering
The main goal of the Etymon application is to find explanations for performance issues. A performance issue can be defined as problem that occurs in some application or network element affecting the normal behavior of the company’s information systems. Therefore, these issues affect the end-users productivity. The users are, in general, company employees that depend on the systems performance to be able to do their job efficiently. Whenever a user sense a problem on a system that prevents him from doing some operation, he may report the problem by opening a ticket using the e-mail or the telephone. These tickets are registered centrally and are the perfect input for an application like Etymon.
16
The input of this module can be live events sent by the ticketing application or a CSV file containing a list of tickets opened during a specific period that the user wants to analyze. We apply a text-filtering function to all the ticket events received, aggregate them by their timestamp, and generate an issue event for each group.
The ticket opened by end-users can have several subjects: blocked accounts, software errors, unexpected results or performance problems. Etymon identifies root-causes for performance problems like slow or unresponsive applications, or unreachable servers. In the context of this project we use the name ticket to denominate a user report of any type of problem and an issue to refer a set of one or more tickets of performance.
The issue constitutes the root of the dependency graph used to find root cause candidates. The main fields of an issue needed to create the relevant graph of dependencies are the period’s start and end timestamp, the application name and the network location of the users who reported the tickets. To construct the model relation we correlate these values with the systems and network information stored by the monitoring application (see Section 3.4) and with the traffic analysis results (see Section 3.3).
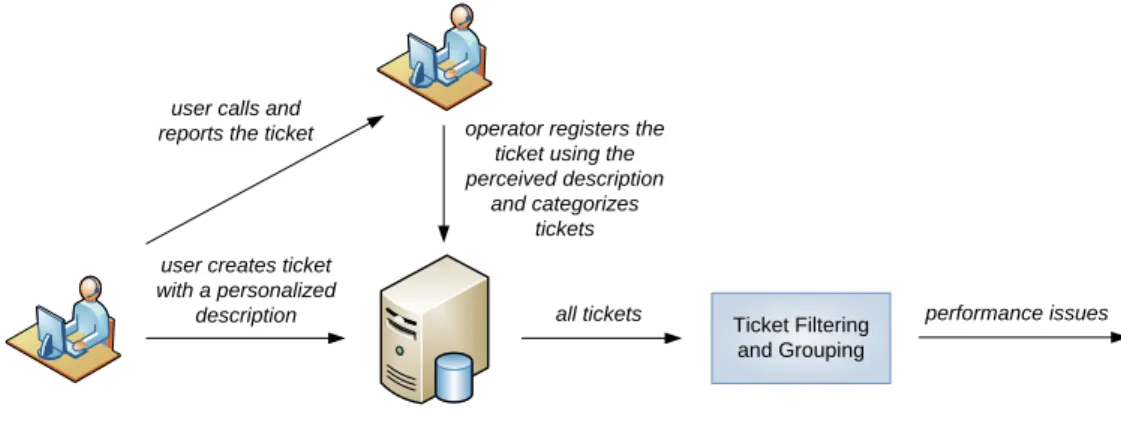
When a ticket is created it includes a description made by the user (see Figure 4). As this description is formed using free text, the possible descriptions are infinite. The ticketing application has a large number of categories to characterize the problem. Nevertheless, sometimes, either by lack of an adequate category or by inexperience of the call center operator, the ticket is not correctly or accurately categorized. The solution to identify relevant issues is to search for a set of specific keywords in the description provided by the user and group the tickets with near timestamps.
user creates ticket with a personalized
description user calls and
reports the ticket operator registers the ticket using the perceived description
and categorizes tickets
all tickets Ticket Filtering
and Grouping
performance issues
Figure 4 – From ticket registration to performance issue detection
The filtering process is presented on Table 1. Here one can see some typical descriptions provided by the users4. The keywords used are presented in the second row and in the bottom of the table it is possible to see the final issue. This approach has proven to be very effective given the common descriptions found. Whenever a false positive is encountered, it probably is isolatedticket that leads to an issue of duration zero. Such an issue has a very low relevance, because the main target of this application are issues with long durations, i.e. at least over thirty minutes. Even if it does not
4 The ticket description was translated and therefore the solution is slightly different due to languages’
17
correspond to a filtering error, a single ticket may indicate that only one user is experiencing problems. In this situation, the cause of the problem is probablylocated in the user’s workstation. As we are not able to monitor the users’ workstations for now, this kind of causes cannot be analyzed.
Raw Tickets
App 1 2008-10-04 14:00 Lisboa App 1 is unavailable App 1 2008-10-04 14:03 Aveiro Record is not shown on the interface App 1 2008-10-04 14:10 Lisboa The App 1 is extremely slow
App 1 2008-10-04 14:13 Porto App 1 keeps blocking
App 1 2008-10-04 14:28 Lisboa App 1 has stopped
Keywords Unavailable, slow, block, stop…
Issue Performance Issue: 2008-10-04 14:00-14:28, Application: App 1, Locations: Lisbon, Porto
Table 1 – Ticket filtering and grouping
3.3. Traffic analysis and network discovery
The first goal of the traffic analysis is to identify the application flows established between the most relevant servers. Given the scope of this traffic analysis it is feasible to apply it to any servers available. Another objective is to find correlations between flows, i.e. flows that, with some high probability, start a short time after the termination of another flow. Using this information we characterize some of the relations of the dependency graph (see Section 3.4). Using this module is also possible to confirm the application’s workflows, identify clients and servers automatically or discover unknown dependencies of the application.
To obtain the capture files for the servers we use a feature already implemented on the company’s network discovery tool. This system is mirroring the traffic of some of the most relevant servers to one of its machines, and thus, we use this mechanism to obtain traffic to our application. The files are created in the CAP format and then processed within Etymon in order to the transport level flows. To open and process the packet headers we use a Java library: the protocol decoder jNetStream [11].
To identify the TCP flows, we resort to the implementation of a state machine driven by the packets captured. The definition of the state machine is available in [12], and is reproduced in Figure 5. The most important instants to identify for each flow are naturally those when a flow is established and when the flows are terminated. Abnormally terminated connections can be a sign that a server is having problems. We will use the information about resets and timeouts as metrics in the modules that compute the state of each node.
18 recv: ACK LISTEN CLOSED TIME_WAIT CLOSING FIN_WAIT_2 LAST_ACK FIN_WAIT_1 CLOSE_WAIT SYN_SENT ESTALISHED SYN_RCVD
appl: active open send:SYN
appl:send data send: SYN
recv:SYN; send:SYN, ACK recv: RST
recv: SYN, send: SYN, ACK timeout
send:RST
appl: close send:FIN
recv: ACK
recv: ACK recv: SYN, ACK
send: ACK recv: FIN send: ACK
appl: close send: FIN
recv: FIN, ACK send: ACK recv: FIN send: ACK recv: FIN send: ACK recv: ACK timeout appl:close or timeout appl: close send: FIN appl:passive operation
Normal transitions for client Normal transitions for server
Figure 5 – TCP State Machine
3.4. Network Model
The central component of Etymon is the network model. The network model should represent, as faithfully as possible, the relationships between systems, servers, network links and application links. Naturally the process of gathering information about a system and identify each dependency in a large and complex network is a huge task. We follow an approach that optimizes the use of the already available metrics instead of building a complete and very complex model of dependencies. The construction of such model would have failed because many of the middle nodes would not have any metric associated and would compromise the detection of failures.
The model is created using an automatic approach to correlate the information available. The monitoring system which manages data collection has already information about servers, systems and network links. Hence, the correlation methods use the properties of each entity to correlate them with order type of entities. For instance, a server has some information associated with it, e.g. IP address, application, and so on. Through the company’s network records, it is possible to identify a host location based on its IP address and, consequently, we can identify the network link used. Also, as the servers have a reference to the application they belong to, we are able to identify the most relevant servers in each application, using statistic of the traffic analysis.
19
Until now, we only have access to the quality of the end-to-end communications between key points of the network. These points are, in one side, the sites where most end-users are located and, on the other side, the data centers where the main servers are located. As we do not have control plane information, we will address low-level network issues in future work. The model can easily accommodate new information collected on the network and new dependencies between middle routers, gateways and other network elements. Nevertheless, the current setup allows us to pinpoint the network as a cause of problems although it is not possible to identify the exact cause component accurately.
3.4.1. Generic Model
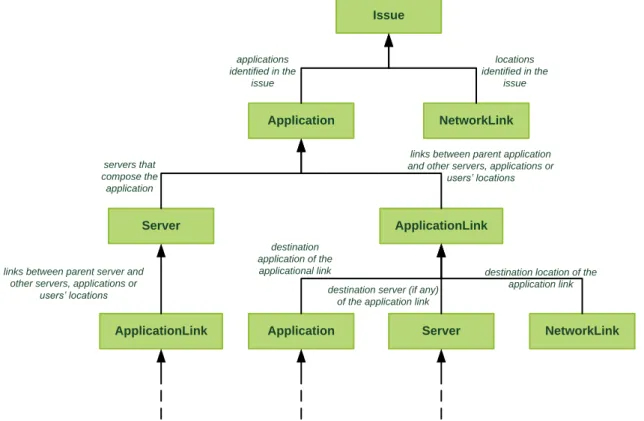
The model is a directed graph (or digraph) where the nodes are the enterprise IT network components and the edges represent a possible causal relation. Each node has a state representing the probability of having some anomaly. Each edge has an associated probability the child node influencing the parent node. Naturally, the final probability of the parent node having a problem and of it being caused by an anomaly in the child node will depend both on the state of the nodes and on the probability of the edge between them.
The generic model, which is represented in Figure 6, uses five different classes of components: Issue: corresponds to the root of the causal graph, and represents an event of degraded performance identified during the ticket analysis and filtering operation;
Application: represents a specific application. Although it does not correspond to a physical component per se, it is important to define an element that represents the application and to which several application level metrics are applied. For instance, metrics pertaining to higher level transactions or some parameters specific to a given application may be associated with the Application component instead of being associated with the Server which maps to the hardware level component;
Server: represents a specific physical or virtual machine. Servers are the elements that compose the applications, and can correspond to DNS servers, web servers, databases or simply virtual servers. In some cases, the virtual server may also help making load balancing or active-passive replication mechanisms transparent to the model because it always represents the active replica on a cluster, i.e. the one being accessed by the users;
Network Link: represents a physical connection between two points. The two end-points are a site where end-users are and a data center. The metrics for these network links indicate the quality of the communication (e.g. bandwidth, latency) between the two points; Application Link: represents the connection at the transport and application layer. The state of the application link corresponds to the probability of the communication between two applications having problems. For instance, it will consider metrics like the speed of the transactions performed on a specific link, timeouts of those transactions, resets sent by client or server applications, anomalies on the traffic pattern observed, etc. Thus, the Application Link component represents a relation between two applications. The possible relations are:
- Application to Application: when the relation does not specify any servers but is only the intervenient applications;
20
- Application to Server: when the destination application has a specific server that relates to another application;
- Server to Application: when the source application has a specific server that relates to another application;
- Server to Server: when the relation between two applications is performed by two the servers explicitly defined;
- Location to Application: when an application has many accesses from a specific site and thus metrics are obtained for several connections from different host but only to one application, etc. Naturally this association typically represents accesses from end-users to the application.
Each component will have a state expressed in the form of a probability. This probability tries to represent how likely it is for the node to have problems. The calculation of this state is described in Section 3.6.
Issue
Application NetworkLink
Server ApplicationLink
ApplicationLink Application Server NetworkLink applications identified in the issue locations identified in the issue servers that compose the application
links between parent application and other servers, applications or
users’ locations
links between parent server and other servers, applications or
users’ locations
destination application of the applicational link
destination server (if any) of the application link
destination location of the application link
the graph continues until no new nodes are identified
Figure 6 – Generic Network Graph
As we can see from Figure 6 the identification of an issue triggers the creation of the model. An issue results from tickets opened by users. One of the properties of the users’ tickets, used to do the second iteration of the model, is their location. The other important property is the application that has been exhibiting performance problems. Using the location and application attributes of the issue, we identify the relevant network and application links (location to application). These links are those that connect the users’ sites to the application reported on the issue. Using the two layers, the network and the application, we can cover a wide range of metrics. By also adding the application as a child of the issues component we complete the first iteration of our model.
21
The second step is to identify the servers that compose the application. When a server is added to knowledge base of our application one of the required attributes is the application to which it belongs. Thus, we use this attribute to identify all the servers that belong to the parent application. Also, we must identify the relations that the parent application has with other applications. To solve this problem, we have two possible approaches. The first one is to use the traffic analysis results to identify all the relations from the servers of a specific application to other applications. The second one and chosen approach is to add to the model only those relations already defined by the underlying monitoring application and that already have metrics associated. The latter approach is chosen due to both time and simplicity constraints. The time constraints prevent us from building a thorough and detailed model. Thus, we opt for building a simpler model where all the nodes have some metrics associated instead of building a larger and complex model, hard to visualize and with several nodes that would not add much to the final root cause analysis due to the absence of metrics. In the future, if we define new metrics and components correctly on the monitoring application they will be automatically included in our model.
The application links are the remaining nodes to connect to the application element, namely, the application to application and the application to server links. These represent application level transactions that do not necessary involve a specific server on one or both sides of the communication. The option to relate some metrics with either one server or the overall application depends on the monitoring application. One of the goals of this project is that it must be easily attached to any infrastructure already in place and complement the existent monitoring and analysis tools. Therefore, whenever possible, we follow the decisions taken within the scope of the monitoring application.
The next iteration of the model construction is to find the application links related to the identified servers. Here the approach is similar to the one used in the application case but, this time, we search for application to server, server to application or server to server links.
The remaining iterations correspond to finding the child nodes for each application link. For these, the sons are created based on the three main attributes of an application link: the destination application which originates a child application, the destination server which originates a child server and/or the location of destination node which may refer to a network link.
After defining what to look for in each component, the model is constructed recursively until no new nodes are created. We only need to define the edges’ probability for finishing the model’s skeleton. The methods used to define the dependencies strengths are described in following section.
3.4.2. Model Dependencies
There are two main sources for assigning strengths to the edges of the dependency graph. The first source is the traffic analysis results that can be used to identify the most active servers and links. This way, we identify those components that will have a major impact on they parents in case of failure. The second source used is human knowledge. Despite of being an inefficient way of assigning dependencies, the human intuition and intelligence is what we are trying to add to this kind of tools. Therefore we use some human intuition when classifying the dependencies on the generic model (Figure 6) that is used to construct the final model. Nevertheless, we should not neglect the