D
ELIVERY
Q
UALITY
I
NDICATOR
I
MPROVEMENT AND
P
ICKING
W
AREHOUSE
O
PTIMIZATION
:
T
HEC
ASE OFU
NICERB
EBIDAS,
SA
Ana Machado Rocha
[email protected]
Internship Report
Master in Management
Faculdade de Economia, Universidade do Porto
Supervised by: Maria do Rosário Mota de Oliveira Alves Moreira, PhD September, 2017
i
B
IOGRAPHICN
OTEAna Machado Rocha was born in November 1st 1994 in Porto, Portugal. Even though she studied “Science and Technology” during high school, she decided to study management in her bachelor. Ana enrolled in the bachelor in Management at School of Economics and Management, University of Porto (FEP) in 2012. Three years later, once she completed her graduation, she applied to the Master in Management, also at FEP.
During her master studies, Ana was part of the Double Degree Program, which conceded two diplomas: one from FEP and the other from KEDGE Business School (KBS). One of the requirements to obtain the diploma was one semester abroad and so she was in Marseille, France, studying in KBS.
In the last year of the master, Ana did a 6-month internship in Unicer Bebidas, SA, in the Logistics Department. During that period, Ana had the opportunity to be involved in several projects, which are described in this internship report.
ii
A
CKNOWLEDGMENTSI dedicate this research to everyone who supported me during its development.
Firstly, I would like to thank my family for the support and motivation provided during this journey. Specially to my father, uncle and aunts, who have always followed and showed concern about my academic education.
Secondly, due to the motivation and companionship, I want to thank my friends. I had the pleasure to walk aside with them during this journey.
Thirdly, I want to thank Profa Dra Maria do Rosário Moreira, for all the effort and interest
she demonstrated for this internship report, as well as her concerns about the internship and the activities developed.
Lastly, I would like to thank my internship’ supervisors, Enga Ana Ferreira (manager of
“Transportation and Distribution” area) and Engo Jorge Correia (manager of “Logistic
Platforms” area). Also, I want to thank Dr. Rogério Nunes, who was the person who followed the activities developed in the “Logistic Platforms” area. Their availability and knowledge were an essential contribution to this research.
iii
A
BSTRACTOne of the issues that concerns logistics managers is the service level that the Third-Party Logistics (TPL) provide to the customers. Especially on transportation outsourcing, it is very difficult to control the product from the moment it leaves the company, until it reaches the customer
Other issues that concern managers are related with warehousing, since they play a vital role in the company’s performance. The most expensive activity within a warehouse is the order picking. However, there are different ways of optimizing this activity, through the warehouse layout. Also, the loading activity plays an important role, not only in transportation economies but also in the warehouse operations.
The aim of this study aroused from a logistics internship in a beverage company in Portugal, Unicer Bebidas SA. The internship was conducted in two different areas within the department: “Transportation and Distribution” and “Logistic Platforms”. In the first one, the goal was to improve the delivery indicator previously implemented by the company. In the second one, the projects were conducted over the picking warehouse in the company’s headquarters. The mains goals in the Logistics Platforms area were to develop an algorithm which enabled a stacking classification and the development of a tool which allowed the understanding of the picking warehouse layout and storage allocation management. In order to achieve this goal, the case study methodology was followed and the data was collected through direct and participant observation, documents, archival records and interviews.
The delivery indicator tool and the algorithm developed are, nowadays, implemented in the company’s operations. The goal of the delivery indicator was achieved, since the percentages started to increase rapidly. The algorithm showed reliable results, even though there is still no statistics for its impact in terms of time savings in the loading activity. Lastly, the storage location verification tool is not implemented yet, but the outcome was highly satisfactory and it will be implemented until the end of 2017.
Key-words
: Supply chain, Transportation, Outsourcing, Delivery Control,Warehousing, Stack-Up, Storage Allocation Assignment, Beverages
JEL-codes:
L66, L87, L91iv
T
ABLE OFC
ONTENTS Biographic Note ... i Acknowledgments ... ii Abstract ... iii Table of Contents ... iv Index of Figures ... viIndex of Tables ... vii
Index of Annexes ... viii
Index of Acronyms ... ix
1. Introduction ... 1
2. Literature Review ... 4
2.1. Supply Chain ... 4
2.1.1. Introduction to Supply Chain, Supply Chain Management and Logistics ... 4
2.1.2. Supply Chain Integration ... 6
2.2. Transportation ... 7
2.2.1. Introduction to Transportation ... 7
2.2.2. Transportation Uncertainty and Delays ... 8
2.3. Outsourcing ... 10
2.3.1. Introduction to Outsourcing ... 10
2.3.2. Advantages and Disadvantages of Outsourcing ... 12
2.4. Delivery Performance Measurement ... 13
2.4.1. Service Quality Definition ... 13
2.4.2. Performance Measurement ... 14
2.4.3. Key Performance Indicators (KPIs) ... 15
2.5. Warehousing ... 17
2.5.1. Introduction to Warehousing ... 17
2.5.2. Order Picking and Picking Policies ... 19
2.5.3. Stack-up Problem ... 21
2.5.4. Warehouse Design and Storage Assignment ... 23
2.6. Similar studies ... 25
v
3.1. Methodological Aspects of Similar Studies ... 28
3.2. Methodology Selection ... 30
3.3. Steps of the Case Study Methodology ... 31
3.4. Data Collection ... 32
4. Case Study Object Description –Unicer Bebidas, SA ... 34
4.1. Unicer Bebidas, SA: History and Business Areas ... 34
4.2. Governance Structure ... 36
5. Delivery Indicator: Tools’ Development and Implementation ... 39
5.1. Transportation and Distribution in Unicer Bebidas, SA ... 39
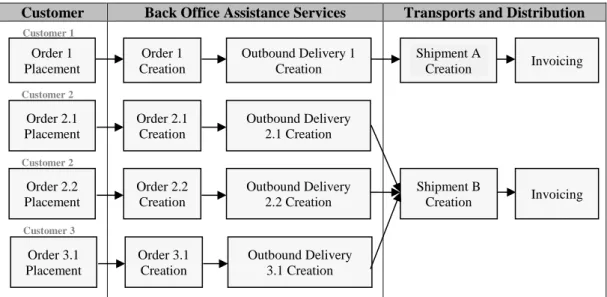
5.2. Order, Outbound Delivery, Shipment and Invoice ... 40
5.3. Delivery Indicator (DI) ... 41
5.3.1. Delivery Indicator Description ... 41
5.3.2. Delivery Indicator Implementation ... 42
5.3.3. Delivery Indicator Development ... 45
6. Picking Warehouse Optimization ... 56
6.1. Warehousing in Unicer Bebidas, SA ... 56
6.2. Stack-up Decision Algorithm ... 57
6.2.1. Stack-up Problem ... 57
6.2.2. Stack-up Decision Algorithm Description ... 61
6.2.3. Stack-up Decision Algorithm Development ... 66
6.3. Storage Location Assignment Verification ... 79
6.3.1. Picking Warehouse Layout and Description ... 79
6.3.2. Storage Location Verification Tool (SVL Tool) ... 81
7. Conclusions, Limitations and Future Implications ... 85
References ... 88
vi
I
NDEX OFF
IGURESFigure 1 - Common Activities in Warehouses ... 18
Figure 2 - Order picking systems ... 20
Figure 3 - Order Picking Area Example ... 23
Figure 4 - Steps of the Case Study ... 31
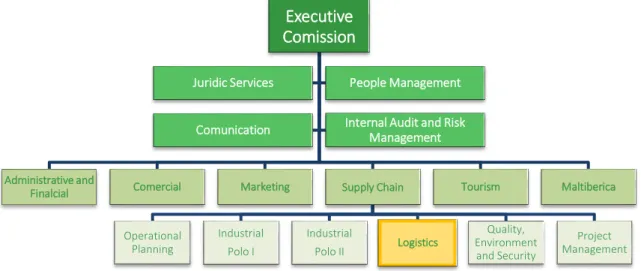
Figure 5 - Unicer Bebidas, SA structure ... 36
Figure 6 - Logistics Department ... 37
Figure 7 - Types of Distribution in Unicer Bebidas, SA ... 39
Figure 8 - Shipment Creation Process ... 41
Figure 9 - Scheduling of Feedback by LSP ... 44
Figure 10 - Initial Process Mapping ... 45
Figure 11 - Process Mapping during internship ... 47
Figure 12 - Excel Tool Utilization ... 48
Figure 13 - 1st Daily Report Model ... 49
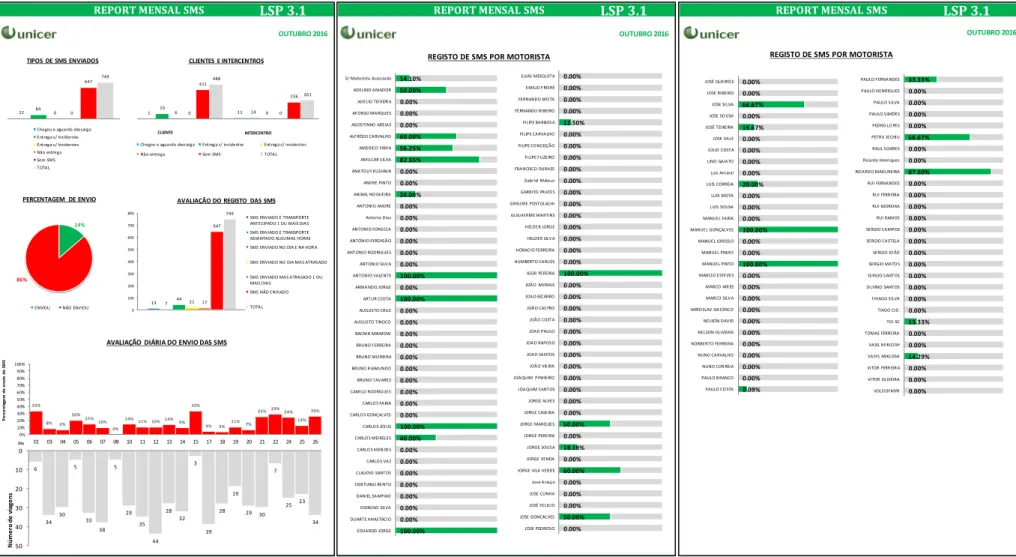
Figure 14 - 1st Mensal Report Model (legible data in Annex 4) ... 50
Figure 15 - Delivery Window Information ... 51
Figure 16 - Evolution of the SMSs sent ... 53
Figure 17 – Current Daily Report Layout (legible data in Annex 5) ... 54
Figure 18 - Current Mensal Report Layout (legible data in Annex 6) ... 55
Figure 19 - Double Key Decision ... 58
Figure 20 – Input point ... 60
Figure 21 - Computer Application for data collection ... 61
Figure 22 – Example of Picking Pallet (before wrapping) and its Pallet Coordinates (after wrapping) ... 62
Figure 23 – Algorithm Logic ... 62
Figure 24 - Blocks Required Scenarios ... 63
Figure 25 – Initial Process Mapping (before the algorithm development) ... 65
Figure 26 - Number of Pallets Observed for the algorithm creation ... 66
Figure 27 - Phases of the algorithm development ... 66
vii Figure 29 - Examples of pallets mistakenly considered as "Non-Good Bases for Stacking"
... 68
Figure 30 - Examples of pallets non-detected by the sensor ... 68
Figure 31 - Laser beams on lower pallet (left) and on higher pallet (right) ... 69
Figure 32 – Example of a Grid and Beer Pallets Measurement ... 70
Figure 33 - Error 1, Error 2 and Error 3 ... 71
Figure 34 - Final Observation Statistics ... 72
Figure 35 - Example 1 of Disagreement between the Algorithm Decision and the Visual Opinion ... 72
Figure 36 - Scanner Verification Tool for MCP15 ... 74
Figure 37 - Example of Scanner SCP14 verification ... 76
Figure 38 - Final Process Mapping ... 77
Figure 39 - Pick and Cross Aisles in Unicer Bebidas, SA Picking Warehouse ... 79
Figure 40 – Home Page of the SLV tool (legible data provided in Annex 9) ... 81
Figure 41 - Report Example (legible information in Annex 11) ... 83
I
NDEX OFT
ABLES Table 1 - Means of transportation ... 8Table 2 - Transportation KPIs ... 16
Table 3 - Loading Conditions ... 22
Table 4 - Relevant similar studies (1) ... 26
Table 5 - Relevant similar studies (2) ... 27
Table 6 - Methodological Aspects of Similar Studies (1) ... 28
Table 7 - Methodological Aspects of Similar Studies (2) ... 29
Table 8 – Methodology Selection ... 30
viii
I
NDEX OFA
NNEXESAnnex 1 - Unicer Bebidas, SA Activity Centers ... 97
Annex 2 - Detailed Organization Structure ... 98
Annex 3 - Semi-Structured Interviews ... 99
Annex 4 - First Monthly Report ... 100
Annex 5 - Current Daily Report Model ... 103
Annex 6 - Current Monthly Report ... 105
Annex 7 - Evolution of the SMSs sent (per LSP) ... 108
Annex 8 - Picking Warehouse Layout ... 109
Annex 9 - Home Page of the SLV Tool ... 110
Annex 10 - Zones Confirmation and Product Allocation Verification – SLV Tool (Excerpt) ... 111
ix
I
NDEX OFA
CRONYMS40 - 40 tons trucks (Exportation)
1D - Direct Distribution in 10 tons vehicles (Secondary Distribution) 2D - Direct Distribution in 20 tons vehicles (Secondary Distribution) 4D - Direct Distribution in 40 tons vehicles (Secondary Distribution) ABC - Inventory categorization technique
C2 - 20 tons containers (Exportation) C4 - 40 tons containers (Exportation) CO2 - Carbon Dioxide
DC - Distribution Centre
DPLP - Distributor’s Pallet Loading Problem HO - HORECA Channel (Secondary Distribution) HS - Hyper and Supermarkets (Secondary Distribution) I/O - Input / Output point
KPI - Key Performance Indicator L - Litre
LSP - Logistics Service Provider LSP1 - Logistics Service Provider 1 LSP2 - Logistics Service Provider 2 LSP3 - Logistics Service Provider 3 LSP3.1 - LSP3 Primary Distribution LSP3.2 - LSP3 Secondary Distribution LSP4 - Logistics Service Provider 4 LSP5 - Logistics Service Provider 5
MCP14 - Scanner located in the left side of the picking warehouse MPLP - Manufacturer’s Pallet Loading Problem
OPS - Order Picking System PBS - Pick by Store
PBL - Pick by Line
PET - Polyethylene Terephthalate (Type of packing) POS - Point-of-sale
x
PR - Primary Distribution
S1 - SMS "Arrived and waits for unload" S2 - SMS "Delivery with no incidents" S3 - SMS "Delivery with incidents" S4 - SMS "No delivery"
SAP - Unicer's Database SC - Supply Chain
SCM - Supply Chain Management
SCP14 - Scanner located in the right side of the picking warehouse SKU - Stock Keeping Unit
SL - Service Level
SLA - Service Level Agreements
SSCC - Serial Shipping Container Code TPL - Third-Party Logistics
1
1. I
NTRODUCTIONLogistics and Supply Chains are being recognized in organizations has an important part of their strategies, due to the crucial role that they have in each company’s competitiveness (Mellat-Parast and Spillan, 2014). It is also common that companies do not perform the entire activities essential to their business and, instead, they subcontract another company that is able to better perform that or those activities (Joong-Kun Cho et al., 2008). This process is called outsourcing and, nowadays, many companies begin to use it as a way to focus on other activities that they believe to perform best in their business. This usually happens with services such as outbound and inbound transportation, warehousing, freight bill auditing and freight distribution (Joong-Kun Cho et al., 2008). Companies that are engaged in outsourcing, sometimes face difficulties in terms of managing the subcontracted activities. Therefore, the challenges increase when the outsourcer attempts to control the service provided by the outsourcee (Jamwal and Meda, 2012).
Other issues that concern managers are related with warehousing, since they play a vital role in the company’s performance. With more product variety, smaller orders and the need for shorter response times, efficiency and effectiveness become even more important. The most expensive activity within a warehouse is the order picking. However, there are different ways for optimizing this activity, through the warehouse layout. Also, the loading activity plays an important role, not only in transportation economies but also in the warehouse operations. This is another activity which can be optimized.
This research has aroused from an internship at Unicer Bebidas, SA (hereafter referred to as Unicer), the Portuguese leader company in the beverages market. As a consequence of
Prémio de Logística Moderna 2015 Award, given annually by the Logística Moderna
magazine and the APLOG (Associação Portuguesa Logistics), Unicer represents a great opportunity to do research in Logistics (Miebach, 2015). This award congratulates professionals and organization which contribute to the development of logistics in Portugal. The internship was conducted in two areas of the Logistics Department: “Transportation and Distribution” and “Logistic Platforms”.
2 With this said, this research has two different topics, which give origin to three research questions:
1. How to improve the delivery quality indicator in the outsourced transportation
services at Unicer Bebidas, SA?
2. How to develop a stack-up decision algorithm for mixed pallets?
3. How to verify the current storage locations assignment within the picking warehouse?
One of the research goals is to improve the delivery control system that Unicer is implementing, aside with its new self-service portal for transportation companies. Without its own transportation service, Unicer uses outsourcing to deliver its products, which makes it difficult to know the exact time that each delivery arrives to the customer. This system will allow the company to receive more feedback from its customers, through the development of a daily indicator that will evaluate the effective time of each daily delivery. Besides this daily indicator, the new control system should also include other monthly indicators that will enable Unicer to evaluate the number of deliveries scheduled in the portal and the successful delivery rate.
The second and third questions are related, since they were studied in the same environment: the picking warehouse of Unicer in Leça do Balio. The goal is to develop an algorithm which categorizes mixed pallets as “Good bases for stacking” or “Non-Good bases for stacking”. Finally, due to managers concerns, the last issue of this research will focus on the warehouse layout, with the aim of developing a tool which enables the verification of the storage locations.
An internship is commonly used by universities as a way to help students transiting from higher education to their professional lives (Silva et al., 2016). This practical teaching gives students skills, knowledge and abilities that allow them to overcome the challenges they will face in their workplaces. In the end of an internship, students are said being more ambitious, having higher job satisfaction and being less shocked when they entry the real-world employment (Silva et al., 2016). Besides that, students who do internships improve their work habits, have the possibility to receive an offer for employment and might receive higher starting salaries than students who don’t (Silva et al., 2016). An internship not only affects students but also employers and schools (Maertz and Marks,
3 2014). For employers, they receive high qualified, motivated and inexpensive labor. Besides that, they have reduced costs in the recruitment process through the relation between the company and the academic institution (Sanahuja Vélez and Ribes Giner, 2015). Finally, internships also have benefits for schools because they improve the schools’ visibility in the job market. Schools which place their students in companies have the chance to provide them an experiential education and also demonstrate their success in preparing students for jobs (Maertz and Marks, 2014).
This internship and, in consequence, this study are important for the company since they will provide a clearer view over its delivery quality control system, guidelines to improve it, a functional stacking decision algorithm and a storage location verification tool. Outsourcing, performance measurement and order picking are topics which have been emerging their importance among researchers. Therefore, this study will be an addition to the existing literature.
This report is structured into 4 different chapters, besides this one. In Chapter 2, it is presented a literature review of the topics previously introduced: supply chain, transportation, outsourcing, performance measurement, deliveries, warehousing, order picking, stack-up problem, warehouse layout and similar studies. In Chapter 3, the methodology of the present and similar studies is described. Chapter 4 contains a description of the case study object: Unicer Bebidas, SA. Within this chapter, the company’s history, values, mission, vision and structure are presented, but special focus is paid to the Logistic Department activities. The results of this research are described in Chapter 5 and Chapter 6. The first one regard the research conducted in the “Transportation and Distribution” area, which was the development of the delivery indicator existent in the company. Chapter 6, on the other hand, concerns the projects conducted in the “Logistic Platforms” area. In this chapter, a solution for a stacking decision algorithm will be presented as well as a storage location verification tool. Lastly, limitations, future implications and conclusions are presented in Chapter 7.
4
2. L
ITERATURER
EVIEWWithin this section, the relevant topics for this study will be presented. As it was stated in the previous chapter, this research is a result of an internship conducted in two different areas of the Logistic Department of Unicer. This means that both areas are going to be subject of research.
In Section 2.1, the main topics related to supply chain that have relevance to this study are presented (supply chain, supply chain management, logistics, supply chain integration). In Section 2.2, “Transportation” is introduced and it is given a focus to the research issue, the delays. In Section 2.3, it is provided a description of outsourcing as well as its main advantages and disadvantages. Thereby, Section 2.4 deals with the main descriptions and characteristics of delivery performance measurement. After focusing on this topic, some literature review regarding warehousing and order picking is provided in Section 2.5. In this section, the fundamental literature review for the stack-up problem and warehouse layout is presented. Lastly, on Section 2.6., similar studies are summarized.
2.1. S
UPPLYC
HAIN2.1.1. I
NTRODUCTION TOS
UPPLYC
HAIN,
S
UPPLYC
HAINM
ANAGEMENTAND
L
OGISTICSSupply Chain (SC) and Supply Chain Management (SCM) have been increasing their role in company’s performance, which has led to an increase in academic research on this topic (Janvier-James, 2012). Supply Chain is being seen as an important part of a company’s strategy, by providing a competitive advantage (Ireland and Webb, 2007), that companies use to stand out in this emerging competitive environment (Lambert and Cooper, 2000). The competition is no longer between brands or stores but rather between supply chains (Lambert and Cooper, 2000).
Many authors have developed definitions for Supply Chain and Supply Chain Management. While Pienaar (2009) believes that Supply Chain can be described as the integration of all the activities and organizations that transform the raw materials into
5 finished goods and then deliver them to the final customer, Kukovič et al. (2016) and Aguezzoul (2014) believe that SC is not only about the goods flow, but it also concerns information and financial flows. At the same time, there are many definitions in academic literature for SCM, e.g. the examination and management of the supply chain networks (Janvier-James, 2012). A good SCM allows a company to achieve higher customer service levels, ensure the quality of its products and to reduce management costs (Armstrong and Kotler, 2009). Therefore, the definition given by the Global Supply Chain Forum, which is represented by academic researchers and non-competing firms, states that SCM is “the integration of key businesses processes from end user through original suppliers that provides products, services and information that add value for customers and other stakeholders” (Lambert and Cooper, 2000, p.66). These key business processes that supply chain is in charge of are: customer relationship and service management, demand management, order fulfillment, manufacturing flow management, procurement, product development and commercialization and returns. To have a successful SCM, companies need to start managing their activities as part of the key business processes, instead of managing them as individual activities (Lambert and Cooper, 2000). The goal of SCM is to optimize the supply chain, by maximizing its efficiency, creating a competitive advantage and having firm focused tactics (Manzini et al., 2005). This goal is common to every industry, since every company’s concern is to “provide customers with the right product/service, at the right time, in the right place, in a profitable way for the company” (Serdaris et al., 2014, p. 485).
The importance of SCM has been increasing since the mid-1990s, due to the increase of supply chains’ complexity, cost and uncertainty. This is a consequence of globalization, which has driven companies to move out-boarders, and to source, produce and sell their distributed products in the global environment (König and Spinler, 2016). Until more recently, SCM was not considered any different from logistics, by most of the researchers and practitioners. In fact, Logistics Management is a part of SCM because it represents the process of planning, controlling and implementing efficiency and effective flows of information and goods, from the raw materials to the end-consumer (Serdaris et al., 2014). SCM, on the other hand, can be seen has the integration of logistics with the rest of the business processes (Lambert and Cooper, 2000). Logistics activities are represented through transportation, warehousing and the integration of those activities in the entire
6 supply chain, while SCM focuses on merging those activities with the rest of the activities within the company, such as marketing, finance, operations, and with other businesses outside the company (Serdaris et al., 2014). As Lambert and Cooper (2000) mentioned, marketing is a great example to understand the Logistics and SCM concepts. The goal of marketing is to fulfill customers’ needs, but this concept does not apply only to the marketing department but rather to the entire company, because it is every department’s responsibility to focus on customers’ needs.
2.1.2. S
UPPLYC
HAINI
NTEGRATIONIn the past years, researchers have also focused their attention in understanding how company’s performance can be affected through supply chain integration. Integration can be defined as different parties working together, in a cooperative way, to achieve common goals and outcomes. This cooperation should happen both inside and outside the company’s boundaries since it can provide cost reductions and higher inventory turnovers (Jayaram and Tan, 2010). Although integration improves efficiency, by increasing the flow of goods and information across members, without a trustworthy method, managers might have difficulties in understanding the existing obstacles within the supply chain, which can later difficult that improvement (Janvier-James, 2012). With this said, there are two different types of integration: vertical and horizontal integration. While vertical integration refers to “the incorporation into a single corporate of several corporate involved in all aspects of a good’s production from raw materials to distribution”, horizontal integration “refers to the incorporation into a single corporate of several corporates involved in the similar level of production and sharing” (Janvier-James, 2012, p.199). Besides effectivity, supply chain integration can also provide agility to a supply chain (Panayides, 2006), which can have benefits such as greater flexibility to adapt to the constant changeable business environment and higher levels of customer satisfaction (Janvier-James, 2012).
7
2.2. T
RANSPORTATION2.2.1. I
NTRODUCTION TOT
RANSPORTATIONA SC has two different channels: the materials supply channel and the product or service distribution channel. As the name points itself, the materials supply channel represents all the organizations that provide materials to the manufacturing, while the distribution channel has the aim to provide the end-customer the final product/service. Therefore, transportation is one of the key activities in logistics (Ballou, 2004), because it is essential, in each company that the product is delivered where the demand took place (Binioris, 2008) (cited in Serdaris et al., 2014). Through the years, transportation went from a simple scheme where the final product was directly delivered to the end consumer, to a more complex distribution that includes middlemen. This means that distribution channels can have intermediary stops, called commodity centers that allow companies to decentralize the distribution of loads (Serdaris et al., 2014). With the advance of technology, other areas, such as supply chain, improved their operating processes. Transportation can go from simply collecting at the origin and delivering in the destination point, to additional functions like storage (Van Schijndel and Dinwoodie, 2000).
According to Serdaris et al. (2014), transportation services strategy is aligned with logistics management, meaning that quality, speed, cost reduction, technology access and risk management are essential factors. The choice of transportation should guarantee the company that the product is transferred without defects and damages and, at the same time, it should give the opportunity to easily enter in new markets as well as reducing inventory holdings, by having high transportation speed. Regarding cost reduction, transportation represents a big parcel in the logistics total costs, so decreasing transportation costs would allow companies to reduce this total cost. Besides this, when a company is determining the most suitable transportation service, attention should be paid to the risk that each mean of transportation and transportation service itself have, to be sure that the product is always available to the consumers. The most common means of transportation, according to Ballou (2004), Binioris (2008) (cited in Serdaris et al., 2014) and Neeraja et al. (2014), are:
8
Means of Transportation
Rail Road Water Air Pipelines
C
haract
er
ist
ics
Accessibility High High Medium Medium Low
Reliability Medium High High High High
Flexibility Low High Low Low Low
Capacity Medium Medium High Medium Low
Distance High Medium High High Low
Cost Low Medium Low High Low
Speed Medium Medium Low High Low
Table 1 - Means of transportation
Source: Author based on Ballou (2004), Binioris (2008) (cited in Serdaris et al., 2014) and Neeraja et al. (2014)
Nowadays, road transportation is the most common mean of transportation in Europe, since it can cover any shipping need (Sternberg et al., 2013). Sternberg et al. (2013) mention that it is the most suitable form of continental transportation for its flexibility. However, there is the possibility to move a cargo using two or more different means of transportation, at the same rate. This process is called multimodal transport and its main goal is to transfer the freight within the entire transport chain, at the lowest possible cost and time. Regardless the use of one or more means of transportation to move a cargo, the choice of transportation mean is a trade-off between customer service and cost (Serdaris
et al., 2014).
2.2.2. T
RANSPORTATIONU
NCERTAINTY ANDD
ELAYSAccording to Sanchez Rodrigues et al. (2008), uncertainty affects supply chains and, to overcome this barrier, companies try to track variations, which leads to cost increase, or even to be prepared for such events, by increasing their inventory, which leads to an increase in holding costs. Transportation managers must consider the uncertainty issue and have a flexible and responsive service that is able to fulfill the consumers’ needs. There are situations that occur out of company’s boundaries that managers must consider when planning the transportation, such as transit times, customers’ delivery windows, volume and transportation mode (Sanchez Rodrigues et al., 2008). Risk and uncertainty are different concepts that are many times confused. While risk is something that can be
9 predicted, as well as the impact that it might have on the supply chain, uncertainty is something that cannot be predicted, neither its impact on the company. Nevertheless, uncertainty increases with risk and risk is a consequence of uncertainty (Sanchez Rodrigues et al., 2008). Therefore, flexibility of transportation can be used as a competitive advantage (Naim et al., 2006) since it creates an efficient transportation strategy that can add value to the service offered to consumers (Villarreal et al., 2016). Flexibility doesn’t mean that companies should be able to cover all the possibilities, since is it very expensive but, instead, businesses should have a strategy that enables them to fulfill all the customers’ needs and minimize costs.
The transportation uncertainty is a consequence of the increasing outsourcing within the supply chain network, since it increases the supply chain complexity by making more difficult the information visibility and the communication among the members (Sanchez Rodrigues et al., 2008). Therefore, the integration of the supply chain becomes essential to have an effective supply chain. The transportation services can be provided by the company itself, by a third-party logistics or by a combination of both (Tracey, 2004).
10
2.3. O
UTSOURCING2.3.1. I
NTRODUCTION TOO
UTSOURCINGCompanies are becoming more aware that a good management of logistics activities can add value to the product or service distributed. They have three different ways to handle those activities, in an effective and efficiency way (Abdur Razzaque and Chen Sheng, 1998; Juga and Grant, 2010): making the service and have it in-house; own a logistics subsidiary or buying a logistics company; outsource the function and buy the service. According to Sloper (2004, p.34), outsourcing is “one of the fastest growing and evolving business activities worldwide”. Outsourcing, third-party logistics and contract logistics represent, in general terms, the same concept (Lieb et al., 1993, cited in Lambert et al., 1999) which has been increasing over the years (Abdur Razzaque and Chen Sheng, 1998; Berglund et al., 1999; Hertz and Alfredsson, 2003; Lambert et al., 1999), as well as the research on this topic (Marasco, 2008; Berglund et al., 1999). Recently, there has been paid more attention to this topic, among researchers and academics, and it led to an increase in the number of definitions presented in scholarly journals, trade publications and magazines (Marasco, 2008). While Skjoett-Larsen (2000) defines outsourcing as being the use of external companies to perform some or all the logistics activities of a company, Van Laarhoven et al. (2000) and Berglund et al. (1999) defend that the logistics activities being outsourced are, at least, warehousing and transportation management and execution, and other activities, such as inventory management, can be added. Nevertheless, in this report, the concept of outsourcing will be considered as the use of a logistics service provider to perform some or all logistics activities (the definition presented by Lambert et al., 1999).
There are several reasons behind the growth of outsourcing but the most mentioned cause in papers is globalization (Abdur Razzaque and Chen Sheng, 1998). With the increase of supply chains’ complexity, companies do not have enough knowledge to enter into different geographic markets, because they don’t have information and experience in performing in such places. Therefore, the need to use an external company to perform some or all logistics activities increases and many companies nowadays outsource the activities that they used to perform by themselves (Kremic et al., 2006). Nevertheless, logistics managers should keep the company’s core activities in-house and considering
11 the possibility of outsourcing in the remaining activities (Lieb, 1992; Sheffi, 1990). According to Damme and Amstel (1996) and Marchet et al. (2017), this decision should involve the entire organization, since it represents a strategic choice and it will affect the entire business for a long period of time. The “make-or-buy” decision should be taken having some considerations in mind: the cost differences between having the activity in-house or outsourcing, the demand fluctuations, the flexibility in responding to customers’ needs, the availability of personnel and equipment and the level of dependence on the activity (Damme and Amstel, 1996; Zhu et al., 2017). There is a need to look at the company’s plans and evaluate if the goal is to be a service leader or a cost leader. Eventually, if the decision is to outsource a certain activity, the third-party logistics chosen should complement the company’s weaknesses (Abdur Razzaque and Chen Sheng, 1998).
Eventually, when the company takes the decision to outsource, a long-term relationship is established between the outsourcer, the buyer of the service, and the outsourcee, the company providing the service (Lambert et al., 1999). This relation is usually called a partnership since, when successful, can bring competitive advantage to both companies by increasing profits, efficiency and customers service. On the other hand, not all relationships are successful, due to the unrealistic expectations that on or both parties might have over the agreement. Therefore, there is a lack in literature regarding the type of relationship to adopt according to different outsourcing situations. Lambert et al. (1999) developed a model that not only helps to decide if outsourcing should be integrated in the company’s strategy, but also to understand which type of relationship should be established. The success of outsourcing depends on the relationship established between the company and the logistics service provider. It should be based on faith and trust, without jeopardizing the control that the company must have over the activity or activities performed by the third-party logistics (Abdur Razzaque and Chen Sheng, 1998; Núñez-Carballosa and Guitart-Tarrés, 2011).
Although outsourcing is available for all logistics activities, transportation is the most outsourced service (Ashenbaum et al., 2015; ModusLink, 2016; Wilding and Juriado, 2004), while manufacturing, product design and assembly are in the bottom of the list (ModusLink, 2016). According to 66% of the respondents of the study conducted by
12 ModusLink Global Solution (2016), transportation seems to fit the criteria for logistics activities that can be outsourced because, usually, it is not a core-competence of the company and, therefore, a third-party logistics is able to reduce costs as well as to increase the service flexibility, due to the market knowledge. Rahman and Jim Wu (2011) summarized five recent academic works and concluded that transportation and distribution related activities were the outsourced logistics services with the higher percentage of use.
2.3.2. A
DVANTAGES ANDD
ISADVANTAGES OFO
UTSOURCINGAccording to Lambert et al. (1999), when companies take the decision to outsource a logistics service, their expectations are efficiency, profitability and customer service improvement. The TPL provider is able to offer more efficiency, due to the possibility of benefiting from economies of scale and, after adopting an outsourcing strategy, human resources, maintenance of equipment, licenses and regulations related to the logistics service, are no longer shipper’s responsibilities or concerns (Damme and Amstel, 1996; Zailani et al., 2017). Moreover, this business is recognized for lowering logistics costs, by many authors (Abdur Razzaque and Chen Sheng, 1998; Batarlienė and Jarašūnienė, 2017; Kremic et al., 2006). However, previously, in some cases, outsourcing might not have brought reduction of costs (Lacity et al., 1995; Loh and Venkatraman, 1992). According to a study conducted on different states in USA (Yusuf and O’Connell, 2013, p. 488), most of the respondents believe that outsourcing is “more likely to improve quality than reduce costs”.
There are many papers mentioning the benefits of outsourcing, but the risks are not so well known (Kremic et al., 2006; Lambert et al., 1999). Still, some disadvantages have already been identified (Batarlienė and Jarašūnienė, 2017; Damme and Amstel, 1996). Regarding transportation, the buying company no longer has the same direct customer contact as it used to have and, therefore, the feedback received takes longer to reach the logistics managers, affecting the response capability of the company. Without underestimating the previous risks, the lack of control (Damme and Amstel, 1996; Zailani
et al., 2017) is one of the disadvantages that most concerns managers (Lieb and Randall,
1996). Likewise, the service level and the true cost of outsourcing are seen as uncertainties that can affect the company’s performance. Lastly, the dependence on the
13 TPL is also a disadvantage and, to minimize this issue, companies should have more than one supplier for that service (Damme and Amstel, 1996).
2.4. D
ELIVERYP
ERFORMANCEM
EASUREMENT2.4.1. S
ERVICEQ
UALITYD
EFINITIONOver the last three decades, quality management research has been increasing among academics (Cheng et al., 2005). Ghobadian et al. (1994) mentioned that, in many manufacturing industries, service quality can be more important than product quality, in terms of long-term relationships and profitability. Therefore, in order to pursue this research, it is important to understand the definition of “service quality”. According to Parasuraman et al. (1988), service quality represents the difference between customers’ perceptions and expectations, through the impression of superiority they have over a service provider and its services (Bitner and Hubbert, 1994). In a service organization, quality is “a measure of the extent to which the service delivered meets the customer’s expectations” (Ghobadian et al., 1994, p.49). Parasuraman et al. (1988) developed a perceived quality model, SERVQUAL, which many researchers tried to replicate to different situations. The research conducted by Bienstock et al. (1996) concluded that SERVQUAL is not suitable for physical distribution. The service quality measurement needs to be adapted to each business, since the type of service, situation, need and other factors vary (Seth et al., 2005).
According to Gunasekaran et al. (2004), the link between the supply chain and the customer is the service/product delivery. Consequently and in order to increase the competitive advantage, there is a need to measure and improve this process (Gunasekaran
et al., 2004). Many companies have been relying on Logistics Service Providers (LSPs)
to perform logistics activities, since outsourcing has been recognized for cost reduction and performance improvement (Aguezzoul, 2014). Van Iwaarden and van der Valk (2013) classify quality has being essential among service triads, since the purchased service is directly delivered to the customer by the service provider. The buying organization is highly dependent on the service provider’s performance, which is reflected in the organization’s performance as well.
14 The topic of service quality has already been studied in different areas, such as marketing, operations management, purchasing and supply chain but it doesn’t seem to quite address the issue of triads (van Iwaarden and van der Valk, 2013).
2.4.2. P
ERFORMANCEM
EASUREMENTAccording to Fawcett and Cooper (1998), Performance Measurement is essential to every company’s success. The results of this research showed that many leading companies invest on performance measurement, which is later reflected on functional excellence. This evaluation is essential, especially in relationships with logistics service providers, since it enables the company to measure the variation of service, cost and quality with outsourcing (Wilding and Juriado, 2004). Therefore, it has been increasing its relevance among researchers and academics (Folan and Browne, 2005)
The service quality assessment can be performed in three different levels, inside an organization: organizational, operational and task levels (van Iwaarden and van der Valk, 2013). However, when considering service triads, some logistics processes are no longer managed inside the organization’s boundaries. At this point, other departments of the organization can have impact on this evaluation. For example, the purchasing department is responsible for selecting the service providers and they can, from the start, apply measures for supplier quality management. Besides, instead of only considering ex-post evaluation measures in the suppliers’ performance assessment, ex-ante measures should also be applied (van Iwaarden and van der Valk, 2013). The study conducted by Ellram
et al. (2007) suggested that the control of service delivery, within triads, should have in
consideration the Service Level Agreements (SLA), since they enable such evaluation. Furthermore, incentives and involvement activities also provide control, as well as more motivation and trust from service providers.
Distribution has been recognized has an essential activity, among supply chains, in delivering customer service. Besides, contrarily to production activities, which have been mechanized or automated and its costs have been decreasing, distribution costs have actually increased. This has led managers to pay special attention to distribution performance (Ploos van Amstel & D'hert, 1996; Sanchez Rodrigues et al., 2014).
15 Performance measurement in distribution involves the shippers and the customers, on the input and output sides, respectively. This enables a deeper analysis, which is very important to create higher efficiency and effectiveness than the competitors (Lai et al., 2002).
2.4.3. K
EYP
ERFORMANCEI
NDICATORS(KPI
S)
According to Krauth et al. (2005), Key Performance Indicators (KPIs) are typically used to analyze a significant amount of data, in order to evaluate the past performance of the company. KPIs differ from metrics, because they evaluate the company’s performance in comparison to an established goal (Eckerson, 2009). Even so, managers should not see KPIs as an end-measure but rather as a tool to improve service quality (Krakovics et al., 2008). Even though performance measurement has been stated, by many researchers, as an essential process, the KPIs that should be used in this process are not so well defined (Wilding and Juriado, 2004). This happens because the definition of the KPIs depends on every company’s strategy, goals and state (Krauth et al., 2005).
The most common attributes of transportation, also mentioned as freight forwarding by Jothimani and Sarmah (2014), are reliability, responsiveness, flexibility, cost measures and asset management efficiency. Within these categories, these authors defined KPIs, which are summarized in Table 2. Besides, according to Kayakutlu and Buyukozkan (2011), the performance attributes regarding this logistic activity are: fleet, distance travelled, driver force, loss of goods and relocation rate. Fawcett and Cooper (1998) also defined KPIs, within the categories termed by traditional measurement systems (asset management, cost, customer service, productivity and quality). These KPIs are summarized in Table 2, as well.
16 Author(s) Performance
Attribute(s) Key Performance Indicators (KPIs)
Fawcett and Cooper (1998)
Customer service Average transit time, Transit time variability Productivity Orders delivered per vehicle, Full versus partial loads
Quality Damage in transit, Documentation accuracy
Jothimani and Sarmah (2014)
Reliability Carrier reliability, Geographical coverage, Service failure, Cargo damage rate, Customer referral value Responsiveness Response delay index, Number of shipments responded
to on time
Flexibility Route flexibility, Payload flexibility, Split house handled, Capacity utilization
Cost measures Freight cost per km, Accessorial charge index, Claims as percent of payable
Asset management efficiency
Cash-to-cash cycle time, Outstanding payable, Utilization of specific purpose equipment Table 2 - Transportation KPIs
Source: Author based on Fawcett and Cooper (1998) and Jothimani and Sarmah (2014)
According to the study conducted by Wilding and Juriado (2004) over European companies, performance measurement is common among triads and companies are considering the continuous development of KPIs. In the KPIs’ definition, organizations should assure that they are “sparse, drillable, simple, actionable, owned, referenced, correlated, balanced, aligned and validated”, in order to translate significant results (Eckerson, 2009, p.18).
Delivery performance can be measured through on-time delivery (Gunasekaran et al., 2001; Krauth et al., 2005) and through delivery-to-request rate, delivery to commit date, order fill lead-time and goods in transit (Stewart, 1995). In fact, it can act as a measure for customer service level (Gunasekaran et al., 2001; Krauth et al., 2005). The quality and quantity of information across the entire supply chain is very important, not only in the delivery, but also in the other activities as well. It plays an essential role for performance measurement and improvement (Gunasekaran et al., 2001).
17
2.5. W
AREHOUSING2.5.1. I
NTRODUCTION TOW
AREHOUSINGWarehouses are used to store products, which not only include finished goods but also raw materials, components and goods in process (Min, 2015). According to Frazelle (2002) and Ghiani et al. (2013), warehouses are playing a crucial and determinant role in companies’ performances.
The increasing demand for more product variety, smaller orders and shorter response times has been affecting the way managers handle logistics operations (Rouwenhorst et.
al, 2000). Due to these situations, warehouses are now “executing more and smaller
transactions, handling and storing more items, providing more product and service customization, offering more value-added services, processing more returns and receiving and shipping more international orders” (Frazelle, 2002, p. 224). The wider variety of stock keeping units (SKUs) has led companies to centralize their distribution centers (DCs), moving from many small DCs to fewer large DCs (van den Berg and Zijm, 1999).
Achieving transportation and production economies, through combined shipment, full-truck loads and make-to-stock production policies, are some of the main warehousing advantages (De Koster et al., 2007). Besides, warehouses are also useful for storage, trans-shipments (cross docking activities), product consolidation, overcome market conditions and uncertainties and purchase discount advantages (De Koster et al., 2007). Since warehousing is an expensive part of the supply chain, its ownership needs a careful consideration (Ballou, 2004). Managers can decide to have their own facilities – private warehouse – or opt by using rented spaces (Waters, 2009). The last ones can either be public warehouses or services offered by logistic service providers (Ballou, 2004). Private warehouses require a high initial investment in both space and material handling equipment (Waters, 2009) but, at the same time, offer advantages such as greater control over warehousing operations, possibility of tax advantages, possibility of using the space for different future needs, increase operations reliability by having those actives inside the company’s boundaries, facilitate communications across the entire supply chain and lower costs by not having another entity that requires profit (Ballou, 2004).
18 There are several types of warehouses, which vary according to their functionality and position within the logistics system (Ghiani et al., 2013); they have impact on costs and flexibility (Min, 2015). While private warehouses have infinite layouts, due to each company’s needs, public warehouses are more standardize because they need to meet different requirement within the same space (Ballou, 2004). These publics’ warehouses can be commodity warehouses, bulk storage warehouses, temperature-controlled warehouses, household goods warehouses, general merchandising warehouses or miniwarehouses. The decision underneath the warehouse holding represents a “make-or-buy” decision: comparing to public warehouses, in private warehouses the initial cost is higher but the additional cost per unit is lower (Waters, 2009).
The most common activities within a warehouse are described in Figure 1. In some situations, warehouses are also used for prepackaging, packaging and/or pricing (Frazelle, 2002).
Figure 1 - Common Activities in Warehouses Source: Frazelle (2002)
The flow of materials inside the warehouse starts with the receiving activity. Once the goods are unloaded at the receiving docks, a quality and quantity inspection is performed as well as an inventory update (De Koster et al., 2007; Frazelle, 2002; Rouwenhorst et.
al, 2000; van den Berg and Zijm, 1999). In case the incoming storage modules are not the
required, the load can be subjected to reassembly to meet the storage-cube requirements (Frazelle, 2002; van den Berg and Zijm, 1999). Then, the products are transferred to the storage locations. Once the order is placed, the order picking process begins. An order represents the right products and quantities requested by a set of customers or other workstations (De Koster et al., 2007; van den Berg and Zijm, 1999). This process can be
19 manual or partially automated (Rouwenhorst et. al, 2000). In case products are assembled for a more convenient use, they must be repackaged. Delaying this process can have advantages such as higher flexibility in the inventory use (Frazelle, 2002). The products need to be sorted and accumulated if that task is not done during the order picking. Finally, the order is ready, it is stacked (in pallets, for example), if possible, and loaded in trucks, containers or other carriers (De Koster et al., 2007; Rouwenhorst et. al, 2000). The receiving and shipping activities are the connection between the material flow and the warehouse, which require schedules for loading and unloading. The storage goal is to “achieve high space utilization and facilitate efficient material handling” (Gu et al., 2007, pp. 3).
According to Frazelle (2002), after applying a survey to the members of the Warehousing Education and Research Council, order picking is the prior warehouse activity in terms of productivity improvement.
2.5.2. O
RDERP
ICKING ANDP
ICKINGP
OLICIESOrder picking is a warehouse activity, which consists in the retrieving items from storage to meet customers’ specific orders (De Koster et al., 2007; Henn and Wäscher, 2012; Petersen, C. G., & Aase, G., 2004; Roodbergen et al., 2008). According to Dallari et al. (2009), this process is increasing its importance within supply chains, not only in production, by supplying other production stations with the necessary kits, but also in physical distribution, through customer order fulfilment. This process is usually followed by pickup and delivery operations (Hwang and Cho, 2006). The increasing order variety and volume (Rouwenhorst et. al, 2000) has been an important contribution to the order picking activity development (Henn and Wäscher, 2012). More importantly, order picking is being recognized as the most labor-intensive and costly activity within almost every warehouse, representing around 55% of the overall warehousing costs (De Koster
et al., 2007).
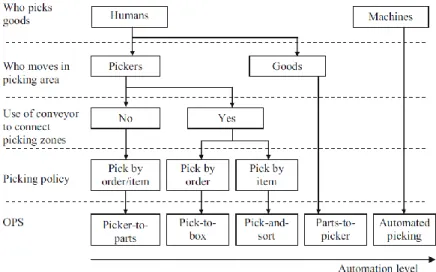
There are many order picking systems (OPSs) and it is possible to see more than one OPS within the same warehouse (De Koster et al., 2007). These systems have been studied by many researchers, among them Dallari et al. (2009), who proposed an OPSs classification, as demonstrated in Figure 2.
20
Figure 2 - Order picking systems Source: Dallari et al. (2009)
Dallari et al. (2009) classified OPSs according to four main topics: the picking performer, the picking mover, the use of conveyors in the picking zone and the picking policy (order or item). The level of automation increases from “picker-to-parts” to “automated picking” and the most common OPSs are performed by humans.
In the first, “picker-to-parts”, pickers walk or drive through the aisles to retrieve items for simple or multiple orders, depending on the picking policy. The main policies are picking by order – discrete picking – and picking by article – batch picking (De Koster et al., 2007). In the first (discrete picking), it is very common to have a “sort-while-picking” system, which means the picker sorts the items during the order picking. In other cases, the sorting process only takes place after the picking is finished – “pick-and-sort” (De Koster et al., 2007). This OPS has many space for improvement, since it depends on routes, products allocation and picking device operations.
The “pick-to-box” system can be distinguished from the previous OPS, since the warehouse is divided into different picking zones, which are assigned to different pickers. These areas are connected through conveyors, which are used to place partial or completed orders. This OPS is characterized by the reduction of travel times but, on the other hand, there are some disadvantages regarding the amount of work between picking zones.
The “pick-and-sort” order picking system is like the “picker-to-box”, excluding the fact that the picker is responsible for picking a single item, in the amount ordered.
21 The only OPS which is characterized by the movement of goods, is the “parts-to-picker”. In this case, an automated device retrieves unit loads (for example, pallets) from the storage and brings them to the picking bay/position, a depot, where the picker selects the amount required in the order (De Koster et al., 2007). The remaining items are returned to the storage. It enables labor and space cost reductions. On the other hand, the picker needs to wait for the items to be retrieved, which might cause delays in his performance, leading to a decrease in productivity, usually measured by number of items picked per hour (Caron et al., 2000).
Lastly, the automated picking is performed by robots or dispensers.
2.5.3. S
TACK-
UPP
ROBLEMThe order picking process is essential to fulfill customers’ orders (Dallari et al., 2009) but, at the same time, it represents a problem to the delivery industry, when loading and transporting such unit loads, since customers order many SKUs (Rethmann and Wanke, 2001). According to Terno et al. (2000), this problem has been emerging in distribution centers, due to the need to reduce the number of pallets used, to decrease transportation costs.
Contrarily to the Manufacturer’s Pallet Loading Problem (MPLP), which objective is to maximize the pallet utilization, by placing as many identical items as possible (Bhattacharya et al., 1998), the Stack-Up Problem, also known as Distributor’s Pallet Loading Problem (DPLP) (Terno et al., 2000), deals with several non-identical items (Rethmann and Wanke, 2001). Yaman and Şen, 2008 report the case of a Turkish beverage company that was pressed by its customer to create mixed pallets, forcing employees to break-up full pallets, pick products and mix them in a different pallet. Although this process leads to costs increase, it also allowed company to sell its products to smaller size retailers. Customers no longer have to order a full pallet of each product, which means they have higher flexibility to order the desired quantities. According to Yaman and Şen (2008), there are two different types of warehouses, concerning the capability to design mixed pallets: warehouses which can easily design and create mixed pallets and warehouses without that capability. In the first case, the decision of how many products and which quantity is placed in the pallet is taken by each order requirement. In
22 case the warehouse is not capable of creating a different pallet for each order, the most common solution is the creation of standardized pallets, which are previously studied by managers to be able to meet most of the order requirements. Nevertheless, the design of a mixed pallet is a challenge for logistics, due to product dimension and weight differences (Yaman and Şen, 2008). There are many considerations that need to be assessed when loading a pallet with different SKUs, as it is showed in Table 3.
Condition Description
Weight There is a weight limit for the total of items in a pallet
Placement The density of each product varies, so there are some products which cannot be under other products
Splitting
If an order of a certain SKU is large enough to complete one uniform pallet, then it should be done. On the other hand, if it is not, all SKUs should be kept together to make loading and unloading activities easier. The only exception to this condition is if the number of pallets being used can be reduced by dividing the same SKU in different unit loads.
Connectivity During the pallet loading, it is not allowed that the person who is performing such
activity needs to go to the storage several times.
Stability The pallet should be stable enough to be transported to the customer.
Table 3 - Loading Conditions Source: Author based on Terno et al. (2000)
The literature regarding the packing problem has been evolving over the years and researchers are now paying attention to other factors, such as stability and weight (Bischoff, 2006). This means that managers are now concerned with different aspects in pallet loading, such as weight distribution: the heavier product should be in the bottom, while the lighter should be placed on top. According to Bischoff (1991) and Bortfeldt and Wäscher (2013), pallet stability is important, not only from a transportation point of view, but also for storage optimization. The first author also emphasis that “in pallet based distribution systems even small relative improvements in the palletization efficiency of a product can often represent significant overall savings in absolute terms” (Bischoff, 1991, p.190).
23
2.5.4. W
AREHOUSED
ESIGN ANDS
TORAGEA
SSIGNMENTThe warehouse design is a strategic decision, to be taken by the company, to reduce the overall costs of investment, management, risk and operation (Ghiani et al., 2013). Therefore, the warehouse layout optimization is fundamental to achieve this goal and it has been discussed by researchers during the last few decades. (Rakesh and Adil, 2015). According to Min (2015), this process begins with space planning and optimization, which should meet storage and material handling requirements like, for example, the types of racks and the equipment (Roodbergen et al., 2008). This choice is highly associated with the products’ characteristics and demand frequency (Roodbergen
et al., 2015). For example, fast moving products tend to be stored on flow racks, meaning
they have a quick replenishment, while smaller and low-demand products tend to be kept in shelving racks, which are less expensive. Therefore, the outcome must assure that the chosen layout meets the necessary requirements and optimizes the warehouse performance (Roodbergen et al., 2015).
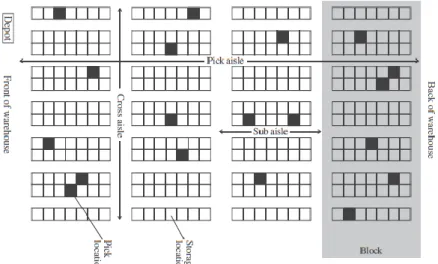
The following figure describes a simple order picking warehouse. It contains pick aisles, cross aisles and sub-aisles. The pick aisles are where the product is picked from, the cross aisles are used to move between pick aisles and the sub-aisles form blocks (Roodbergen
et al., 2015).
Figure 3 - Order Picking Area Example Source: Roodbergen et al. (2015)
24 Besides the layout choice, there are three other strategic and operational decisions that need to be taken, when designing a new warehouse or reorganizing existing facilities (Chan and Chan, 2011). They are picking, routing and storage assignment policies. As it was mentioned in Section 2.5.2., the picking policies depend on who performs the actions and the way the items are picked. The routing policies are usually solved through heuristics, which define the route from the starting point, where the picker receives the picking list, until the end (Chan and Chan, 2011). Regarding the storage assignment policies, this decision is affected by the remaining choices, meaning that it depends on the size and layout of the warehouse, product characteristics, among others. This is one of the most difficult decisions faced by managers when designing the warehouse (Chan and Chan, 2011).
During the storage process, previously mentioned, the products are allocated to storage locations (Rouwenhorst et al., 2000). The storage assignment categories defined by Hausman et al. (1976), are still a reference for managers: dedicated storage, random storage and class-based storage. The first two represent extreme cases of the class-based assignment storage strategy (Fontana and Cavalcante, 2014). The dedicated storage has specific storage locations for each product, which means that each product is a separate class (Li et al., 2008). On the other hand, the random storage incorporates all products within the same class, so the products’ location might vary through the entire storage area. The class-based storage, as the name points itself, is the division of all SKUs in several classes. Then, these classes are allocated to specific zones in the warehouse. More recently, Rouwenhorst et al. (2000) have identified other class, correlated storage or family grouping, which strategy is to storage nearby products that are commonly order together.
The most common storage location rule, known by Cube-per-Order Index (COI), was proposed by Heskett, in 1963 (cited in Fontana and Cavalcante, 2014, p. 1616). It expressed “the ratio of storage space required (cube) per SKU and the order frequency of the SKU”. The SKU with the lowest ratio would be placed in the nearest position to the input/output point. This strategy allowed cost reduction in the order picking process, by minimizing the travel distances.
25
2.6. S
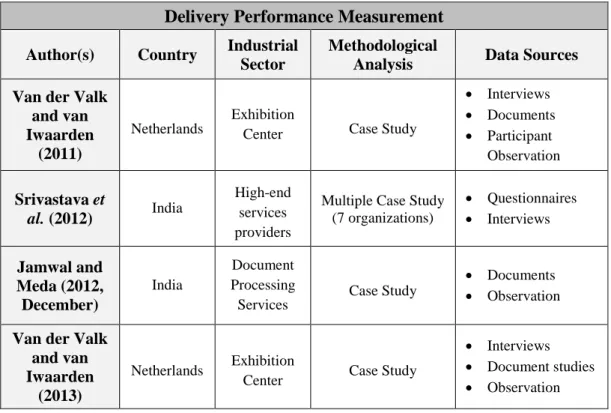
IMILAR STUDIESAs it was already mentioned, outsourcing is a new topic of discussion among researchers and the increasing use of service logistic providers has been the main reason for this development. Nevertheless, there are many studies discussing the quality control among companies, but few of them focus on triads. The main goal of those studies (presented in Table 4) was to understand how companies can measure the logistics service providers’ service quality. In conclusion, it is possible to do this assessment but, most of the models already developed, need to be restructured, if they are going to be applied to a different context. Besides, the service quality of logistics service providers should not only be assessed in the final stage of the process. In the selection of those parties, performance measures should be, from the beginning, applied, in order to facilitate this evaluation in the future.
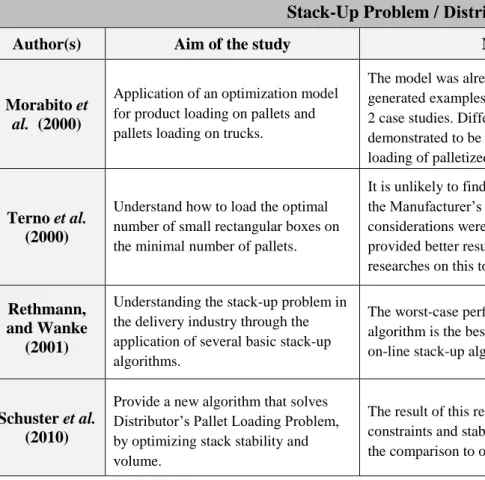
The stack-up problem is another issue which concerns managers and that is related with the topic under study. Not only it affects the manufacturers but also the distributors. Therefore, many algorithms have already been proposed to optimize the stack-up process, which can lead to transportation cost savings. However, most of those algorithms refer to the manufacturer pallet loading problem (MPLP). In other cases, the algorithms do not take into account all the restrictions necessary to consider the possibility of stacking. Table 5 synthetises the characteristics of some of the similar studies related to this subject.