CERN-EP/2016-178 2017/01/06
CMS-EXO-12-055
Search for dark matter in proton-proton collisions at 8 TeV
with missing transverse momentum and vector boson
tagged jets
The CMS Collaboration
∗Abstract
A search is presented for an excess of events with large missing transverse momen-tum in association with at least one highly energetic jet, in a data sample of proton-proton collisions at a centre-of-mass energy of 8 TeV. The data correspond to an in-tegrated luminosity of 19.7 fb−1 collected by the CMS experiment at the LHC. The results are interpreted using a set of simplified models for the production of dark matter via a scalar, pseudoscalar, vector, or axial vector mediator. Additional sensi-tivity is achieved by tagging events consistent with the jets originating from a hadron-ically decaying vector boson. This search uses jet substructure techniques to identify hadronically decaying vector bosons in both Lorentz-boosted and resolved scenarios. This analysis yields improvements of 80% in terms of excluded signal cross sections with respect to the previous CMS analysis using the same data set. No significant ex-cess with respect to the standard model expectation is observed and limits are placed on the parameter space of the simplified models. Mediator masses between 80 and 400 GeV in the scalar and pseudoscalar models, and up to 1.5 TeV in the vector and axial vector models, are excluded.
Published in the Journal of High Energy Physics as doi:10.1007/JHEP12(2016)083.
c
2017 CERN for the benefit of the CMS Collaboration. CC-BY-3.0 license ∗See Appendix B for the list of collaboration members
1
Introduction
Several astrophysical observations, including those of the radial distribution of galactic rota-tional speeds [1–3] and the angular power spectrum of the cosmic microwave background [4, 5], suggest an abundance of a nonbaryonic form of matter in the universe. The existence of dark matter (DM) provides some of the most compelling evidence for physics beyond the standard model (SM) of particle physics [6, 7]. In many theories that extend the SM, production of DM particles is expected at the LHC. Monojet searches [8–14] provide sensitivity to a wide range of models for DM production at the LHC, while mono-V (where V=W or Z boson) searches [15– 18] target models for DM production associated with SM V-bosons. While the mono-V searches target more specific models, they benefit from smaller SM backgrounds. The interpretation of results from these and other DM searches at the LHC has typically used effective field theories that assume heavy mediators and DM production via contact interactions [19–21]. The results of this analysis are interpreted in the context of a spin-0 or spin-1 mediator decaying to a pair of DM particles, using a set of simplified DM models [22–25] that span a broad range of me-diator and DM particle masses, for a specific benchmark point in the model parameter space. In the limit of large mediator masses, these simplified models are well reproduced by the EFT approach. The models provide a simplified description of DM production that is applicable across the full kinematic region accessible at the LHC. Furthermore, within the framework of these models, a straightforward comparison can be made of the limits obtained by LHC exper-iments with those of direct detection (DD) experexper-iments.
This paper presents a search for new phenomena leading to an excess of events with least one energetic jet and an imbalance in transverse momentum in proton-proton collisions at a centre-of-mass energy of 8 TeV. The data, corresponding to an integrated luminosity of 19.7 fb−1, were collected using the CMS detector at the CERN LHC. This was the first CMS search to target the hadronic decay modes of the V-bosons in the mono-V channels. The mono-V search uses techniques designed to exploit information available in the jet’s substructure when the V-boson is highly Lorentz-boosted. Additionally, the search uses a multivariate V-tagging technique to identify the individual jets from moderately boosted V-bosons.
The events are categorized according to the most likely origin of the jets in the event. The signal extraction is performed by considering the missing transverse momentum distribution in each event category, and using multiple data control regions to constrain the dominant backgrounds. These updates to the previous CMS monojet analysis [9] yield improvements of roughly 80% in terms of cross section exclusion limits, using the same data set.
This paper is structured as follows: Section 2 provides a description of the CMS detector and object reconstruction; Section 3 outlines the DM models explored as signal hypotheses; Section 4 provides a description of the event selection and categorization used in the search; Section 5 describes the modelling of backgrounds used in the signal extraction; Section 6 presents the results and interpretations in the context of simplified models for DM production.
2
The CMS detector and object reconstruction
The CMS detector, described in Ref. [26], is a multi-purpose apparatus designed to study
high-transverse momentum (pT) products of energetic proton-proton and heavy-ion collisions. A
superconducting solenoid surrounds its central region, providing a magnetic field of 3.8 T par-allel to the beam direction. Charged-particle trajectories are measured by the silicon pixel and strip trackers, which cover a pseudorapidity (η) region of|η| < 2.5. A lead tungstate crystal
2 3 Signal hypotheses
surround the tracking volume and cover|η| <3. The steel and quartz-fiber Cherenkov forward
calorimeter extends the coverage to|η| <5. The CMS muon system consists of gas-ionization
detectors embedded in the steel flux-return yoke outside the solenoid, covering|η| < 2.4. The
first level of the CMS trigger system, composed of specialized hardware processors, is designed to select the most interesting events in less than 4 µs, using information from the calorimeters and the muon detectors. The high-level trigger processor farm is used to reduce the recorded event rate to a few hundred events per second.
The particle-flow (PF) algorithm reconstructs and identifies each individual particle with an optimized combination of information from the various elements of the CMS detector [27, 28]. Jets are reconstructed by the clustering of PF objects using both the anti-kTalgorithm [29] with
0.5 as the distance parameter (AK5), and the Cambridge–Aachen algorithm [30] with 0.8 as the distance parameter (CA8). The jets used in this analysis are required to pass standard CMS identification criteria [31]. The jet momenta are corrected for contamination from additional interactions in the same bunch crossing (pileup) on the basis of the observed event energy density [32]. Further corrections are then applied to calibrate the absolute scale of the jet en-ergy [31].
The missing transverse momentum vector~pTmiss is defined as the negative vector sum of the pT of all final state particles that are reconstructed using the PF algorithm [33]. The magnitude
of ~pmiss
T is referred to as ETmiss. Events with a large misreconstructed ETmiss are removed by
applying quality filters on the tracker, ECAL, HCAL, and muon detector data.
3
Signal hypotheses
The signal hypotheses in this search are a set of simplified models for DM production [22–24]. These models assume the existence of an additional particle, a fermionic DM candidate, and an additional interaction that mediates the production of DM. In particular, it is assumed that this additional interaction is mediated by a generic spin-0 or spin-1 particle. The interactions are characterized by four Lagrangians, written for a Dirac-fermion DM particle χ with mass mDM,
and a vector (Z0), axial vector (A), scalar (S), or pseudoscalar (P) mediator with mass mMEDas,
Lvector ⊃ 1 2m 2 MEDZ0µZ0 µ −gDMZ0µχγ µ χ−gSM
∑
q Z0µqγµq−m DMχχ, (1) Laxial vector ⊃ 1 2m 2 MEDAµAµ−gDMAµχγµγ5χ−gSM∑
q Aµqγµγ5q−mDMχχ, (2) Lscalar⊃ − 1 2m 2 MEDS2−gDMSχχ−gq∑
q=b,t mq v Sqq−mDMχχ, (3) Lpseudoscalar⊃ − 1 2m 2 MEDP2−igDMPχγ5χ−igq∑
q=b,t mq v Pqγ 5q −mDMχχ, (4)where v = 246 GeV is the SM Higgs potential vacuum expectation value [34]. For the vector
and axial vector mediators, the terms gDM and gSM denote the couplings of the mediator to
the DM particle and to SM particles, respectively. In all models considered, these couplings
are assumed to be unity (gSM = gDM = 1). For the vector and axial vector mediators, this
implies that the coupling is universal between the mediator and quarks of all flavours. For the scalar and pseudoscalar models, gq =1 is assumed for all quark flavours, which implies a
SM Higgs-like coupling of the mediator to the SM fermions. The split in terms of axial vector and vector mediators in the Lagrangian parallels the existing separation in DD experiments,
into spin-dependent (SD) and spin-independent (SI) interactions; SI can refer to either vector or scalar mediated interactions while SD interactions refer to axial vector mediated processes. Pseudoscalar DM-nucleon interaction cross sections are suppressed at non-relativistic DM ve-locities, leading to a limited sensitivity for DD experiments to this type of interaction [35, 36]. For spin-1 signatures, the DM production process is analogous to Z boson production via quark scattering, as shown in Fig. 2. The mono-V and monojet signatures follow from initial-state radiation (ISR) of a V-boson and quark or gluon, respectively. Constraints on these models for spin-1 mediators can be imposed, based on the results of searches for visible decays of the mediator [37–39], including dijet resonance searches [40]. Typically, dijet resonance searches are interpreted assuming mediator widths that are much smaller than the mediator mass [40–42], while for the coupling parameter values used in this paper, the width of the spin-1 mediator is roughly 40–50% of its mass.
The scalar and pseudoscalar models can be extended by allowing the scalar and pseudoscalar interactions to undergo electroweak symmetry breaking in an analogous way to the Higgs mechanism [43–49]. In such spin-0 models, the coupling of the mediator to SM quarks can be mass-dependent as parameterized in Eqs. (3) and (4). In these models, the production of DM at hadron colliders occurs predominantly through gluon-fusion via a top quark loop as shown in Fig. 1 (left). When couplings of the mediator to vector bosons are present, mono-V signatures are produced through a radiative process, as indicated in Fig. 1 (right). The scenario in which couplings between the mediator and vector bosons are not considered, is denoted herein as fermionic. For fermionic models, the mediator width is calculated assuming that it couples only to quarks and DM particles. This is referred to as the minimal width constraint. For the case in which couplings between the mediator and V-bosons are allowed, the width is modified to account for the additional contributions that arise [34].
To model the contributions expected from these signals, simulated events are generated, at leading order (LO) precision, usingMCFM6.8 [50] for the monojet signature and JHUGEN5.2.5 [51] for the mono-V signature. Large modifications to high-pTproduction of a spin-0 mediator,
produced via gluon-fusion in association with jets, are expected when the actual mass of the top quark is used, rather than assuming it to be infinite [52, 53]. This effect is taken into account in the generation of the scalar and pseudoscalar signals and in the calculation of their cross sec-tions. The NNPDF3.0 set of parton distribution functions (PDF) is used to specify the inputs in the signal generation [54]. The generated events are interfaced with PYTHIA6.4.26 [55] for
parton showering and hadronization with the underlying event tune Z2* [56]. For the mono-jet signal, the generation is performed using the mediator mass for the renormalization and factorization scales. The mediator mass is also used for the scale in the parton showering (PS). Higher-order QCD and electroweak effects are not considered in the generation of the monojet signal. Alternative signal samples for the spin-1 mediators, generated withPOWHEG2.0 [57–61] at next-to-leading order (NLO) precision, followed byPYTHIA 8.212 [62] with the underlying event tune CUETP8M1 [63] for the description of fragmentation and hadronization, have been considered. The mediator pTis used, instead of the mediator mass, as the choice for the
renor-malization, factorization, and PS scales. Using the alternative samples results in a reduction in the expected signal yield of up to 80% for the spin-1 mediators with mMED > 400 GeV. Signal
samples for the spin-0 mediators were also generated withPOWHEG(at LO precision) with the same scale choices as used for spin-1 samples. Using these samples results in a reduced signal yield in the relevant kinematic region, by up to 30% when mMED < 400 GeV. The reduction
in signal yields predicted by the alternative samples translates to a reduction of the exclusion
4 3 Signal hypotheses
and spin-0 mediators, respectively. Higher-order electroweak effects are expected to reduce the yield of the mono-V signal, for spin-0 mediators, by up to 15% at large mediator pT [64],
while NLO QCD corrections are expected to increase the yield by roughly 25% [65].
g g t t t t g S/P χ χ S/P χ χ V∗ V q′ q q q′
Figure 1: Diagrams for production of DM via a scalar (S) or pseudoscalar (P) mediator in the cases providing monojet (left) and mono-V (right) signatures.
Z′/A χ χ q q q g Z′/A χ χ q q q V q′ q
Figure 2: Diagrams for production of DM via a vector (Z0) or axial vector (A) mediator provid-ing monojet (left) and mono-V (right) signatures.
To compute the SM background expectation, simulated samples are produced at LO for the Z+jets, W+jets, tt, and QCD multijet processes using MADGRAPH5.1.3 [66] interfaced with PYTHIA 6.4.26 for hadronization and fragmentation, where jets from the matrix element
cal-culations are matched to the parton shower, following the MLM matching prescription [67].
Additionally, a single top quark background sample is produced at NLO with POWHEG 1.0,
and a set of diboson and γ+jets samples are produced at LO withPYTHIA 6.4.26. All of the simulated background samples are generated using the CT10 PDF set [68]. The underlying event description is provided by the Z2* tune in the signal and background simulation.
The generated signal and background events are interfacted with GEANT4 [69] to simulate the
CMS detector response. The simulated samples are then corrected to account for the distribu-tion of pileup interacdistribu-tions observed in the 8 TeV data set. All signal and background samples are additionally corrected to account for the observed mismodelling of hadronic recoil in sim-ulation, following the procedure described in Ref. [33].
4
Event selection and categorization
Candidate signal events are selected by requiring large values of ETmissand one or more high-pT jets. The data used for this analysis are collected using two EmissT triggers. The first requires
ETmiss > 120 GeV, where the EmissT is calculated using a PF reconstruction algorithm that only uses information from the calorimeters, while the second requires EmissT > 95 GeV or EmissT > 105 GeV, depending on the data taking period, together with at least one jet with pT >80 GeV
and|η| <2.6.
Selected events are required to have EmissT >200 GeV to ensure a trigger efficiency greater than 99% for all events used in the analysis. The azimuthal angle φ between the~pTmiss and the highest-pT(leading) jet, |∆φ(~pTmiss, j)|, is required to be larger than 2 radians to reduce the
contribution from QCD multijet events. Events are vetoed if they contain at least one well-identified electron, photon, or muon with pT >10 GeV, or a τ lepton with pT >15 GeV [70–73].
The electron, τ lepton, and photon vetoes require that the identified object be isolated, by using standard PF isolation algorithms [74].
Selected events are classified according to the topology of the jets to distinguish between ISR of a quark or gluon, and hadronic V-boson decays, which can be either highly Lorentz-boosted or resolved into two jets. This approach results in three independent classes of events that are referred to as the monojet, V-boosted, and V-resolved categories. The V-boosted and V-resolved categories are collectively referred to as the V-tagged categories.
If the V-boson decays hadronically and has sufficiently large pT, both of its hadronic decay
products are captured as a single reconstructed “fat” jet. Events in this V-boosted category are required to have a reconstructed CA8 jet with pT > 200 GeV and EmissT > 250 GeV.
Ad-ditional selection criteria are applied to improve the vector boson jet purity by cutting on the “N-subjettiness” ratio τ2/τ1as defined in Refs. [75, 76], which identifies jets with a two-subjet
topology, and on the pruned jet mass (mpruned) [77]. The τ2/τ1ratio is required to be smaller
than 0.5 and mpruned is required to be in the range 60–110 GeV. Events which contain
addi-tional AK5 jets close to the CA8 jet, but no closer than∆R=√(δη)2+ (δφ)2=0.5, are selected
to include the frequent cases in which ISR yields additional jets. If exactly one AK5 jet with pT > 30 GeV and|η| < 2.5 is reconstructed with∆R > 0.5 relative to the CA8 jet, and the
az-imuthal angle between it and the CA8 jet is smaller than 2 radians, the event is selected. Events with more than one AK5 jet with pT > 30 GeV and|η| < 2.5, reconstructed at∆R > 0.5
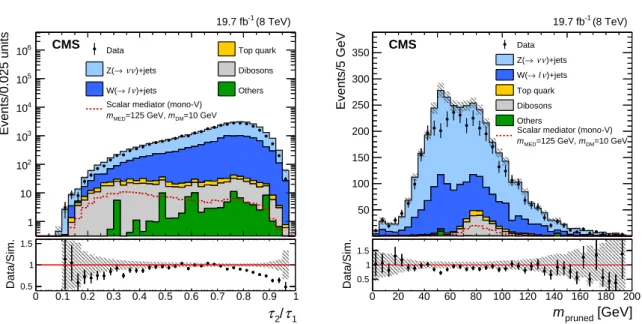
rela-tive to the CA8 jet, are rejected. Figure 3 shows the distributions in τ2/τ1 and mpruned before
the application of the jet mass selection, in simulation and data, for the V-boosted category. A discrepancy is present in the simulation relative to the data. This discrepancy has been studied and found to fall within the variations observed when using different parton shower models and detector descriptions in the simulation [78]. The disagreement is within the systematic uncertainties of the selection efficiency that are included in this analysis.
In cases where the V-boson has insufficient boost for its hadronic decay to be fully contained in a single reconstructed CA8 jet, a selection that targets V-boson decays into a pair of AK5 jets is applied to recover events failing the V-boosted selection. This selection requires that each jet has pT > 30 GeV and|η| < 2.5, and that the dijet system has a mass in the range 60–110 GeV,
consistent with originating from a W or Z boson. To reduce the combinatorial background in this V-resolved category, a multivariate (MVA) selection criterion is applied. The inputs to the MVA are the jet pull angle [79], the mass drop variable [80], and a likelihood-based discrimina-tor that distinguishes quark-originated from gluon-originated jets [81]. In events where multi-ple dijet pairs are found, the pair with the highest MVA output value is taken as the candidate.
6 4 Event selection and categorization 1 τ / 2 τ 0 0.2 0.4 0.6 0.8 1 Events/0.025 units 1 10 2 10 3 10 4 10 5 10 6
10 Data Top quark
)+jets ν ν → Z( Dibosons )+jets ν l → W( Others =10 GeV DM m =125 GeV, MED m
Scalar mediator (mono-V)
(8 TeV) -1 19.7 fb CMS 1 τ / 2 τ 0 0.1 0.2 0.3 0.4 0.5 0.6 0.7 0.8 0.9 1 Data/Sim. 0.5 1 1.5 [GeV] prune m 0 50 100 150 200 Events/5 GeV 50 100 150 200 250 300 350 Data )+jets ν ν → Z( )+jets ν l → W( Top quark Dibosons Others =10 GeV DM m =125 GeV, MED m
Scalar mediator (mono-V) (8 TeV) -1 19.7 fb CMS [GeV] pruned m 0 20 40 60 80 100 120 140 160 180 200 Data/Sim. 0.5 1 1.5
Figure 3: Left: The distribution of τ2/τ1 in highly Lorentz-boosted events, before the jet mass
selection. Right: The distribution of mpruned for the CA8 jets, before applying the jet mass
selection but after the requirement of τ2/τ1 < 0.5 has been applied. The discrepancy
be-tween data and simulation is within systematic uncertainties (not shown). The dashed red line
shows the expected distribution for scalar-mediated DM production with mMED=125 GeV and
mDM= 10 GeV. The shaded bands indicate the statistical uncertainty from the limited number
of simulated events.
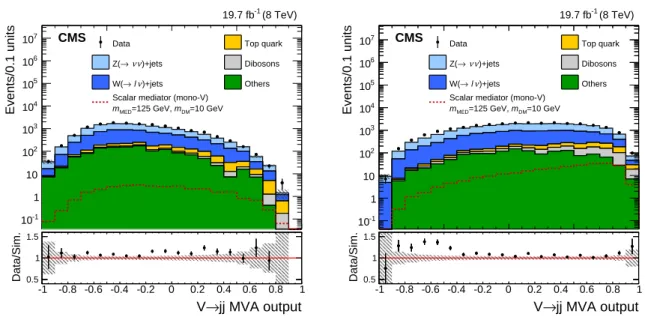
The distributions of the MVA output for SM backgrounds and for a scalar mediator produced in association with a V-boson are shown in Fig. 4. The disagreement observed between the data and simulation is included as a systematic uncertainty in the efficiency of the V-resolved category selection for the top quark and diboson backgrounds. Events are included in the V-resolved category if they have an MVA output greater than 0.6. This selection is optimal for mono-V signals with a spin-0 mediator with mMED <300 GeV [81].
To reduce contamination from top quark backgrounds, events are rejected if they contain a jet that is identified as a b jet, defined using the combined secondary vertex tagger operating at a medium efficiency working point [82]. Finally, the events are required to have EmissT >250 GeV. Events that do not qualify for either of the two V-tagged categories are required to have one or two high-pT jets that are consistent with originating from a single quark or gluon. This final
category is referred to as the monojet category. For the monojet category, events are required to have ETmiss > 200 GeV and contain at least one AK5 jet within |η| < 2 with pT > 150 GeV.
Events containing a second AK5 jet with pT > 30 GeV and |η| < 2.5 are selected, providing
the azimuthal angle between the leading jet with|η| < 2 and this second AK5 jet is less than
2 radians. This selection recovers the frequent cases where ISR yields two jets in the monojet signal. Events with three or more AK5 jets with pT >30 GeV and|η| <2.5 are rejected. Table 1
gives a summary of the event selection in the three categories. The priority for event selection is that events are first selected in the V-boosted category, followed by the V-resolved category, and finally in the monojet category. Events which pass a given selection are not included in any subsequent category.
Figure 5 shows the EmissT and leading jet pTdistributions in data and simulation after selection
for the three event classes combined. The backgrounds are normalized to the integrated lumi-nosity of the data samples, and the expected distribution for vector mediated DM production
jj MVA → V -1 -0.5 0 0.5 1 Events/0.1 units -1 10 1 10 2 10 3 10 4 10 5 10 6 10 7
10 Data Top quark
)+jets ν ν → Z( Dibosons )+jets ν l → W( Others =10 GeV DM m =125 GeV, MED m
Scalar mediator (mono-V)
(8 TeV) -1 19.7 fb CMS jj MVA output → V -1 -0.8 -0.6 -0.4 -0.2 0 0.2 0.4 0.6 0.8 1 Data/Sim. 0.5 1 1.5 jj MVA → V -1 -0.5 0 0.5 1 Events/0.1 units -1 10 1 10 2 10 3 10 4 10 5 10 6 10 7
10 Data Top quark
)+jets ν ν → Z( Dibosons )+jets ν l → W( Others =10 GeV DM m =125 GeV, MED m
Scalar mediator (mono-V)
(8 TeV) -1 19.7 fb CMS jj MVA output → V -1 -0.8 -0.6 -0.4 -0.2 0 0.2 0.4 0.6 0.8 1 Data/Sim. 0.5 1 1.5
Figure 4: The MVA output distributions for V-tagged events in simulation and data after signal selection for pT <160 GeV (left) and pT >160 GeV (right). Above a pTof about 160 GeV, the jets
from the V-boson decay begin to overlap. The dashed red line shows the expected distribution
for scalar-mediated DM production with mMED = 125 GeV and mDM = 10 GeV. The shaded
bands indicate the statistical uncertainty arising from the limited number of simulated events.
assuming mDM =10 GeV and mMED =1 TeV is overlaid. The discrepancy between the data and
simulation is a result of both detector resolution and an imperfect theoretical description of the kinematics of the V+jets processes. Both effects are corrected using control samples in data, as described in the following section.
5
Background estimation
The presence of DM production would be observable as an excess of events above SM back-grounds at high EmissT . The sensitivity obtained by considering the shape of the EmissT spectrum in these events is significantly better than that achieved in the simple counting analysis de-scribed in the previous CMS paper [9]. Additional improvement is achieved by using control regions in data to reduce the uncertainties in the predictions of the SM backgrounds. These re-gions are statistically independent from the signal region and designed such that the expected contribution from a potential signal is negligible. A binned likelihood fit is performed in the ranges 250–1000 GeV and 200–1000 GeV for the two V-tagged and monojet categories, respec-tively. The binning is chosen to ensure that each corresponding bin of a set of control regions is populated. The width of the highest EmissT bin is chosen to provide ease of comparison with the previous CMS search [9].
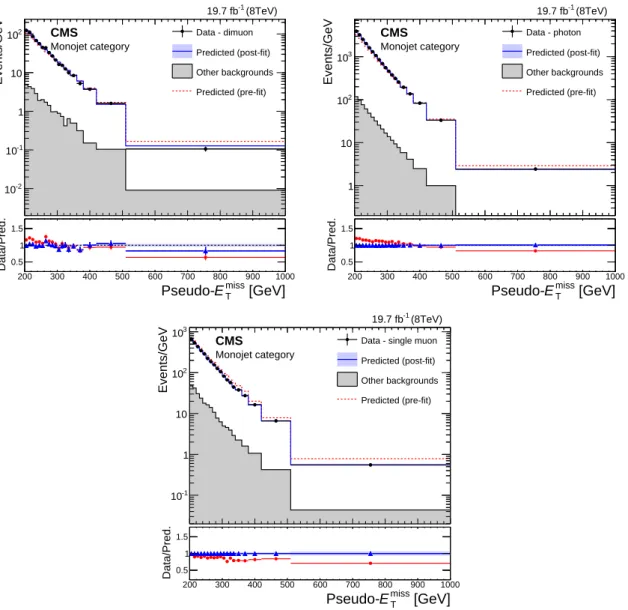
The background contributions from Z(νν) +jets and W(`ν) +jets are determined using data
from dimuon and photon, and single muon control regions, respectively. The events in the control regions are divided into the three categories, using the selection criteria described in Section 4, but replacing the lepton and photon vetoes with a requirement of the presence of one of the following: a pair of oppositely charged muons consistent with a Z boson decay, a high pTphoton, or a single muon consistent with a leptonic W boson decay. This yields a total
of nine control regions; three for each event category. In the control regions, the transverse
8 5 Background estimation
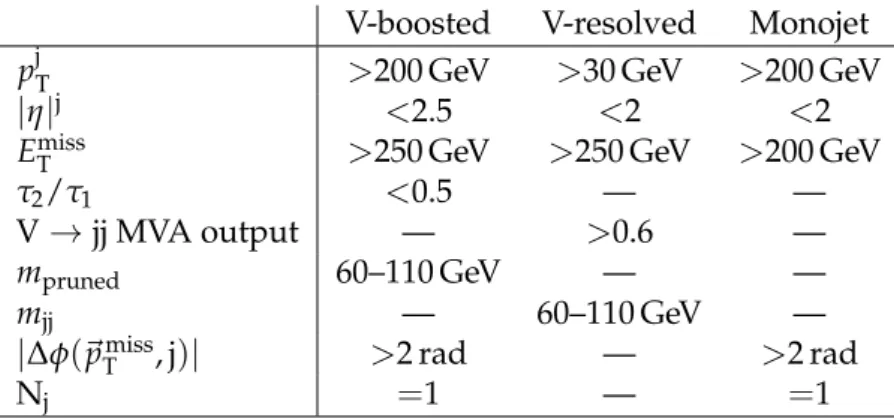
Table 1: Event selections for the V-boosted, V-resolved, and monojet categories The require-ments on pjT and|η|jrefer to the highest pT CA8 or AK5 jet in the V-boosted or monojet
cate-gories, and to both leading AK5 jets in the V-resolved category. The requirement on the number of jets (Nj) is applied in the V-boosted and monojet categories. An additional jet is allowed only
if it falls within|∆φ| < 2 radians of the leading AK5 or CA8 jet for the monojet or V-boosted category. The additional AK5 jets in the V-boosted category must be further than∆R>0.5 for the event to fail this criteria.
V-boosted V-resolved Monojet
pjT >200 GeV >30 GeV >200 GeV
|η|j <2.5 <2 <2
EmissT >250 GeV >250 GeV >200 GeV
τ2/τ1 <0.5 — —
V→jj MVA output — >0.6 —
mpruned 60–110 GeV — —
mjj — 60–110 GeV —
|∆φ(~pTmiss, j)| >2 rad — >2 rad
Nj =1 — =1
recalculated. This quantity is referred to as pseudo-Emiss
T and it is this variable to which the
Emiss
T selection of the corresponding signal region applies. The distribution of pseudo-ETmissin
the control regions is used to estimate the distribution of EmissT expected from the Z(νν) +jets
and W(`ν) +jets backgrounds in the signal region.
The dimuon control region is defined using the signal region selection criteria without the
muon veto. Exactly two isolated muons with opposite charge, pµ1
T , p
µ2
T > 20, 10 GeV and
an invariant mass in the range 60–120 GeV are required. As the decay branching fraction of B(Z→µ+µ−)is approximately six times smaller than that to neutrinos, the resulting statistical
uncertainty in the Z(νν) +jets background becomes a dominant systematic uncertainty at large
values of EmissT . A complementary approach is to use events in data that have a high-pTphoton
recoiling against jets to further constrain the Z(νν) +jets [83]. This is advantageous since the
production cross section of γ+jets is roughly a factor of three times that of the Z(νν) +jets,
yielding thereby a smaller statistical uncertainty in the predicted background. However, the theoretical uncertainties associated with the translation of the kinematics in γ+jets events to that of Z(νν) +jets events are significant. A combination of both photon and dimuon control
regions is used to maximally constrain the Z(νν) +jets background.
The photon control region consists of events that are selected by a trigger requiring an isolated photon with pT > 150 GeV [70]. The selected events are required to have at least one photon
with pT > 170 GeV and|η| < 2.5, identified using a medium efficiency selection criterion [70].
Photons in the ECAL transition region, 1.44 < |η| < 1.56 are excluded. All other kinematic
selections are the same as those used for the signal region. The purity of the selection has been measured and is used to estimate the contributions from other backgrounds in the photon control region [70].
To estimate the W(`ν) +jets background, a single muon control region is defined by selecting
events with exactly one muon with pT >20 GeV. Additionally, the transverse mass, calculated
as mT =
√
2ETmisspµT(1−cos φ), where φ is the azimuthal angle between~pTmissand the direction of the muon momentum, is required to be in the range 50–100 GeV.
The ETmiss spectra of the V+jets backgrounds are determined through the use of a binned likelihood fit to the data in all the bins of the three control regions. The expected number of
Events/GeV -2 10 -1 10 1 10 2 10 3 10 4 10 Data )+jets ν ν → Z( )+jets ν l → W( Top quark Dibosons QCD multijet )+jets ll → Z( =10 GeV DM m =1 TeV, MED m Vector mediator CMS (8 TeV) -1 19.7 fb 200 300 400 500 600 700 800 900 1000 Data/Sim.0.5 1 1.5 [GeV] miss T E Events/GeV -1 10 1 10 2 10 3 10 4 10 Data )+jets ν ν → Z( )+jets ν l → W( Top quark Dibosons QCD multijet )+jets ll → Z( =10 GeV DM m =1 TeV, MED m Vector mediator CMS (8 TeV) -1 19.7 fb 200 300 400 500 600 700 800 900 1000 Data/Sim.0.5 1 1.5 [GeV] T p Leading jet
Figure 5: Distributions in EmissT (left) and leading jet pT (right) in simulated events and data,
resulting from the combined signal selections for the three event categories. The dashed red
line shows the expected distribution, assuming vector mediated DM production with mMED =
1 TeV and mDM=10 GeV. The shaded bands indicate the statistical uncertainty from the limited
number of simulated events.
events Niin a given bin i of pseudo-ETmissis defined as N Zµµ
i = µZi →νν/RZand N
γ
i =µZi→νν/Rγ
for the dimuon and photon control regions, and NW
i = µWi →`ν/RWi for the single muon control
region. The µZ→νν
i and µWi →`ν terms are free parameters of the likelihood representing the
yields of Z(νν) +jets and W(`ν) +jets in each bin of the signal regions. The additional terms
RWi , RZi , and Rγi denote factors that account for the extrapolation of specific backgrounds from the signal region to control regions. The likelihood function for a particular event category is given by L(µZ→νν, µW→`ν, α, β) =
∏
i Poisson dγi| " Biγ(α) + µ Z→νν i Rγ i (β) #! ×∏
i Poisson dZi | " BZi (α) + µ Z→νν i RZ i (β) #! ×∏
i Poisson dWi | " BWi (α) + µ W→`ν i RW i (β) #! , (5)where dγi, dZi , and dWi are the observed number of events in each bin, i, of the photon, dimuon, and single muon control regions and Poisson(x|y) = yxe−y/x!. The terms α, β denote con-strained nuisance parameters, which model systematic uncertainties in the translation from the pseudo-ETmissdistributions in the control regions of a particular event category to the EmissT distribution in the corresponding signal region. The expected contributions from other back-ground processes in the photon, dimuon and single muon control regions are denoted Bγ
i, BiZ,
and BiWin Eq. ( 5), respectively.
The factors RZi account for the ratio of B(Z → νν)/B(Z → µ+µ−) and the muon efficiency
times acceptance in the dimuon control region, while Rγ
i account for the ratio of differential
cross sections between the Z+jets and γ+jets processes and the efficiency times acceptance of the photon selection for the γ+jets control region. The differential cross sections of photon
10 5 Background estimation
and Z production are corrected using NLO k-factors obtained from a comparison of their pT
distributions in events generated with MADGRAPH5 [email protected] [66], to the distributions produced at LO. These k-factors are propagated to the factors Rγ
i to account for NLO QCD
effects.
Systematic uncertainties are modelled as constrained nuisance parameters that allow variation of the factors Rγi, RZi and RWi in the fit. These include theoretical uncertainties in the photon to Z differential cross section ratio from renormalization and factorization scale uncertainties, which amount to 8% each across the relevant boson pT range. These uncertainties are
conser-vative in that they are estimated by taking the maximum difference in the ratio derived from varying each scale by a factor of two, independently for the two processes, thereby ignoring any cancellation of the scale uncertainties. Electroweak corrections are not accounted for in the simulation. Additional k-factors are applied as a function of the boson (Z or γ) pT, to account
for higher order electroweak effects, which are around 15% for a boson pT around 1 TeV [84].
The full correction is taken as an uncertainty in the ratio. A conservative choice is made in as-suming this uncertainty to be uncorrelated across bins of EmissT . The uncertainties in the muon selection efficiency, photon selection efficiency, and photon purity are included and fully cor-related across the control regions for the three event categories. The results of the fit to the data in the control regions for the V-boosted, V-resolved, and monojet categories are shown in Figs. 6, 7, and 8, respectively.
The remaining backgrounds are expected to be much smaller than those from V+jets and are
estimated directly from simulation. Shape and normalization systematic uncertainties from the hadronic recoil corrections applied to these backgrounds are included and account for uncer-tainties in the jet energy scale and resolution. Systematic unceruncer-tainties related to the V-tagging efficiency of both of the V-tagged categories are included for the top and diboson backgrounds, which allow for migration of events between the three categories. The systematic uncertainty is roughly 10% in the V-resolved category, which allows for the disagreement between data and MC observed in the MVA distribution (Fig. 4) and 10% in the V-boosted category, which allows for the uncertainty in the measurement of the selection efficiency using ttbar events in data [78]. A systematic uncertainty of 4% is included for the top quark backgrounds normal-ization because of the uncertainty in the b tagging efficiency for the b jet veto in the V-resolved category [85]. Systematic uncertainties of 7% and 10% are included in the normalizations of the top quark [86] and diboson [87, 88] backgrounds, respectively, to account for the uncer-tainty in their cross sections in the relevant kinematic phase-space. The top quark and diboson backgrounds have been studied separately using dedicated control regions in data to validate these systematic uncertainties. A systematic uncertainty of 50% is included in the expected contribution from QCD multijet events. This uncertainty was obtained by taking the largest differences observed between data and simulation in events selected by inverting the require-ment on ∆φ(~pTmiss, j). Finally, a systematic uncertainty of 2.6% in the integrated luminosity measurement [89] is included in the normalization all of the backgrounds obtained from simu-lation.
The expected yields in each bin of Emiss
T from all SM backgrounds, after the fit to the data in
the control regions, are given in Tables 2, 3, and 4 for the V-boosted, V-resolved, and monojet signal region, respectively. The uncertainties represent the sum in quadrature of the effects of all the relevant sources of systematic uncertainty in each bin of EmissT . The correlations between the EmissT bins, resulting from the fit to the control regions, for each of the three event categories are shown in Figs. 12, 13, and 14 of the supplementary material in Appendix A.
fake MET (GeV) 300 400 500 600 700 800 900 1000 Events/GeV -2 10 -1 10 1 Data - dimuon Predicted (post-fit) Other backgrounds Predicted (pre-fit) Preliminary CMS V-boosted category (8TeV) -1 19.7 fb CMS 300 400 500 600 700 800 900 1000 Data/Pred. 0.5 1 1.5 [GeV] miss T E
Pseudo-fake MET (GeV)
300 400 500 600 700 800 900 1000 Events/GeV -1 10 1 10 Data - photon Predicted (post-fit) Other backgrounds Predicted (pre-fit) Preliminary CMS V-boosted category (8TeV) -1 19.7 fb CMS 300 400 500 600 700 800 900 1000 Data/Pred. 0.5 1 1.5 [GeV] miss T E
Pseudo-fake MET (GeV)
300 400 500 600 700 800 900 1000
Events/GeV
-1
10 1
10 Data - single muon
Predicted (post-fit) Other backgrounds Predicted (pre-fit) Preliminary CMS V-boosted category (8TeV) -1 19.7 fb CMS 300 400 500 600 700 800 900 1000 Data/Pred. 0.5 1 1.5 [GeV] miss T E
Pseudo-Figure 6: Predicted and observed pseudo-EmissT distributions in the dimuon (top–left), photon (top–right), and single muon (bottom) control regions, before and after performing the simul-taneous likelihood fit to the data in the control regions, for the V-boosted category. The predic-tions for the distribupredic-tions before fitting to the control region data (pre-fit), and after (post-fit) are shown as the dashed red and solid blue lines, respectively. The red circles in the lower pan-els show the ratio of the observed data to the pre-fit predictions, while the blue triangles show the ratio to the post-fit predictions. The horizontal bars on the data points indicate the width of the bin that is centred at that point. The filled bands around the post-fit prediction indicate the combined statistical and systematic uncertainties from the fit.
Table 2: Expected yields of the SM processes and their uncertainties per bin for the V-boosted category after the fit to the control regions.
Emiss
T (GeV) Obs. Z(→νν)+jets W(→ `ν)+jets Top quark Dibosons Other Total Bkg.
250–300 1073 683±40 279±33 35.4±3.7 103±15 2.5±0.1 1103±63 300–350 453 271±23 114±20 12.7±1.3 46.5±6.9 0.7±0.1 446±34 350–400 160 118±13 38.3±8.7 5.6±1.0 22.2±3.3 0.2±0.1 184±18 400–450 81 49.7±7.3 9.8±3.4 1.5±0.8 11.0±1.8 <0.1 72±29 450–500 30 31.2±6.1 5.0±2.6 0.5±0.1 7.4±1.1 <0.1 44.3±6.6 500–1000 39 39.8±7.8 6.4±3.4 0.2±0.0 7.8±1.1 <0.1 54.3±8.5
12 5 Background estimation
fake MET (GeV)
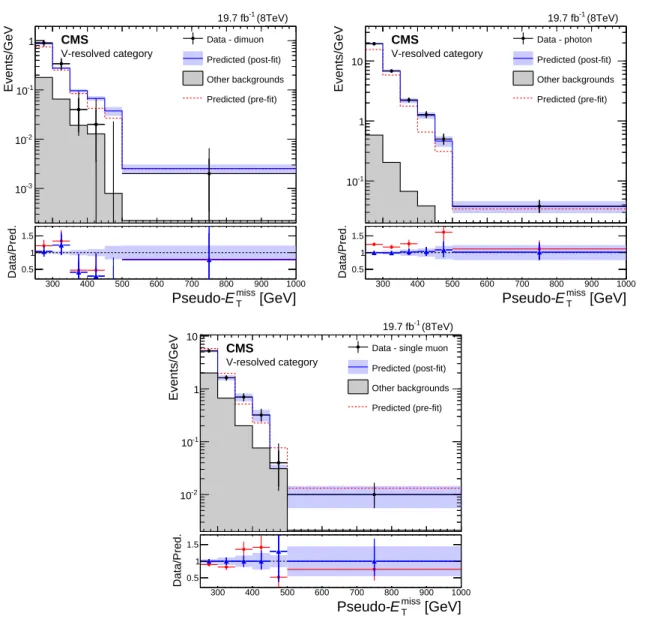
300 400 500 600 700 800 900 1000 Events/GeV -3 10 -2 10 -1 10 1 Data - dimuon Predicted (post-fit) Other backgrounds Predicted (pre-fit) Preliminary CMS V-resolved category (8TeV) -1 19.7 fb CMS 300 400 500 600 700 800 900 1000 Data/Pred. 0.5 1 1.5 [GeV] miss T E
Pseudo-fake MET (GeV)
300 400 500 600 700 800 900 1000 Events/GeV -1 10 1 10 Data - photon Predicted (post-fit) Other backgrounds Predicted (pre-fit) Preliminary CMS V-resolved category (8TeV) -1 19.7 fb CMS 300 400 500 600 700 800 900 1000 Data/Pred. 0.5 1 1.5 [GeV] miss T E
Pseudo-fake MET (GeV)
300 400 500 600 700 800 900 1000 Events/GeV -2 10 -1 10 1 10
Data - single muon Predicted (post-fit) Other backgrounds Predicted (pre-fit) Preliminary CMS V-resolved category (8TeV) -1 19.7 fb CMS 300 400 500 600 700 800 900 1000 Data/Pred. 0.5 1 1.5 [GeV] miss T E
Pseudo-Figure 7: Predicted and observed pseudo-EmissT distributions in the dimuon (top–left), photon (top–right), and single muon (bottom) control regions, before and after performing the simul-taneous likelihood fit to the data in the control regions, for the V-resolved category. The predic-tions for the distribupredic-tions before fitting to the control region data (pre-fit), and after (post-fit) are shown as the dashed red and solid blue lines, respectively. The red circles in the lower pan-els show the ratio of the observed data to the pre-fit predictions, while the blue triangles show the ratio to the post-fit predictions. The horizontal bars on the data points indicate the width of the bin that is centred at that point. The filled bands around the post-fit prediction indicate the combined statistical and systematic uncertainties from the fit.
Table 3: Expected yields of the SM processes and their uncertainties per bin for the V-resolved category after the fit to the control regions.
EmissT (GeV) Obs. Z(→ νν)+jets W(→ `ν)+jets Top quark Dibosons Other Total Bkg.
250–300 617 298±36 166±26 55.4±4.7 27.9±1.6 36±17 587±48 300–350 211 98±14 41±10 15.2±1.5 9.6±0.3 19.2±6.6 170±18 350–400 79 31.1±7.0 21.5±8.9 5.5±0.7 3.2±0.3 8.2±2.3 62±12 400–450 20 20.1±6.4 14.5±8.5 1.5±0.2 0.6±0.3 3.0±0.7 38±11 450–500 16 6.1±2.7 1.0±2.6 1.0±0.4 0.4±0.1 1.0±0.2 8.5±3.6 500–1000 17 6.9±3.0 2.6±1.7 0.3±0.2 0.5±0.0 0.3±0.1 11.6±3.5
fake MET (GeV) 200 300 400 500 600 700 800 900 1000 Events/GeV -2 10 -1 10 1 10 2 10 Data - dimuon Predicted (post-fit) Other backgrounds Predicted (pre-fit) Preliminary CMS Monojet category (8TeV) -1 19.7 fb CMS 200 300 400 500 600 700 800 900 1000 Data/Pred. 0.5 1 1.5 [GeV] miss T E
Pseudo-fake MET (GeV)
200 300 400 500 600 700 800 900 1000 Events/GeV 1 10 2 10 3 10 Data - photon Predicted (post-fit) Other backgrounds Predicted (pre-fit) Preliminary CMS Monojet category (8TeV) -1 19.7 fb CMS 200 300 400 500 600 700 800 900 1000 Data/Pred. 0.5 1 1.5 [GeV] miss T E
Pseudo-fake MET (GeV)
200 300 400 500 600 700 800 900 1000 Events/GeV -1 10 1 10 2 10 3 10
Data - single muon Predicted (post-fit) Other backgrounds Predicted (pre-fit) Preliminary CMS Monojet category (8TeV) -1 19.7 fb CMS 200 300 400 500 600 700 800 900 1000 Data/Pred. 0.5 1 1.5 [GeV] miss T E
Pseudo-Figure 8: Predicted and observed pseudo-Emiss
T distributions in the dimuon (top–left), photon
(top–right), and single muon (bottom) control regions, before and after performing the simulta-neous likelihood fit to the data in the control regions, for the monojet category. The predictions for the distributions before fitting to the control region data (pre-fit), and after (post-fit) are shown as the dashed red and solid blue lines, respectively. The red circles in the lower panels show the ratio of the observed data to the pre-fit predictions, while the blue triangles show the ratio to the post-fit predictions. The horizontal bars on the data points indicate the width of the bin that is centred at that point. The filled bands around the post-fit prediction indicate the combined statistical and systematic uncertainties from the fit.
14 6 Results
Table 4: Expected yields of the SM processes and their uncertainties per bin for the monojet category after the fit to the control regions.
ETmiss(GeV) Obs. Z(→νν)+jets W(→ `ν)+jets Top quark Dibosons Other Total Bkg. 200–210 17547 10740±270 6770±320 132±11 135±14 93.4±16.9 17870±600 210–220 14303 9230±230 4990±240 104±13 112±11 63.7±6.7 14500±610 220–230 11343 7320±190 3830±170 82.1±7.3 95.1±9.6 39.4±2.4 11370±400 230–240 8961 5730±170 3020±160 62.0±5.8 77.9±8.6 29.0±1.0 8920±400 240–250 6920 4680±150 2470±140 46.6±4.4 61.0±6.1 19.6±0.5 7280±330 250–260 5582 3700±140 1860±120 34.2±3.7 50.1±4.9 14.6±0.4 5660±370 260–270 4517 3290±130 1580±110 27.7±2.3 39.7±4.2 10.3±0.2 4940±320 270–280 3693 2570±110 1101±71 25.0±3.1 33.5±3.4 6.3±0.2 3730±160 280–290 2907 2085±89 934±71 17.8±1.9 28.1±3.0 5.5±0.1 3070±180 290–300 2406 1721±85 754±58 15.0±3.6 21.9±2.7 4.2±0.1 2520±170 300–310 1902 1337±79 577±51 8.9±1.6 17.7±2.1 3.1±0.1 1940±160 310–320 1523 1182±58 435±43 5.9±2.2 15.5±1.8 2.3±0.1 1640±110 320–330 1316 931±53 371±44 5.2±1.3 11.0±1.8 2.1±0.1 1320±92 330–340 1065 804±51 246±29 4.9±1.1 11.9±1.8 1.8±0.1 1070±120 340–360 1571 1225±61 399±39 6.8±1.2 16.4±1.6 2.0±0.1 1650±110 360–380 1091 822±53 269±30 3.4±0.4 13.3±1.4 1.3±0.1 1110±150 380–420 1404 1036±66 324±30 5.5±0.6 17.1±1.7 1.4±0.1 1390±110 420–510 1126 943±70 267±27 3.9±0.8 15.7±1.6 1.3±0.1 1240±140 510–1000 476 330±32 72±12 0.6±0.2 8.2±0.8 0.3±0.1 412±71
6
Results
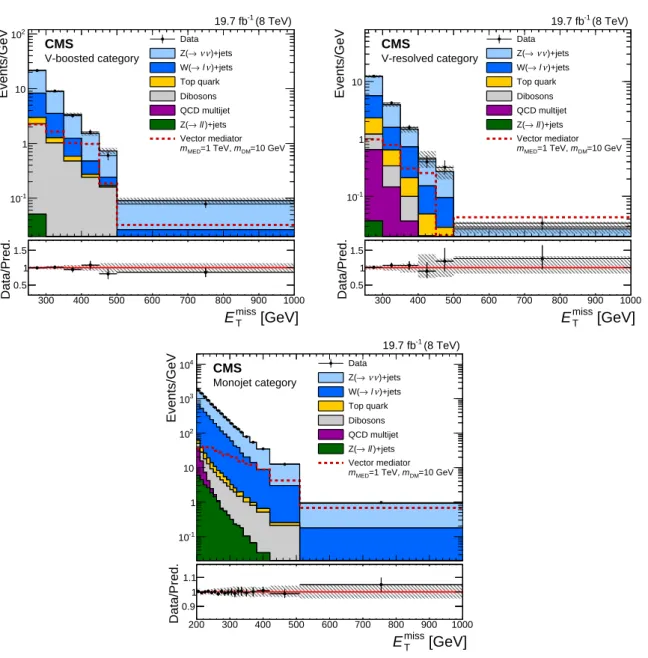
A simultaneous fit to the data in the three event category signal regions is performed. The background shapes in this second fit are allowed to vary within their uncertainties, which are propagated from the fit to the control region data, described in the previous section, accounting for correlations between the control region fit parameters. The corresponding comparisons be-tween the data and the expected backgrounds in the EmissT distributions after this fit are shown in Fig. 9 for each of the three event categories. Agreement between the data and the expected backgrounds is observed at the percent level across the three categories. A local significance of the data in each bin is calculated by comparing the likelihood between the background-only fit (Fig. 9) and a fit in which the total expected yield of events in that bin is fixed to the observation in data. The largest local significance observed using this procedure is 1.9 standard deviations and corresponds to the largest EmissT bin of the monojet category.
The results are interpreted using the set of simplified models for DM production described in Section 3. Exclusion limits are set for these models using the asymptotic CLsmethod [90–92]
with a profile likelihood ratio as the test statistic, in which systematic uncertainties in the sig-nal and background models are modelled as constrained nuisance parameters. For each sigsig-nal hypothesis tested, upper limits are placed on the ratio of the signal yield to that predicted by the simplified model, denoted as µ. Limits are presented in terms of excluded regions in the mMED−mDMplane, assuming scalar, pseudoscalar, vector, and axial-vector mediators,
deter-mined as the points for which µ>1 is excluded at the 90% confidence level (CL) or above. The choice of 90% CL exclusions is made to allow comparison with other experiments. Limits are calculated for a set of points in the plane and then interpolated to derive exclusion contours. In the region mMED < 200 GeV, mDM <200 GeV, the limit is calculated in 10 GeV steps in both
DM and mediator masses. For the region 200< mMED <500 GeV, mDM < 500 GeV, a spacing
of 25 GeV is used. For mediator masses larger than 500 GeV the generated signal points are sep-arated by 100 GeV. The expected number of signal events in each of the three event categories arising from monojet and mono-V production for a vector and axial vector mediator with a
Events/GeV -1 10 1 10 2 10 Data )+jets ν ν → Z( )+jets ν l → W( Top quark Dibosons QCD multijet )+jets ll → Z( =10 GeV DM m =1 TeV, MED m Vector mediator CMS V-boosted category (8 TeV) -1 19.7 fb 300 400 500 600 700 800 900 1000 Data/Pred.0.5 1 1.5 [GeV] miss T E Events/GeV -1 10 1 10 Data )+jets ν ν → Z( )+jets ν l → W( Top quark Dibosons QCD multijet )+jets ll → Z( =10 GeV DM m =1 TeV, MED m Vector mediator CMS V-resolved category (8 TeV) -1 19.7 fb 300 400 500 600 700 800 900 1000 Data/Pred.0.5 1 1.5 [GeV] miss T E Events/GeV -1 10 1 10 2 10 3 10 4 10 Data )+jets ν ν → Z( )+jets ν l → W( Top quark Dibosons QCD multijet )+jets ll → Z( =10 GeV DM m =1 TeV, MED m Vector mediator CMS Monojet category (8 TeV) -1 19.7 fb 200 300 400 500 600 700 800 900 1000 Data/Pred. 0.9 1 1.1 [GeV] miss T E
Figure 9: Post-fit distributions in EmissT expected from SM backgrounds and observed in the signal region. The expected distributions are evaluated after fitting to the observed data simul-taneously across the V-boosted (top–left), V-resolved (top–right), and monojet (bottom) cate-gories. The ratio of the data to the post-fit background prediction is shown in the lower panels. The shaded bands indicate the post-fit uncertainty in the background, assuming no signal. The horizontal bars on the data points indicate the width of the bin that is centred at that point. The expected distribution for a signal assuming vector mediated DM production is shown for
16 6 Results
mass of 1 TeV, a scalar mediator with a mass of 125 GeV, and a pseudoscalar mediator with a mass of 400 GeV is shown in Table 5. The yields are derived assuming a DM mass of 1 GeV and coupling values gDM= gSM =gq=1. The sum of these contributions in each category is used
when setting limits, except in the fermionic case, for which the contribution from the mono-V signal is ignored.
Table 5: Expected signal event yields in each of the three event categories for monojet and mono-V production assuming a vector, axial vector, pseudoscalar, or scalar mediator. The yields are determined assuming mDM=1 GeV and gDM= gSM= gq=1.
V-boosted V-resolved Monojet
Mediator type monojet mono-V monojet mono-V monojet mono-V
Vector, mMED=1 TeV 217 84.0 82.0 26.1 5250 94.8
Axial vector, mMED=1 TeV 268 85.7 85.5 24.5 6030 93.7
Pseudoscalar, mMED=400 GeV 56.8 1300 20.8 100 2420 1500
Scalar, mMED=125 GeV 20.6 126 8.44 13.3 1060 196
Experimental systematic uncertainties, including jet and Emiss
T response and resolution
uncer-tainties, are included in the signal model as nuisance parameters, while the theoretical sys-tematic uncertainties in the inclusive cross section are instead added as additional contours on the exclusion limits. These include the effect of varying the renormalization and factorization scales by a factor of two, and the PDF uncertainties, which result in 20% and 30% variations in the signal yield, when summed in quadrature, for the vector and axial vector, and scalar and pseudoscalar models, respectively. These are the largest values found across the full range of the mediator mass from 10 GeV to 3 TeV, although the variation of these uncertainties in this range is found to be small. The same values are assumed for every signal point, thus giving a conservative estimate of the uncertainty.
Figure 10 shows the 90% CL exclusions for the vector, axial vector, scalar, and pseudoscalar me-diator models. The 90% upper limit on µ (µup), when assuming that the mediator couples only
to fermions (fermionic), is shown by the blue color scale. As described in Section 3, the limits are calculated assuming a minimum width for the signal [21, 22, 25, 93]. For the pseudoscalar interpretation, there is a region of masses between 150 and 280 GeV for which the decrease in cross section with larger mediator mass is balanced by an increase in acceptance for the signal, so that the expected signal contribution remains roughly constant. The expected value of µup
is larger than 1 in this region, resulting in an “island” at small mDM, where no exclusion is
expected at the 90% CL. However, the observed value of µupis smaller than 1 throughout this
region at 90% CL, thus the island is not present in the observed limits.
The results are compared, for all four types of mediators, to constraints obtained from the observed cosmological relic density of DM as determined from measurements of the cosmic microwave background by the WMAP and Planck experiments [5, 94, 95]. The expected DM abundance is estimated, separately for each model, using a thermal freeze-out mechanism
im-plemented in MADDM2.0.6 [96], and compared with the observed cold DM density Ωch2 =
0.12 [97], as described in Ref. [98]. It is assumed that the hypothesized simplified model pro-vides the only relevant dynamics for DM interaction beyond the SM.
Figures 11(top–left), 11(top–right), and 11(bottom–left) show the same exclusion contours, this time translated into the planes of mDM−σSI or mDM−σSD, where σSIand σSDare the SI or SD
DM-nucleon scattering cross sections. These representations allow a more direct comparison with limits from the DD experiments. The translations are obtained following the procedures outlined in Ref. [99] for the vector and axial vector mediators and in Refs. [100, 101] for the scalar mediator. It should be noted that the limits set from this analysis are only valid for
[GeV] MED m 500 1000 1500 2000 [GeV] DM m 200 400 600 800 1000 (fermionic) up µ Observed -3 10 -2 10 -1 10 1 =1) up µ Median expected ( +/- Scale+PDF uncertainty Observed 0.12 ≥ 2 h c Ω CMS (8 TeV) -1 19.7 fb = 1 SM g = DM g Vector, Dirac DM [GeV] MED m 500 1000 1500 2000 [GeV] DM m 200 400 600 800 1000 (fermionic) up µ Observed -3 10 -2 10 -1 10 1 -3 10 -2 10 -1 10 1 =1) up µ Median expected ( +/- Scale+PDF uncertainty Observed 0.12 ≥ 2 h c Ω CMS (8 TeV) -1 19.7 fb = 1 SM g = DM g
Axial vector, Dirac DM
[GeV] MED m 40 60 80 100 120 140 160 180 200 [GeV] DM m 100 200 (fermionic) up µ Observed 0 0.2 0.4 0.6 0.8 1 1.2 1.4 1.6 0 0.2 0.4 0.6 0.8 1 1.2 1.4 1.6 =1) up µ Median expected ( Observed +/- Scale+PDF uncertainty Median expected (fermionic) Observed (fermionic) 0.12 ≥ 2 h c Ω CMS (8 TeV) -1 19.7 fb = 1 q g = DM g Scalar, Dirac DM [GeV] MED m 100 200 300 400 500 600 700 800 900 1000 [GeV] DM m 200 400 (fermionic) up µ Observed 0.2 0.4 0.6 0.8 1 1.2 0.2 0.4 0.6 0.8 1 1.2 =1) up µ Median expected ( Observed +/- Scale+PDF uncertainty Median expected (fermionic) Observed (fermionic) 0.12 ≥ 2 h c Ω CMS (8 TeV) -1 19.7 fb = 1 q g = DM g Pseudoscalar, Dirac DM
Figure 10: The 90% CL exclusion contours in the mMED−mDM plane assuming vector (top–
left), axial vector (top–right), scalar (bottom–left), and pseudoscalar (bottom–right) mediators. The scale shown on the right hand axis shows the expected 90% CL exclusion upper limit on the signal strength, assuming the mediator only couples to fermions. For the scalar and pseu-doscalar mediators, the exclusion contour assuming coupling only to fermions (fermionic) is also shown. The white region shows model points that are not tested when assuming coupling only to fermions and are not expected to be excluded by this analysis under this assumption. The red dot-dashed lines indicate the variation in the exclusion contours due to modifying the renormalization and factorization scales by a factor of two in the generation of the signal. In all cases, the excluded region is to the bottom–left of the contours, except for the relic density, which shows the regions for which Ωch2 ≥ 0.12, as indicated by the shading. In all of the
models, the mediator width is determined using the minimum width assumption.
the simplified model, and in particular that they assume gDM = gSM = gq = 1. For the
scalar mediator model, it is assumed that only heavy quarks (top and bottom) contribute. Such a choice limits the sensitivity for DD experiments, however, it allows the direct comparison between collider and DD experiments without an additional assumption for the light-quark couplings [100]. For the vector and scalar models, the limits are compared with those from the LUX [102], CDMS lite [103], CRESST II [104], and PandaX II [105] experiments. The limits from the LUX experiment currently provides the strongest constraints on σSIfor mDM&4 GeV, while
for values of mDM<2 GeV the analysis in this paper provides more stringent constraints on the
vector and scalar models as shown in Figs. 11(top–left) and Fig. 11(bottom–left), respectively. For axial vector couplings, the limits are compared with DM–proton scattering limits from the PICO-2L [106], PICO-60 [107], IceCube [108], and Super-Kamiokande [109] experiments. In this model, the limits obtained in this analysis are superior for DM masses up to 300 GeV.
18 7 Summary
Pseudoscalar-mediated DM-nucleon interactions are suppressed at large velocities. The most appropriate comparison is therefore to the most sensitive bounds on indirect detection from the Fermi LAT collaboration [110, 111]. These limits apply to a scenario in which DM annihilates in the centre of a galaxy, producing a γ ray signature. The signature can be interpreted as DM annihilation to b quark pairs, allowing direct comparison with limits from this analysis [34, 112, 113].
Figure 11(bottom–right) shows the exclusion contours assuming pseudoscalar mediation in the plane of DM pair annihilation cross section versus mDM. It is assumed that only heavy
quarks contribute in the production of the mediator, while for the interpretation of the Fermi LAT limits in the annihilation cross section, it is assumed that the mediator decays only to b quark pairs. As with all of the simplified model interpretations, the DM particle is assumed to be a Dirac fermion. The results shown from Fermi LAT have been scaled by a factor of two compared to Ref. [110], because of the assumption of a Majorana DM fermion made by that analysis. The limits from this analysis improve on those from Fermi LAT for DM masses up to 150 GeV.
An excess in γ ray emission, consistent with the annihilation of DM, at the galactic centre has been reported in several studies using data from Fermi LAT [114–117]. Further studies of this excess suggest that DM annihilation could be mediated by a light pseudoscalar particle [118, 119]. The 68% CL preferred regions in this plane assuming the annihilation of DM pairs to light-quarks (qq), τ+τ−, or bb, using data from Fermi LAT, are shown as solid colour regions
in Fig. 11(bottom–right). For the simplified model, and assuming that gDM = gq = 1, all of
these regions are excluded by this analysis.
7
Summary
A search has been presented for an excess of events with at least one energetic jet in association with large ETmissin a data sample of proton-proton collisions at a centre-of-mass energy of 8 TeV. The data correspond to an integrated luminosity of 19.7 fb−1collected with the CMS detector at the LHC. Sensitivity to a potential mono-V signature is achieved by the addition of two event categories that select hadronically decaying V-bosons using novel jet substructure techniques. This search is the first at CMS to use jet substructure techniques to identify hadronically decay-ing vector bosons in both Lorentz-boosted and resolved scenarios. The sensitivity of the search has been increased compared to the previous CMS result by using the full shape of the EmissT distribution to discriminate signal from standard model backgrounds and by using additional data control regions. No significant deviation is observed in the EmissT distributions relative to the expectation from standard model backgrounds. The results of the search are interpreted under a set of simplified models that describe the production of dark matter (DM) particle pairs via vector, axial vector, scalar, or pseudoscalar mediation. Constraints are placed on the parameter space of these models. The search was the first at CMS to be interpreted using the simplified models for DM production. The search excludes DM production via vector or axial vector mediation with mediator masses up to 1.5 TeV, within the simplified model assump-tions. When compared to direct detection experiments, the limits from this analysis provide the strongest constraints at small DM masses in the vector model and for DM masses up to 300 GeV in the axial vector model. For scalar and pseudoscalar mediated DM production, this analysis excludes mediator masses up to 80 and 400 GeV, respectively. The results of this anal-ysis provide the strongest constraints on DM pair annihilation cross section via a pseudoscalar interaction for DM masses up to 150 GeV compared to the latest indirect detection results from Fermi LAT.
[GeV] DM m 1 10 102 ] 2 [cm SI σ -46 10 -45 10 -44 10 -43 10 -42 10 -41 10 -40 10 -39 10 -38 10 -37 10 -36 10 -35 10 Median expected Observed Monojet V-boosted V-resolved V-tagged CDMSlite CRESST II LUX PandaX II CMS (8 TeV) -1 19.7 fb = 1 SM g = DM g Vector, Dirac DM [GeV] DM m 1 10 102 ] 2 [cm SD σ -43 10 -42 10 -41 10 -40 10 -39 10 -38 10 -37 10
Median expected PICO-60 Observed PICO-2L Monojet IceCube τ+τ -V-boosted Super-K τ+τ -V-resolved V-tagged CMS (8 TeV) -1 19.7 fb = 1 SM g = DM g
Axial vector, Dirac DM
[GeV] DM m 1 10 102 ] 2 [cm SI σ -46 10 -45 10 -44 10 -43 10 -42 10 -41 10 Median expected Observed Monojet V-tagged Fermionic CDMSlite LUX PandaX II CMS (8 TeV) -1 19.7 fb = 1 q g = DM g Scalar, Dirac DM [GeV] DM m 10 102 /s] 3
Annihilation cross section [cm
-30 10 -29 10 -28 10 -27 10 -26 10 -25 10 Median expected Observed Monojet V-tagged Fermionic Fermi LAT exclusion
)
-τ + τ
Fermi LAT best fit ( ) q Fermi LAT best fit (q
) b Fermi LAT best fit (b
CMS (8 TeV) -1 19.7 fb = 1 q g = DM g Pseudoscalar, Dirac DM
Figure 11: The 90% CL exclusion contours in the mDM−σSI or mDM−σSD plane assuming
vector (top–left), axial vector (top–right), scalar (bottom–left) mediators. Also shown is the
90% CL exclusion in DM annihilation cross section as a function of mDM for a pseudoscalar
mediator (bottom–right). For the scalar and pseudoscalar mediators, the exclusion contours assuming the mediator only couples to fermions (fermionic) is also shown. The excluded re-gion in all plots is to the top–left of the contours for the results from this analysis while the DD experiments and Fermi LAT excluded regions are above the lines shown. In the vector and axial vector models, limits are shown independently for monojet, V-boosted, and V-resolved categories. The red dot-dashed line shows the partial combination of the V-tagged categories for which the V-boosted category provides the dominant contribution. In all of the mediator models, a minimum mediator width is assumed. For the pseudoscalar mediator, 68% CL pre-ferred regions, obtained using data from Fermi LAT, for DM annihilation to light-quarks (qq),
τ+τ−, and bb are given by the solid green, hatched pink, and shaded brown coloured regions,
20 7 Summary
Acknowledgments
We congratulate our colleagues in the CERN accelerator departments for the excellent perfor-mance of the LHC and thank the technical and administrative staffs at CERN and at other CMS institutes for their contributions to the success of the CMS effort. In addition, we grate-fully acknowledge the computing centres and personnel of the Worldwide LHC Computing Grid for delivering so effectively the computing infrastructure essential to our analyses. Fi-nally, we acknowledge the enduring support for the construction and operation of the LHC and the CMS detector provided by the following funding agencies: the Austrian Federal Min-istry of Science, Research and Economy and the Austrian Science Fund; the Belgian Fonds de la Recherche Scientifique, and Fonds voor Wetenschappelijk Onderzoek; the Brazilian Fund-ing Agencies (CNPq, CAPES, FAPERJ, and FAPESP); the Bulgarian Ministry of Education and Science; CERN; the Chinese Academy of Sciences, Ministry of Science and Technology, and Na-tional Natural Science Foundation of China; the Colombian Funding Agency (COLCIENCIAS); the Croatian Ministry of Science, Education and Sport, and the Croatian Science Foundation; the Research Promotion Foundation, Cyprus; the Secretariat for Higher Education, Science, Technology and Innovation, Ecuador; the Ministry of Education and Research, Estonian Re-search Council via IUT23-4 and IUT23-6 and European Regional Development Fund, Estonia; the Academy of Finland, Finnish Ministry of Education and Culture, and Helsinki Institute of Physics; the Institut National de Physique Nucl´eaire et de Physique des Particules / CNRS, and Commissariat `a l’ ´Energie Atomique et aux ´Energies Alternatives / CEA, France; the Bundes-ministerium f ¨ur Bildung und Forschung, Deutsche Forschungsgemeinschaft, and Helmholtz-Gemeinschaft Deutscher Forschungszentren, Germany; the General Secretariat for Research and Technology, Greece; the National Scientific Research Foundation, and National Innova-tion Office, Hungary; the Department of Atomic Energy and the Department of Science and Technology, India; the Institute for Studies in Theoretical Physics and Mathematics, Iran; the Science Foundation, Ireland; the Istituto Nazionale di Fisica Nucleare, Italy; the Ministry of Science, ICT and Future Planning, and National Research Foundation (NRF), Republic of Ko-rea; the Lithuanian Academy of Sciences; the Ministry of Education, and University of Malaya (Malaysia); the Mexican Funding Agencies (BUAP, CINVESTAV, CONACYT, LNS, SEP, and UASLP-FAI); the Ministry of Business, Innovation and Employment, New Zealand; the Pak-istan Atomic Energy Commission; the Ministry of Science and Higher Education and the Na-tional Science Centre, Poland; the Fundac¸˜ao para a Ciˆencia e a Tecnologia, Portugal; JINR, Dubna; the Ministry of Education and Science of the Russian Federation, the Federal Agency of Atomic Energy of the Russian Federation, Russian Academy of Sciences, and the Russian Foundation for Basic Research; the Ministry of Education, Science and Technological Devel-opment of Serbia; the Secretar´ıa de Estado de Investigaci ´on, Desarrollo e Innovaci ´on and Pro-grama Consolider-Ingenio 2010, Spain; the Swiss Funding Agencies (ETH Board, ETH Zurich, PSI, SNF, UniZH, Canton Zurich, and SER); the Ministry of Science and Technology, Taipei; the Thailand Center of Excellence in Physics, the Institute for the Promotion of Teaching Science and Technology of Thailand, Special Task Force for Activating Research and the National Sci-ence and Technology Development Agency of Thailand; the Scientific and Technical Research Council of Turkey, and Turkish Atomic Energy Authority; the National Academy of Sciences of Ukraine, and State Fund for Fundamental Researches, Ukraine; the Science and Technology Facilities Council, UK; the US Department of Energy, and the US National Science Foundation. Individuals have received support from the Marie-Curie programme and the European Re-search Council and EPLANET (European Union); the Leventis Foundation; the A. P. Sloan Foundation; the Alexander von Humboldt Foundation; the Belgian Federal Science Policy Of-fice; the Fonds pour la Formation `a la Recherche dans l’Industrie et dans l’Agriculture
(FRIA-Belgium); the Agentschap voor Innovatie door Wetenschap en Technologie (IWT-(FRIA-Belgium); the Ministry of Education, Youth and Sports (MEYS) of the Czech Republic; the Council of Sci-ence and Industrial Research, India; the HOMING PLUS programme of the Foundation for Polish Science, cofinanced from European Union, Regional Development Fund, the Mobil-ity Plus programme of the Ministry of Science and Higher Education, the National Science Center (Poland), contracts Harmonia 2014/14/M/ST2/00428, Opus 2013/11/B/ST2/04202, 2014/13/B/ST2/02543 and 2014/15/B/ST2/03998, Sonata-bis 2012/07/E/ST2/01406; the Thalis and Aristeia programmes cofinanced by EU-ESF and the Greek NSRF; the National Priorities Research Program by Qatar National Research Fund; the Programa Clar´ın-COFUND del Princi-pado de Asturias; the Rachadapisek Sompot Fund for Postdoctoral Fellowship, Chulalongkorn University and the Chulalongkorn Academic into Its 2nd Century Project Advancement Project (Thailand); and the Welch Foundation, contract C-1845.
References
[1] H. C. van de Hulst, E. Raimond, and H. van Woerden, “Rotation and density
distribution of the Andromeda nebula derived from observations of the 21-cm line”, Bull. Astr. Inst. Netherlands 14 (1957) 1.
[2] V. C. Rubin, N. Thonnard, and W. K. Ford Jr., “Rotational properties of 21 SC galaxies with a large range of luminosities and radii, from NGC 4605/R = 4 kpc to UGC 2885/R = 122 kpc”, Astrophys. J. 238 (1980) 471, doi:10.1086/158003.
[3] G. F. Smoot et al., “Structure in the COBE differential microwave radiometer first year maps”, Astrophys. J. 396 (1992) L1, doi:10.1086/186504.
[4] Boomerang Collaboration, “A flat Universe from high resolution maps of the cosmic microwave background radiation”, Nature 404 (2000) 955, doi:10.1038/35010035, arXiv:astro-ph/0004404.
[5] WMAP Collaboration, “Wilkinson microwave anisotropy probe (WMAP) three year results: implications for cosmology”, Astrophys. J. Suppl. 170 (2007) 377,
doi:10.1086/513700, arXiv:astro-ph/0603449.
[6] J. L. Feng, “Dark matter candidates from particle physics and methods of detection”, Ann. Rev. Astron. Astrophys. 48 (2010) 495,
doi:10.1146/annurev-astro-082708-101659, arXiv:1003.0904.
[7] T. A. Porter, R. P. Johnson, and P. W. Graham, “Dark matter searches with astroparticle data”, Ann. Rev. Astron. Astrophys. 49 (2011) 155,
doi:10.1146/annurev-astro-081710-102528, arXiv:1104.2836.
[8] ATLAS Collaboration, “Search for new phenomena in final states with an energetic jet and large missing transverse momentum in pp collisions at√s=13 TeV using the ATLAS detector”, Phys. Rev. D 94 (Aug, 2016) 032005,
doi:10.1103/PhysRevD.94.032005.
[9] CMS Collaboration, “Search for dark matter, extra dimensions, and unparticles in monojet events in proton proton collisions at√s =8 TeV”, Eur. Phys. J. C 75 (2015) 235,