Organização: Comitê Científico Interinstitucional Editor Científico: Marcia Cristina Zago Novaretti Editor Adjunto: César Augusto Biancolino Avaliação: Double Blind Review pelo SEER/OJS Revisão: Gramatical, normativa e de formatação
AUSTERIDADE CONDUZ ACESSIBILIDADE À ASSISTÊNCIA MÉDICA? RESUMO
Em presença da crise económica pode ter ocorrido uma adaptação dos sistemas de saúde com impacto na acessibilidade. Com o objetivo de avaliar esta hipótese foram recolhidos dados anuais para oito países europeus – Alemanha, Reino Unido, Espanha, França, Itália, Irlanda, Grécia e Portugal – entre 2005 e 2011. Os países foram agrupados em três grupos, de acordo com a tipologia de intervenção externa. Foi considerado um período anterior e outro posterior à crise, e avaliada a diferença nas médias, através do teste t de Student, para as variáveis relacionadas com a percentagem de doentes que manifestou necessidades médicas não satisfeitas devido ao custo excessivo dos cuidados de saúde, da distância, ou das listas de espera. Depois procedeu-se a uma análise de correlação recorrendo ao cálculo do coeficiente de Spearman, entre as variáveis associadas à acessibilidade e a taxa de desemprego. Foi observado um aumento de doentes com necessidades médicas não satisfeitas por custo excessivo, durante a austeridade, exceto para a Alemanha e Reino Unido. Os valores identificados foram mais elevados para os segmentos de rendimentos mais baixos, e de níveis de instrução elementares. Foi observado que para a França, Itália e Espanha a acessibilidade aumenta com o desemprego; contudo não foi encontrada associação para a Grécia, Irlanda e Portugal. Palavras-chave: Acessibilidade; Sistema de Saúde; Austeridade; Cuidados de Saúde; Taxas Moderadoras; Listas de Espera.
DOES AUSTERITY DRIVES HEALTHCARE ACCESSIBILITY? ABSTRACT
The financial crisis may impact on healthcare systems, and challenge healthcare accessibility by increasing the percentage of patients with unmet medical needs due to the cost, the distance, and waiting lists. In order to analyze if austerity drives healthcare accessibility, we take annual data at country level, for Germany, United Kingdom, Spain, France, Italy, Ireland, Greece, and Portugal, from 2005 to 2011 (n=56). The countries were clustered according to the external intervention during financial crisis. We consider a period ex-ante and another one ex-post crisis, and assess the difference in averages, by using the t Student test. This is followed by a correlation analysis by calculating Spearman’s coefficient, to assess if there is an association between the unemployment rate and the percentage of patients with unmet medical needs, considering the educational levels and income quintiles, regarding each one of the clusters. We found that during austerity there is an increase in the percentage of patients with unmet medical needs due to excessive cost, except for Germany and United Kingdom, but a decrease in the percentage of patients with unmet medical needs due to the distance and waiting lists. These figures were higher for low income and educational levels. For the cluster of France, Italy and Spain, the healthcare accessibility improves with increasing unemployment rates; but for Greece, Ireland and Portugal there is no association between accessibility and unemployment rate. Keywords: Accessibility; Healthcare System; Economic Crisis; Healthcare; Healthcare Cost; Waiting Lists.
Maria da Conceição Constantino Portela1
Adalberto Campos Fernandes2
1 Professora da Universidade Católica Portuguesa e da Escola Nacional de Saúde Pública de Portugal. Portugal.
E-mail: [email protected]
1 INTRODUCTION
Accessibility is an effective contact with the healthcare system. It is achieved when there is an effective association between healthcare demand and supply. This concept is not straightforward in Europe, because there is healthcare systems universality, but in United States is synonymous of private healthcare insurance (Goddard, 2001).
Recession may impact on accessibility, as a decrease in healthcare budget may follow a decrease in the national budget (Peiró, 2012). In fact there are several references in the literature regarding the decreasing rate of healthcare expenditure during recession (Martín, 2011; Keegan, 2013; Quaglio, 2013). But during crisis we can expect a broader impact on social security systems, which were one of the main safeguards of public health (Stuckler, 2009; Stuckler, 2011; Kaplan, 2012; Karanikolos, 2013). The references show diverse results, and some of them report a positive association between unemployment and health status (Suhrcke, 2012; Astell-Burt, 2013), which is stronger for the lower socioeconomic segments of population (Larson, 2010, Kaplan, 2012). This effect has been shown for Greece, were the healthcare provided to the most deprived population, by non-governmental associations, has increased during recession, from 3-4% to 30% (Kentikelenis, 2011).
The supply side of healthcare systems depends on several variables, such as those related with their structure, and organization. An example from Ireland shows the effect of the recession on healthcare budget, which is followed by a decrease in the number of healthcare professionals, and tends to increase waiting lists (Briggs, 2013). This hurdle may force patients to longer trips, or extra expenses with private insurance.
The demand is mainly dependent on individual factors, and it is usually considered a proxy of accessibility achieved (Goddard, 2001). The dropping of familiar income during austerity may decrease the budget available for healthcare; this is able to postpone healthcare demand, mainly for the highest user fees, and the low income segment. There are exceptions associated with a low cost, such as in Spain by 2012 (Peiró, 2012), but also for Italy. In Portugal user fees increased in sequence of external intervention, with some exceptions for the most social deprived (Barros, 2012).
Healthcare systems financed by taxes were more sensitive to fiscal austerity, than those funded by contributions to social security (Reeves A, 2013); the later were also prone to achieve efficiency and cost containment (Tenbensel,2012).
During austerity there are challenges arising from an increase demand and a decreasing budget
It was found an healthcare budget protection in Belgium and Denmark, a freezing in the United Kingdom (Quaglio,2013), and a decrease in Austria, Latvia, Poland and Slovenia; but also an expansion in Moldova for the lower income segments; in the Netherlands the services provided by the public system were restrained; while an increase in the cost associated with access was observed for the Czech Republic, Denmark, Estonia, Finland, France, Greece, Ireland, Italy, Latvia, the Netherlands, and Portugal
(Quaglio,2013), Romania and
Slovenia(Karinokolos,2013). In Spain universal coverage has been restricted, and there was an increase in direct copayments (Gallo,2013). In Italy the successive financial deterioration forced the implementation of a set of oriented privileged providing essential services measures; the crisis has accelerated, rather than impose the adoption of radical new interventions (Belvis, 2012).
Some research regarding healthcare accessibility in Italy shows that in the wake of the crisis 21% of households reduced spending on health care, and 10% postponed surgeries; difficulties in accessing health services rose from 5.5% to 9.5% of the total - of which 44.8% were related to cost, 32.1% to delays and 23% were due to closure of healthcare units (Belvis, 2012).
By 2011, 49% of French citizens did not identify any problems regarding health care access, but in 2012 this figure decreases to 38%, in Spain they rise from 67% to 76% (Cercle Santé Société,2012).
The recession has deeply affected Greece, as from 2007 to 2009 promote an increase in the population who postponed necessary medical consultations, OR 1.15, the reasons given were not cost OR 0.87, but rather waiting lists OR 1.83, and distance OR 2.5 (Kentikelenis, 2011).
Recession can also impact on patients able to carryover from private to the public healthcare supply. In Ireland 50% of the total population has private healthcare insurance; however this figure is less than 10% of total health expenditure (Briggs, 2013). Also the United States shows an increasing pressure from private spending to the federal Medicaid system, during recession (Truffer,2010).
There are a lot of studies regarding the impact of the crisis on health indicators, however the same attention wasn´t provided to the healthcare systems (Karanikolos, 2013). It has not been possible to prevent current austerity; however it is still time to consider a strategic intervention in order to reconfigure healthcare systems, by acting on the structural causes of deficits (Ferrè,2012). The engine of this transformation should be the economic growth, redistribution, and equitable access to health care (Benatar,2011).
2 METHODS
We consider a sample of eight European countries, according to the external intervention during crisis: countries with no intervention – United Kingdom and Germany; plus countries with financial disruption and a financial intervention – Spain, Italy and France; plus Greece, Ireland and Portugal, were
not able to pursue their financial commitments, and the external intervention demands a structural impact. The time frame starts by 2005 until 2011. The data is available from Eurostat database.
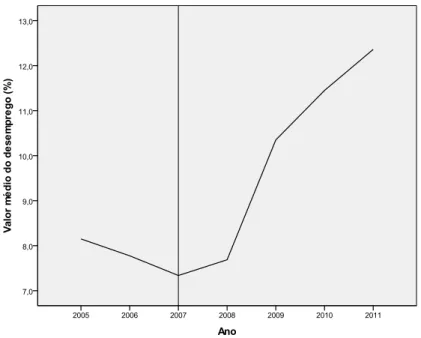
To define the period’s ex-ante and ex-post crisis we consider the unemployment rate. The cut off is associated with the beginning of the crisis, and is identified by 2007, as represented at Figure 1.
Figure 1 - Unemployment rate for all countries, from 2005 to 2011. Source: Eurostat database, November 2013.
To assess the austerity impact on accessibility we consider the percentage of the population with unmet medical needs due to too expensive, too far to travel, and waiting lists, as defined by Eurostat.
The data has been tiered according to the periods before and after crisis, for the three groups of countries. We consider the three educational levels, and the fifth income quintiles.
A descriptive, cross-sectional, retrospective analysis was performed, in order to calculate the difference in averages for each one of the variables, regarding the three groups of countries for both of the periods, by using t Student’s test. The results will allow defining a healthcare accessibility profile for each one of the clusters.
To assess if there is an association between the austerity and the healthcare accessibility, we calculated the Spearman’s coefficient between the unemployment rate and the percentage of the population with unmet medical needs due to too expensive healthcare, too far to travel or waiting lists.
The former was chosen as it is usually considered in the healthcare research about austerity impact, and the latter as it covers different aspects related to healthcare access – cost, distance and waiting lists. We use the Statistical Package for Social Sciences software, to perform the statistical analysis.
3 RESULTS
3.1 Macroeconomic Environment
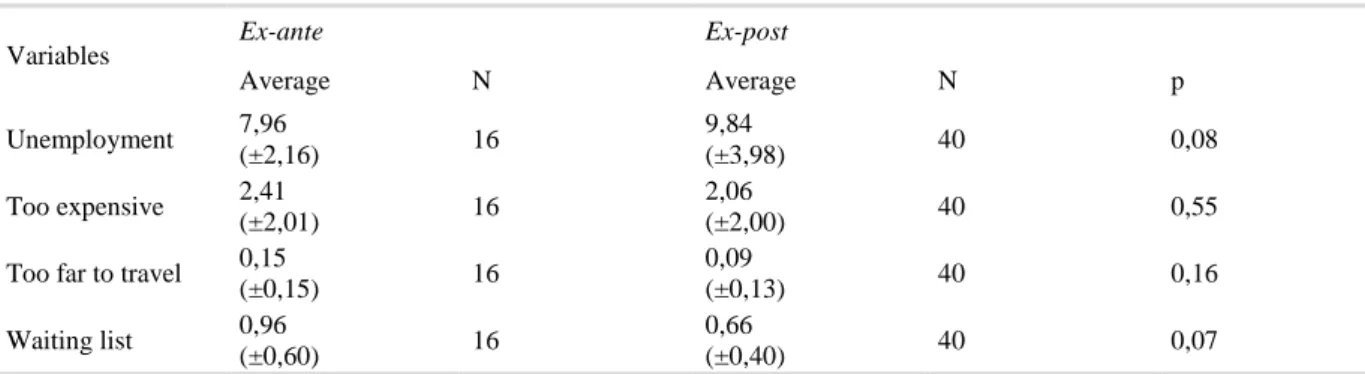
We found an increase in the averages for unemployment rate, between the period’s ex-ante and ex-post crisis, as present in Table 1. During the first two years the unemployment rate has fallen, according Figure 1. During the next five years, the unemployment rate increases from 7,96 to 9,84%. For Germany and the United Kingdom, the unemployment rate remains flat between the two periods. But for the others six countries, an increase was found.
Table 1 - Average values of unemployment, percentage of patients with unmet medical needs due to expensive care, too far to travel and waiting lists, before and during crisis for Germany, United Kingdom, France, Italy, Spain,
Greece, Ireland, and Portugal.
Variables Ex-ante Ex-post
Average N Average N p Unemployment 7,96 (±2,16) 16 9,84 (±3,98) 40 0,08 Too expensive 2,41 (±2,01) 16 2,06 (±2,00) 40 0,55
Too far to travel 0,15
(±0,15) 16 0,09 (±0,13) 40 0,16 Waiting list 0,96 (±0,60) 16 0,66 (±0,40) 40 0,07
Souce: Calculated by the authors based on Eurostat database, November 2013. 3.2 Healthcare Accessibility Global Profile
During crisis, the percentage of patients which report unmet medical needs due to expensive
healthcare, the distance, and waiting lists has fallen, according to Table 2; however the differences were not statistically significant, which may be due to the small sample size.
Table 2 - Average values of the unemployment rate and the percentages of patients with unmet medical needs due to expensive cost, too far to travel and waiting lists, for the periods ex-ante and ex-post crisis, for the three groups of
countries.
Variables
Germany,United Kingdom France, Italy,Spain Greece, Ireland, Portugal
ex-ante ex-post ex-ante ex-post ex-ante ex-post
Average N Average N p Average N Average N p Average N Average N p
Unemployment 7,95 (±3,33) 4 7,13 (±1,14) 10 0,66 8,45 (±1,01) 6 10,79 (±4,94) 15 0,10 7,48 (±2,40) 6 10,69 (±3,44) 14 0,05 Too expensive 2,93 (±3,5) 4 0,79 (±0,94) 10 0,31 1,60 (±1,33) 6 1,91 (±1,66) 15 0,69 2,88 (±1,34) 6 3,05 (±2,36) 15 0,87
Too far to travel 0,08
(±0,10) 4 0,09 (±0,06) 10 0,78 0,10 (±0,06) 6 0,04 (±0,05) 15 0,03 0,25 (±0,21) 6 0,15 (±0,19) 15 0,28 Waiting list 1,58 (±0,63) 4 0,85 (±0,25) 10 0,01 0,70 (±0,60) 6 0,55 (±0,52) 15 0,59 0,82 (±0,26) 6 0,63 (±0,29) 15 0,18
Source: Calculated by the authors based on Eurostat database, November 2013. Along the seven years’ time frame the highest
value of the percentage patients with unmet medical needs is 3,01%; it pertains to the group of Greece, Ireland and Portugal, and regards expensive care. In France, Italy and Spain the average value is 1,82%, and the lowest value of 1,4% was observed for Germany and United Kingdom.
Waiting lists were the major barrier for Germany and United Kingdom for 1,06% of patients, but for France, Italy, Spain, Greece, Ireland and Portugal it was expensive cost.
3.3 Healthcare Accessibility and Austerity
The differences observed between the periods pre and post crisis present a similar pattern; considering excessive cost and distance they were the opposite for the group of Germany and United Kingdom, and for the other six countries. The percentage of the population with unmet medical needs, due to waiting lists, falls during the recession for all the countries.
The highest percentage of patients with accessibility constrains during recession pertains to excessive cost for Greece, Ireland and Portugal. The same major hurdle has been identified for France, Italy and Spain, however for a lower percentage of patients.
Both of those figures increase with crisis. For Germany and United Kingdom, the waiting lists were the major hurdle for 0,85% of patients.
a) Too expensive related to education and income
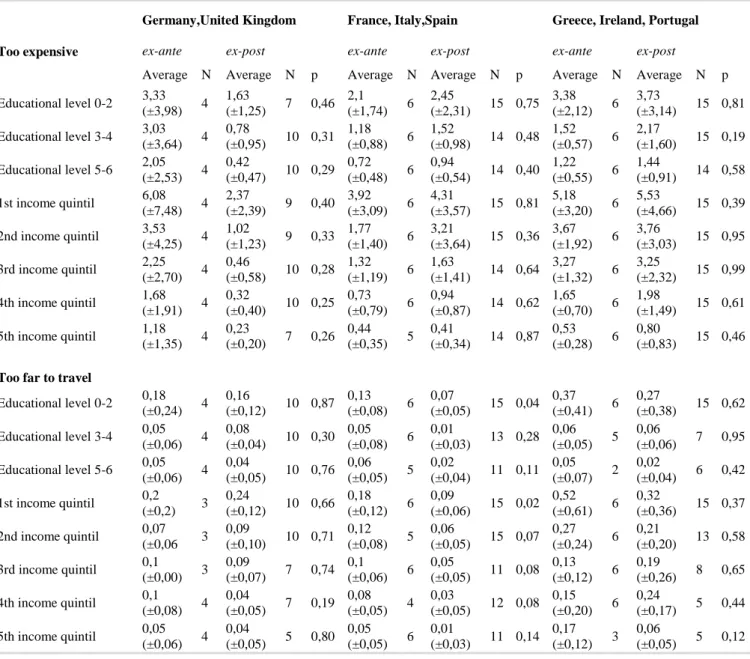
On the one hand, the lower educational level present the highest average values for all the countries, and varies from 1,63% for Germany and United Kingdom, to 3,73% for Greece, Ireland and Portugal, during crisis; on the other hand, the lowest percentages were found at the higher educational level, and they vary from 0,42% to 1,44%, for the same countries during austerity.
The difference in averages related with the five income levels follow the same pattern has the one observed for educational levels, as we can found at Table 3. A decrease was found for all the income quintiles at Germany and United Kingdom, which attained the lowest value at the fifth income quintile during crisis. The highest value was found for the first one. It was found that for Greece, Ireland and Portugal, the base values were higher than the ones for France, Italy and Spain, for all the educational levels, and income quintiles. During the crisis we found the same pattern.
Table 3 - Averages of the percentages of patients with unmet medical needs due to expensive cost, too far to travel and waiting lists, for the periods ex-ante and ex-post crisis, for the three groups of countries, according to
educational levels and income quintiles.
Too expensive
Germany,United Kingdom France, Italy,Spain Greece, Ireland, Portugal
ex-ante ex-post ex-ante ex-post ex-ante ex-post
Average N Average N p Average N Average N p Average N Average N p
Educational level 0-2 3,33 (±3,98) 4 1,63 (±1,25) 7 0,46 2,1 (±1,74) 6 2,45 (±2,31) 15 0,75 3,38 (±2,12) 6 3,73 (±3,14) 15 0,81 Educational level 3-4 3,03 (±3,64) 4 0,78 (±0,95) 10 0,31 1,18 (±0,88) 6 1,52 (±0,98) 14 0,48 1,52 (±0,57) 6 2,17 (±1,60) 15 0,19 Educational level 5-6 2,05 (±2,53) 4 0,42 (±0,47) 10 0,29 0,72 (±0,48) 6 0,94 (±0,54) 14 0,40 1,22 (±0,55) 6 1,44 (±0,91) 14 0,58 1st income quintil 6,08 (±7,48) 4 2,37 (±2,39) 9 0,40 3,92 (±3,09) 6 4,31 (±3,57) 15 0,81 5,18 (±3,20) 6 5,53 (±4,66) 15 0,39 2nd income quintil 3,53 (±4,25) 4 1,02 (±1,23) 9 0,33 1,77 (±1,40) 6 3,21 (±3,64) 15 0,36 3,67 (±1,92) 6 3,76 (±3,03) 15 0,95 3rd income quintil 2,25 (±2,70) 4 0,46 (±0,58) 10 0,28 1,32 (±1,19) 6 1,63 (±1,41) 14 0,64 3,27 (±1,32) 6 3,25 (±2,32) 15 0,99 4th income quintil 1,68 (±1,91) 4 0,32 (±0,40) 10 0,25 0,73 (±0,79) 6 0,94 (±0,87) 14 0,62 1,65 (±0,70) 6 1,98 (±1,49) 15 0,61 5th income quintil 1,18 (±1,35) 4 0,23 (±0,20) 7 0,26 0,44 (±0,35) 5 0,41 (±0,34) 14 0,87 0,53 (±0,28) 6 0,80 (±0,83) 15 0,46
Too far to travel
Educational level 0-2 0,18 (±0,24) 4 0,16 (±0,12) 10 0,87 0,13 (±0,08) 6 0,07 (±0,05) 15 0,04 0,37 (±0,41) 6 0,27 (±0,38) 15 0,62 Educational level 3-4 0,05 (±0,06) 4 0,08 (±0,04) 10 0,30 0,05 (±0,08) 6 0,01 (±0,03) 13 0,28 0,06 (±0,05) 5 0,06 (±0,06) 7 0,95 Educational level 5-6 0,05 (±0,06) 4 0,04 (±0,05) 10 0,76 0,06 (±0,05) 5 0,02 (±0,04) 11 0,11 0,05 (±0,07) 2 0,02 (±0,04) 6 0,42 1st income quintil 0,2 (±0,2) 3 0,24 (±0,12) 10 0,66 0,18 (±0,12) 6 0,09 (±0,06) 15 0,02 0,52 (±0,61) 6 0,32 (±0,36) 15 0,37 2nd income quintil 0,07 (±0,06 3 0,09 (±0,10) 10 0,71 0,12 (±0,08) 5 0,06 (±0,05) 15 0,07 0,27 (±0,24) 6 0,21 (±0,20) 13 0,58 3rd income quintil 0,1 (±0,00) 3 0,09 (±0,07) 7 0,74 0,1 (±0,06) 6 0,05 (±0,05) 11 0,08 0,13 (±0,12) 6 0,19 (±0,26) 8 0,65 4th income quintil 0,1 (±0,08) 4 0,04 (±0,05) 7 0,19 0,08 (±0,05) 4 0,03 (±0,05) 12 0,08 0,15 (±0,20) 6 0,24 (±0,17) 5 0,44 5th income quintil 0,05 (±0,06) 4 0,04 (±0,05) 5 0,80 0,05 (±0,05) 6 0,01 (±0,03) 11 0,14 0,17 (±0,12) 3 0,06 (±0,05) 5 0,12
Waiting list Educational level 0-2 1,3 (±0,67) 4 0,79 (±0,30) 10 0,23 0,73 (±0,73) 6 0,59 (±0,65) 15 0,67 1,07 (±0,23) 6 0,75 (±0,37) 15 0,07 Educational level 3-4 1,58 (±0,65) 4 0,84 (±0,31) 10 0,01 0,57 (±0,47) 6 0,48 (±0,42) 15 0,68 0,55 (±0,24) 6 0,61 (±0,34) 14 0,68 Educational level 5-6 1,88 (±0,75) 4 0,92 (±0,29) 10 0,08 0,48 (±0,33) 6 0,48 (±0,36) 15 0,99 0,18 (±0,10) 4 0,47 (±0,18) 11 0,01 1st income quintil 1,68 (±0,78) 4 0,99 (±0,30) 10 0,18 0,88 (±0,86) 6 0,69 (±0,71) 15 0,61 0,93 (±0,44) 6 0,85 (±0,46) 15 0,72 2nd income quintil 1,53 (±0,57) 4 0,92 (±0,36) 10 0,03 0,78 (±0,68) 6 0,67 (±0,65) 15 0,72 1,17 (±0,47) 6 0,71 (±0,39) 15 0,03 3rd income quintil 1,58 (±0,74) 4 0,80 (±0,32) 10 0,02 0,70 (±0,55) 6 0,49 (±0,51) 15 0,42 0,95 (±0,36) 6 0,61 (±0,32) 15 0,04 4th income quintil 1,63 (±0,62) 4 0,81 (±0,26) 10 0,07 0,50 (±0,49) 6 0,47 (±0,47) 15 0,91 0,70 (±0,43) 6 0,59 (±0,33) 14 0,55 5th income quintil 1,40 (±0,62) 4 0,68 (±0,32) 10 0,01 0,58 (±0,45) 6 0,41 (±0,38) 15 0,37 0,42 (±0,16) 6 0,36 (±0,41) 14 0,77
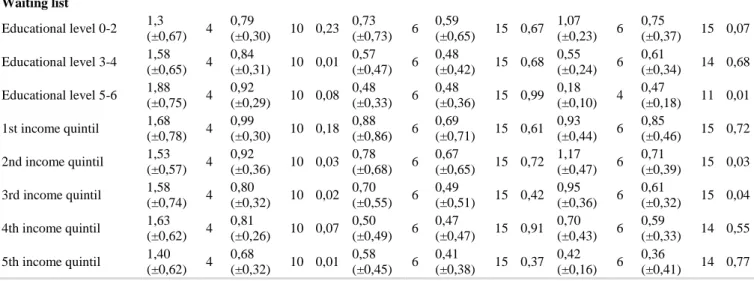
Source: Calculated by the authors based on Eurostat database, November 2013. For Germany and UK we found a very strong
to strong positive association between unemployment and the percentage of the population with unmet medical needs due to expensive care before crisis, but
a slight one during austerity, regarding income, and educational levels. In both of the cases it was not related to educational levels neither with income quintiles, according the data at Table 4.
Table 4 - Spearman´s correlation coefficients between unemployment rate and the percentage of the population with unmet medical needs due to expensive cost, too far to travel and waiting lists, during the period’s ante and
ex-post crisis, for the three groups of countries, according to educational levels and income quintiles.
Unemployment Too expensive
Germany,United Kingdom France, Italy,Spain Greece, Ireland, Portugal
ex-ante ex-post ex-ante ex-post ex-ante ex-post
Correlation Coefficient N Correlation Coefficient N Correlation Coefficient N Correlation Coefficient N Correlation Coefficient N Correlation Coefficient N Educational level 0-2 1,00** 4 0,25 7 -0,41 6 -,58* 15 0,87* 6 0,12 15 Educational level 3-4 0,95 4 0,24 10 -0,58 6 -,72** 14 0,69 6 -0,03 15 Educational level 5-6 0,80 4 0,13 10 -0,27 6 -,71** 14 -0,26 6 0,15 14 1st income quintil 0,80 4 0,20 9 -0,49 6 -,52* 15 0,46 6 -0,03 15 2nd income quintil 1,00** 4 0,41 9 -0,46 6 -,55* 15 0,72 6 0,16 15 3rd income quintil 0,95 4 0,27 10 -0,41 6 -,76** 14 0,62 6 -0,06 15 4th income quintil 0,80 4 0,28 10 -0,52 6 -,78** 14 0,75 6 0,22 15 5th income quintil 0,95 4 0,11 7 -0,82 5 -,68** 14 0,44 6 0,00 15 Unemployment
Too far to travel
Educational level 0-2 0,94 4 0,26 10 0,26 6 -0,12 15 0,89* 6 0,07 15
Educational level 3-4 0,89 4 0,43 10 -0,37 6 -0,38 13 -0,28 5 0,59 7
Educational level 5-6 0,00 4 0,57 10 0,59 5 -0,11 11 -1,00 2 0,65 6
1st income quintil 1,00** 3 0,04 10 0,32 6 -0,16 15 0,68 6 0,19 15
3rd income quintil . 3 0,02 7 -0,25 6 -0,29 11 0,94** 6 0,30 8 4th income quintil 0,63 4 0,14 7 0,77 4 -0,14 12 0,87* 6 0,87 5 5th income quintil 0,44 4 0,44 5 -0,59 6 -0,05 11 0,00 3 -0,57 5 Unemployment Waiting list Educational level 0-2 -0,80 4 -0,22 10 -0,86* 6 -0,37 15 0,70 6 -0,15 15 Educational level 3-4 -0,80 4 -0,07 10 -0,63 6 -0,76** 15 0,35 6 -0,15 14 Educational level 5-6 0,20 4 -0,09 10 -0,55 6 -0,65** 15 -0,94 4 -0,18 11 1st income quintil -0,60 4 0,01 10 -0,63 6 -0,65** 15 -0,57 6 -0,11 15 2nd income quintil -0,10 4 -0,23 10 -0,79 6 -0,63* 15 0,30 6 -0,06 15 3rd income quintil -0,40 4 -0,25 10 -0,63 6 -0,50 15 0,49 6 0,09 15 4th income quintil -0,73 4 -0,15 10 -0,86* 6 -0,64** 15 0,69 6 -0,20 14 5th income quintil -0,40 4 -0,26 10 -0,67 6 -0,62* 15 0,40 6 -0,14 14
Source: Calculated by the authors based on Eurostat database, November 2013. There was a negative association between
both of the variables, for all the educational levels and income quintiles, in France Italy and Spain. It has risen from weak to moderate and strong, and was statistically significant during austerity.
Regarding Greece, Ireland, and Portugal, the association between the two variables is positive and varies from moderate to high, except for the third educational level which is negative and weak before crisis. There is a changing association pattern during austerity, which varies between very weak and weak, and turns to negative for the educational level 3-4 and also for the first and third income quintiles.
b) Too far to travel related to education and income
Between the two periods, there is a generic decrease in the percentage of the population with unmet medical needs due to the distance, for all the three groups of countries. The averages were lowest than those ones regarding the percentage of the population with unmet medical needs due to excessive cost, and waiting lists. The worst performer is the group of Greece, Ireland and Portugal were 0,27% of patients that belong to the lowest educational level report unmet medical needs due to distance, during crisis; this figure increases to 0,32% regarding patients at the lowest income quintile during recession. The best performer is the group of France, Italy and Spain. Once again, the lowest educational levels and income quintiles present the highest values of unmet medical needs, with the last ones higher than the former.
There is a positive association between the unemployment and the percentage of the population with unmet medical needs due to too far to travel, which decreases deeply between the two periods, for
Germany and United Kingdom, except for the highest income quintile.
The association presents a mix profile – positive and negative values – before crisis, however during crisis it turns to negative for all the patient segments concerning educational levels and income quintiles, for France, Italy and Spain. It varies from very weak to strong before the crisis, to very weak to moderate during the austerity period.
By the contrary, the association remains positive during both of the periods, for Greece, Ireland and Portugal. However there is in general a decrease in Spearman’s coefficient which became very weak to moderate for the lowest levels of education and income segmentation.
c) Waiting lists related to education and income
The average percentage of the population with unmet medical needs due to waiting lists, decreases between the two periods for Germany, United Kingdom, France, Italy and Spain; and also for the other three countries, except for the 3-4 and 5-6 educational levels, were we found an increase, being the last one statistically significant.
The pattern of association is very similar regarding the three groups of countries, which present a negative coefficient for both of the periods, regarding the educational levels and income quintiles. However, the magnitude of the association is different between them. The lowest coefficients, which represent a very weak to weak association, were found for Germany, United Kingdom, Greece, Ireland and Portugal, at the ex-post period. At the ex-ante period they present values aligned with a very week to strong association, and the association is positive for all the
income quintiles – except the first one – regarding Greece, Ireland and Portugal.
The pattern of association for France, Italy and Spain is quite different. They maintain almost the same magnitude between the two periods but at the ex-post period it is statistically significant for almost all the segments regarding educational level and income quintiles. The lowest Spearman’s coefficient was found for the first educational level, but it increases for the third one.
4 DISCUSSION
During recession, the percentage of patients with unmet medical needs due to waiting lists is the main hurdle to healthcare access for Germany and United Kingdom, while for France, Italy, Spain, Ireland, Greece, and Portugal is the expensive healthcare cost. The most vulnerable groups were those at the lower income quintiles, and educational attainment levels. The gradient tends to be sparse for higher levels segments related to income and education.
For France, Italy and Spain there is a negative, moderate to high statistically significant association, between unemployment and poor access due to expensive cost; while for Greece, Ireland and Portugal there is no association.
According those results, the percentage of patients with unmet medical needs due to expensive care decreases along with an increase in unemployment rates for France, Italy and Spain; but for Greece, Ireland and Portugal the accessibility due to expensive cost is independent of unemployment rate. Indeed, for some countries, it appears that austerity policies may be resulting in a set of independent and much greater adverse effects on health than the economic crisis per se (Suhrcke, 2012). There are several factors which are able to explain the negative association between unemployment and the percentage of patients with unmet medical needs due to expensive cost, observed for the France, Italy and Spain. First, the cut off related to the beginning of the crisis was considered for the year 2007, however just for France, the unemployment rate decreases until 2008 and by then reverses his direction to start to growth. So, between 2007 and 2008 the pattern of unemployment in France is the opposite of that one found for Spain and Italy. Second, we found that between 2008 and 2009 the percentage of patients with unmet medical needs due to expensive cost remains flat for France and Italy, and also between 2009 and 2010 for Spain. In the latter case a decline between 2009 and 2010 draws to occur. During this period unemployment increased in all of the three countries. Third, in these countries there is no external
healthcare system, but only a financial one, which took place after 2011. This is able to explain the resilience to austerity, observed for healthcare systems in those countries.
Conversely, for Greece, Ireland and Portugal, there is no association between unemployment rate and the percentage of patients showing a cost barrier regarding accessibility during crisis, since the correlation coefficients are very low. Maybe healthcare systems structural impact due to external intervention is the key to explain the results attained.
The distance to the healthcare system decreases between both of the periods; however it is independent of unemployment for all groups of countries analyzed.
A decrease in the percentage of patients with unmet medical needs due to waiting lists was observed for all of the three groups of countries. Once again the highest segments of the population, concerning income, were those with minor concerns about accessibility due to waiting lists, for all the countries. However concerning education, there is an opposite profile regarding Germany and United Kingdom which present the highest percentage of patients with unmet medical needs due to the distance to healthcare system, at the lowest educational level of the population. The highest percentages were found for the lower segments of the population in France, Italy, Spain, Greece, Ireland and Portugal.
We found a negative, moderate to high, statistically significant association between the percentage of patients with unmet medical needs due to waiting lists and unemployment for the group from France, Italy and Spain. This means that waiting lists tend to decrease along with the rise of unemployment. In contrast, no association was found for the group of Greece, Ireland and Portugal.
While during crisis, it was found a decrease in the percentage of patients with unmet medical needs due to waiting lists, the opposite was observed for unmet medical needs due to expensive cost. The combination of those two factors may show that a decrease in waiting lists may be mediated by the reduction in the number of patients reaching the health system due to expensive cost.
This study has some limitations, such as the small sample size, which does not allow the correlation analysis by using Pearson coefficient, which provides more robust information regarding the association between the variables. Also the number of observations in the pre-crisis period is much lower than during the crisis period, for lack of complete data in the source that was considered. This may have contributed to constrain the value of the statistical significance of the means analysis; although it may also result from the diversity of health systems in each group.
5 CONCLUSIONS
Expensive care is the main barrier to healthcare access for France, Italy, Spain, Greece, Ireland and Portugal. The distance is the less relevant variable, and waiting lists were an hurdle for Germany and United Kingdom. The lowest levels of education and income were most severely affected by the austerity.
The accessibility to healthcare system for Germany and the United Kingdom seems to be immune to crisis.
By the contrary, for France, Italy, Spain, Greece, Ireland and Portugal, there is an increase in the percentage of patients with unmet medical needs due to expensive care, but a decrease regarding those patients with unmet medical needs due to waiting lists. It seems that crisis safeguard accessibility to healthcare for patients in France, Italy and Spain, but the increasing barriers to access in Greece, Ireland and Portugal were immune to unemployment rate. Structural reforms required by external intervention may be the cause of the difference identified for those groups of countries.
REFERENCES
Astell-Burt T, Feng X. (2013). Health and the 2008 economic recession: evidence from the United Kingdom. PloS ONE 8(2): e56674. doi:10.1371/journal.pone.0056674.
Barros PP. (2012). Health policy reform in tough times: the case of Portugal. Health Policy, 106,17-22.
Belvis AG, Ferre F, Specchia ML, Valerio L, Fattore G, Ricciardi W. (2012). The financial crisis in Italy: Implications for the healthcare sector. Health Policy, 106,10-16.
Benatar SR, Gill S, Bakker I. Global Health and the global economic crisis. Am J Public Health 2011; 101:646-653.
Briggs ADM. How changes to Irish healthcare financing are affecting universal health coverage. Health Policy 2013; 113:45-49.
Briggs ADM. (2013). How changes to Irish healthcare financing are affecting universal health coverage. Health Policy, 113,45-49.
Cercle Santé Société. Healthcare in Europe and the United States. Results of the 2012 survey. Changes observed since 2006. Available at
http://www.europ- assistance.com/sites/default/files/2012_csa-europ_assistance_health_barometer-synthesis.pdf .[Access on 21-Jan-2014].
Ferrè F, Cuccurullo C, Lega F. (2012).The challenge and the future of health care turnaround plans: Evidence from the Italian experience. Health Policy, 106,3-9.
Gallo P,Gené-Badia J. (2013). Cuts drive health system reform in Spain. Health Policy, 113, 1-7. Goddard M, Smith P. (2001).Equity of access to health
care services: Theory and evidence from the UK. Social Science & Medicine, 53,1149-1162. Kaplan GA. (2012). Economic crises: Some thoughts
on why, when and where they (might) matter for health – A tale of three countries. Social Science and Medicine, 74,643-646.
Karinokolos M, Mladovsky P, Cylus J, Thomson S, Basu S, Stuckler D, Mackenback JP,McKee M. (2013). Financial crisis, austerity, and health in Europe. The Lancet, 381, 1323-1331.
Keegan C, Thomas S, Normand C, Portela C. (2013). Measuring recession severity and its impact on healthcare expenditure. International Journal of Health Care Finance and Economics,13, 139-155. Kentikelenis A,Karanikolos M, Papanicolas I, Basu S,
McKee M. (2011). Health effects of financial crisis:omens of a Greek tragedy. The Lancet, 378, 1457-1458.
Larson K, Halfon N. (2010). Family income gradientes in the health and health care access of US children, 14,332-342.
Martín JJM, González MPLA. (2011). La sostenibilidad del sistema nacional de salud en Espana. Ciência & Saúde Colectiva, 16(6), 2773-2782.
Peiró M, Barrubés J. (2012). New context and old challenges in the healthcare system. Revista Espanola de Cardiologia, 65 (7), 651-655.
Quaglio G, Karapiperis T, Van Woensel L, Arnold E, McDaid D. (2013). Austerity and health in Europe. Health Policy, 113, 13-19.
Reeves A, McKee M, Basu S, Stuckler D. (2013). The political economy of austerity and healthcare:cross-national analysis of expenditure changes in 27 European nations 1995-2011. Health
Policy,
http://dx.doi.org/10.1016/j.healthpol.2013.11.008. Suhrcke M, Stuckler D. (2012). Will the recession be bad for our health? It depends. Social Science & Medicine, 74, 647-653.
Stuckler D, Basu S, Suhrcke M, Coutts A, McKee M. (2009). The public health effect of economic crises and alternative policy responses in Europe: an empirical analysis. The Lancet, 374, 315-323.
Stuckler D, Basu S, Suhrcke M, Coutts A, McKee M. (2011). Effects of the 2008 recession on health: a first look at European data. The Lancet, 378,2011-2012.
Tenbensel T, Eagle S, Ashton T. (2012). Comparing health policy agendas across eleven high income countries:Islands of difference in a sea of similarity. Health Policy, 106,29-36.
Truffer CJ, Keehan S, Smith S, et al. (2010). Health spending projections through 2019: the recession impact continues. Health Affairs, 29(3), 522-529.