EUROPEAN ORGANISATION FOR NUCLEAR RESEARCH (CERN)
JHEP 10 (2018) 031
DOI:10.1007/JHEP10(2018)031
CERN-EP-2018-128 27th November 2018
Search for the Higgs boson produced in association
with a vector boson and decaying into two spin-zero
particles in the H → a a → 4b channel in p p
collisions at
√
s
= 13 TeV with the ATLAS detector
The ATLAS Collaboration
A search for exotic decays of the Higgs boson into a pair of spin-zero particles, H → aa, where the a-boson decays into b-quarks promptly or with a mean proper lifetime cτa up to 6 mm and has a mass in the range of 20–60 GeV, is presented. The search is performed in events where the Higgs boson is produced in association with a W or Z boson, giving rise to a signature of one or two charged leptons (electrons or muons) and multiple jets from b-quark decays. The analysis is based on the dataset of proton–proton collisions at
√
s = 13 TeV recorded in 2015 and 2016 by the ATLAS detector at the CERN Large Hadron Collider, corresponding to an integrated luminosity of 36.1 fb−1. No significant excess of events above the Standard Model background prediction is observed, and 95% confidence-level upper limits are derived for the production cross-sections for pp → W H, Z H and their combination, times the branching ratio of the decay chain H → aa → 4b. For a-bosons which decay promptly, the upper limit on the combination of cross-sections for W H and Z H times the branching ratio of H → aa → 4b ranges from 3.0 pb for ma = 20 GeV to 1.3 pb for ma = 60 GeV,
assuming that the ratio of W H to Z H cross-sections follows the Standard Model prediction. For a-bosons with longer proper lifetimes, the most stringent limits are 1.8 pb and 0.68 pb, respectively, at cτa∼ 0.4 mm.
© 2018 CERN for the benefit of the ATLAS Collaboration.
Reproduction of this article or parts of it is allowed as specified in the CC-BY-4.0 license.
1 Introduction
The discovery of the Higgs boson by the ATLAS and CMS collaborations [1, 2] at the Large Hadron Collider (LHC) has been a major achievement for the Standard Model (SM). A comprehensive programme to explore the properties of this particle is underway, including measurements of the branching ratios to SM particles and searches for decays into “exotic” or non-SM particles. Exotic Higgs boson decays are a powerful probe for physics beyond the SM (BSM). The Higgs boson has a very narrow decay width, so even a small coupling to a non-SM particle could open up a sizeable decay mode. Measurements at the LHC are in agreement with SM predictions, constraining the non-SM branching ratio of the Higgs boson to less than approximately 30% at 95% confidence level (CL) using the 7 and 8 TeV datasets [3–5]. Despite this experimental triumph, there is still ample room for exotic Higgs boson decays compatible with observations to date.
The Higgs boson has been proposed as a possible “portal” for hidden-sector particles to interact with SM particles [6–8]. Exotic decays in particular are predicted by many BSM theories [9], including those with an extended Higgs sector such as the Next-to-Minimal Supersymmetric Standard Model (NMSSM) [10–
14], models with a first-order electroweak phase transition [15,16], models with neutral naturalness [17–
19] and models of dark matter [20–24].
The decay of the Higgs boson into a pair of spin-zero particles a, which in turn decay into a pair of SM particles, arises in several scenarios of new physics [9]. In particular, if the a-boson mixes with the Higgs boson and inherits its Yukawa couplings, decays of the type a → b ¯b are expected to be dominant for ma > 2mb. Models of this type have been used to explain the observations of a gamma-ray excess from the galactic centre by the Fermi Large Area Telescope (FermiLAT) [25,26]. In models of neutral naturalness, the a-boson could have mean proper lifetimes (cτa) ranging from about 10 µm to O(km) [19]. Lifetimes smaller than 10 µm are referred to as “prompt”.
This paper considers the decay mode H → aa with the subsequent decay a → b ¯b, building on the previous work of ref. [27], in which a similar analysis was reported with a subset of the data considered here. The previous result set an upper limit on the production cross-section σ(W H) times the branching ratio for H → aa → 4b ranging from 6.2 pb for an a-boson mass of ma = 20 GeV to 1.5 pb for ma = 60 GeV,
compared with the SM cross-section σSM(WH)= 1.37 pb. This paper includes ten times more data, adds
the Z H channel and an improved analysis technique.
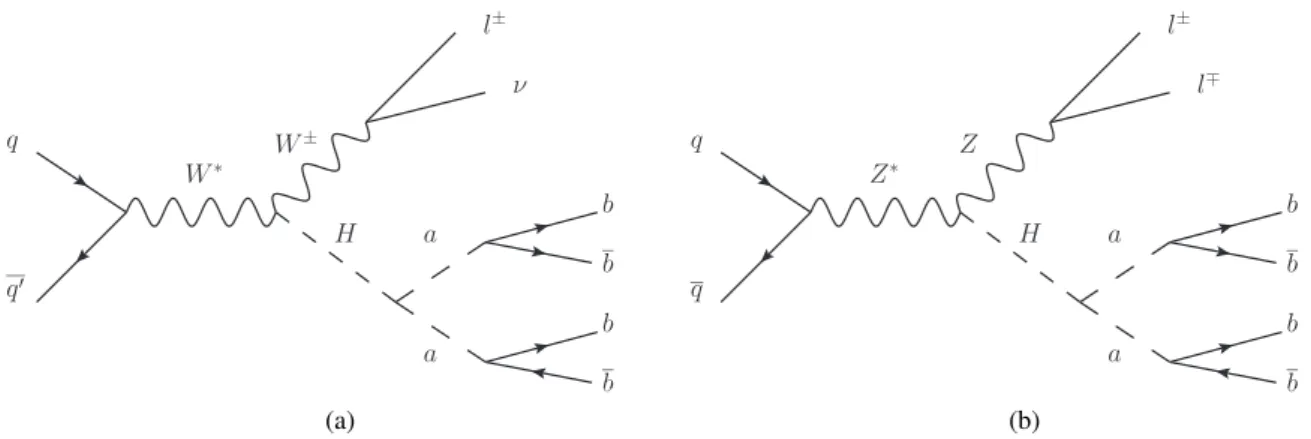
This search focuses on the W H and Z H processes, with W → `ν, Z → `` (` = e, µ) and H → aa → 4b, as shown in figure1. The a-boson can be either a scalar or a pseudoscalar under parity transformations, since the decay mode considered in this search is not sensitive to the difference in coupling. The a-boson signals considered have masses in the range 20 GeV ≤ ma ≤ 60 GeV and mean proper lifetimes, cτa, up to 6 mm.
The resulting signature has a single lepton or two leptons accompanied by a high multiplicity of jets originating from b-quarks (b-jets). Since four b-jets are produced from the decay of the Higgs boson, they tend to have a low transverse momentum (pT) compared with mH and can overlap, especially for
light a-bosons. Events with one or two electrons or muons, including those produced via leptonically decaying τ-leptons, are considered. The W H and Z H processes are chosen for this search because the presence of at least one charged lepton in the final state provides a powerful signature for triggering and for suppressing background from the high cross-section strong-interaction production of four b-jets.
H a b b b b ν W∗ l± a W± q q′ (a) H a b b b b l∓ Z∗ l± a Z q q (b)
Figure 1: Representative tree-level Feynman diagrams for the (a) W H and (b) Z H production processes with the subsequent decays W → `ν, Z → `` (` = e, µ) and H → aa → 4b.
Several kinematic variables, including the reconstructed masses in the decay H → aa → 4b, are combined to identify signal events. The background estimation techniques, systematic uncertainties and statistical treatment closely follow those used in other ATLAS searches with similar signatures [28–32].
2 ATLAS detector
The ATLAS experiment [33] is a multipurpose particle physics detector with forward–backward symmetric cylindrical geometry and nearly 4π coverage in solid angle.1 The interaction point is surrounded by an inner detector (ID) tracking system, a calorimeter system, and a muon spectrometer (MS). The ID covers |η| < 2.5 and consists of a silicon pixel detector, a silicon microstrip detector, and a transition radiation tracker. The ID includes the insertable B-layer [34], a pixel layer close to the interaction point, which provides high-resolution measurements at small radius to improve the tracking performance. A thin superconducting solenoid surrounds the ID and provides a 2 T axial magnetic field. The calorimeter system features a high-granularity lead/liquid-argon sampling calorimeter that measures the energy and the position of electromagnetic showers within |η| < 4.9. Liquid-argon sampling calorimeters are also used to measure hadronic showers in the endcap (1.5 < |η| < 3.2) and forward (3.1 < |η| < 4.9) regions, while a steel/scintillator tile calorimeter measures hadronic showers in the central region (|η| < 1.7). The MS surrounds the calorimeters and consists of three large superconducting air-core toroid magnets, each with eight coils, a system of precision tracking chambers (|η| < 2.7), and fast trigger chambers (|η| < 2.4). For Run 2, the ATLAS detector has a two-level trigger system. The first-level trigger is implemented in hardware and uses a subset of the detector information to reduce the rate of accepted events to 100
1ATLAS uses a right-handed coordinate system with its origin at the nominal interaction point (IP) in the centre of the detector
and the z-axis along the beam pipe. The x-axis points from the IP to the centre of the LHC ring, and the y-axis points upward. Cylindrical coordinates (r, φ) are used in the transverse plane, φ being the azimuthal angle around the z-axis. The pseudorapidity is defined in terms of the polar angle θ as η = − ln tan(θ/2). The transverse momentum pTand other transverse
variables are defined by projecting these variables into the x–y plane, and the transverse energy ETis defined as
q m2+ p2
T,
where m represents the mass of a considered object. The distance in the pseudorapidity–azimuthal-angle space is defined as ∆R=p(∆η)2+ (∆φ)2.
kHz. This is followed by the sofware-based high-level trigger that reduces the rate of recorded events to 1 kHz.
3 Event and object selection
Events are selected from proton–proton (pp) collisions collected by the ATLAS detector at the LHC at √
s = 13 TeV in 2015 and 2016. The dataset corresponds to an integrated luminosity of 3.2 ± 0.1 fb−1
recorded in 2015 and 32.9 ± 0.7 fb−1recorded in 2016, for a total of 36.1 ± 0.8 fb−1[35]. The data used for this search were collected using the single-electron or single-muon triggers with the lowest pTthresholds
available, 20 (26) GeV for muons and 24 (26) GeV for electrons in 2015 (2016) [36].
Electrons are reconstructed from energy deposits (clusters) in the electromagnetic calorimeter matched to tracks in the ID [37] and are required to have pT > 15 GeV and |η| < 2.47. Candidates in the transition
region between the barrel and endcap calorimeters, 1.37 < |η| < 1.52, are excluded. Electrons must satisfy the “tight” identification criterion based on a likelihood discriminant [38]. Muons are reconstructed by combining matching tracks in the ID and the MS, and are required to have pT > 10 GeV and |η| < 2.4.
Muon candidates must satisfy the “medium” identification criterion [39].
In order to distinguish leptons produced in the decays of W and Z bosons from those produced in the decays of heavy-flavour hadrons, all lepton candidates are required to originate from the primary interaction vertex, chosen as the vertex with the highest sum of the p2T of its associated tracks. Furthermore, since lepton candidates arising from background sources, such as decays of hadrons, are typically embedded in jets, all lepton candidates are required to be isolated from other particles in the event. This is achieved by imposing a maximal allowed value on the energy deposited in the calorimeter and/or the momentum of ID tracks within a cone around the direction of the lepton candidate, according to the gradient isolation criteria [38,39].
Jets are reconstructed from three-dimensional topological energy clusters [40] in the calorimeter using the anti-ktjet algorithm [41] implemented in the FastJet package [42] with a radius parameter of 0.4. Jets are calibrated using energy- and η-dependent corrections [43] and are required to have pT > 20 GeV and
|η| < 2.5. Events containing jets arising from non-collision sources or detector noise are removed [44]. Finally, a track-based veto, the Jet Vertex Tagger (JVT), is used to reduce contributions from jets arising from additional pp interactions (pile-up) [45].
Jets including hadrons, referred as jets, are identified using information from a multivariate b-tagging algorithm that combines information from an impact-parameter-based algorithm, from the explicit reconstruction of an inclusive secondary vertex and from a multi-vertex fitter that attempts to reconstruct the b- to c-hadron decay chain [46,47]. This b-tagging algorithm defines a set of “b-tagged” jets. The working point used provides an efficiency to identify jets with b-hadrons from the primary vertex of approximately 77%. The rejection factors are 134 against light-quark and gluon jets, about 6 against jets originating from c-quarks, and about 22 against hadronically decaying τ-leptons, as determined in a simulated sample of top-quark pair (t ¯t) events [46,47]. This b-tagging discriminant is used to categorize selected events as discussed in section5. The b-tagging algorithm is also efficient in identifying jets containing b-hadrons that do not originate from the primary vertex. The efficiency is largest for proper lifetimes of cτa ∼ 0.5 mm and decreases for longer lifetimes.
The missing transverse momentum, ETmiss, is defined as the magnitude of the transverse momentum imbalanceE®Tmiss, the negative vector sum of the transverse momenta of calibrated selected objects, such as electrons, muons and jets. The transverse momenta of charged-particle tracks compatible with the primary vertex and not matched to any of those objects are also included inE®Tmiss[48].
Events are required to have at least one reconstructed electron or muon with pT > 27 GeV which is matched
within a cone of size ∆R = 0.15 to the lepton candidate reconstructed by the trigger algorithms. Two event categories (single lepton and dilepton) are used to probe W H and Z H, respectively. Events with exactly one lepton are required to satisfy ETmiss > 25 GeV and the transverse mass2must fulfil mWT > 50 GeV, in order to be consistent with W boson decays. Events in the dilepton channel must have exactly two leptons with the same flavour and opposite electric charges. In the ee and µµ channels, the dilepton invariant mass must be consistent with the Z boson mass window 85–100 GeV. Events in the e µ channel (different flavour) are also used in the analysis to study backgrounds. Finally, events must have at least three jets, of which at least two must be b-tagged. The selection requirements are summarized in table1.
Table 1: Summary of requirements for the single-lepton and dilepton channels. Here m``is the dilepton invariant mass in the ee and µµ channels.
Requirement Single lepton Dilepton
Trigger single-lepton triggers
Leptons 1 isolated 2 isolated, opposite-charge
Jets ≥ 3
b-tagged jets ≥ 2
Other ETmiss > 25 GeV, mWT > 50 GeV 85 GeV < m`` < 100 GeV
4 Signal and background modelling
Simulated event samples are used to study the characteristics of the signal and to calculate its acceptance, as well as for most aspects of the background estimation. Monte Carlo (MC) samples were produced using the full ATLAS detector simulation [49] based on Geant 4 [50]. A faster simulation, where the full Geant 4 simulation of the calorimeter response is replaced by a detailed parameterization of the shower shapes [51], was adopted for some of the samples. To simulate the effects of pile-up, additional interactions were generated using Pythia 8.186 [52] with the A2 set of tuned parameters [53] and the MSTW2008LO [54] parton distribution function (PDF) set, and overlaid on the simulated hard-scatter event. Simulated events were reweighted to match the pile-up conditions observed in the data. All simulated events are processed through the same reconstruction algorithms and analysis chain as the data. In the simulation, the top-quark mass is assumed to be mt = 172.5 GeV. Decays of b- and c-hadrons were
performed by EvtGen v1.2.0 [55], except in samples simulated with the Sherpa event generator [56].
Signal samples of associated Higgs boson production with a W or Z boson, pp → W H or Z H, were generated with Powheg v2 [57–60] using the CT10 PDF set [61] at next-to-leading order (NLO). The Higgs boson mass is assumed to be mH = 125 GeV. The Higgs boson decay into two spin-zero a-bosons
2The transverse mass is defined as mW
T ≡
q
2ETmissp`T(1 − cos ∆φ), where p`Tis the transverse momentum of the lepton and ∆φ is the azimuthal angle between the lepton andE®Tmissdirections.
and the subsequent decay of each a-boson into a pair of b-quarks were simulated with Pythia 8.186. The a-boson decay was performed in the narrow-width approximation and the coupling to the b-quarks is assumed to be that of a pseudoscalar. However, since the polarization of the quarks is not observable, this search is insensitive to the chosen parity hypothesis for the a-boson. Pythia 8.186 was also used for the showering, hadronization, and underlying-event (UE) simulation with the A14 tune [62]. The mass of the a-boson was varied for different signal hypotheses in the range 20 GeV ≤ ma ≤ 60 GeV, in 10 GeV mass
steps.
Signal samples with long-lived a-bosons were generated with Madgraph5_aMC@NLO [63] at leading order (LO) using the NNPDF2.3LO [64] PDF set and showered with Pythia 8.186. The model used is the SM with an additional dark sector that includes a dark vector boson and a dark Higgs boson [9,
65, 66]. In this model, the dark Higgs boson, which plays the role of the a-boson, is a scalar under parity transformation and decays promptly. Therefore, the lifetimes of the a-bosons were replaced with values sampled randomly from an exponentially falling distribution with the desired mean value. Signal MC samples were produced for a-boson mean proper lifetimes of 0.1, 1, and 10 mm. Intermediate a-boson lifetimes can be obtained by reweighting these samples. The masses of the a-boson are 20, 30, and 60 GeV. The uneven spacing of a-boson masses is motivated by the fact that the signal kinematics (and therefore acceptance) change significantly between 20 and 30 GeV, but are quite similar from 30 to 60 GeV. The ATLAS fast detector simulation was used for samples of long-lived a-bosons, after verifying that it correctly reproduces the Geant 4-based simulation for the range of a-boson lifetimes under consideration.
The sample used to model the t ¯t background was generated using the Powheg v2 event generator [67], with the NNPDF3.0NLO PDF set. The Powheg model parameter hdamp, which controls matrix element (ME) to
parton shower (PS) matching and effectively regulates the high-pTradiation, was set to hdamp= 1.5mt[68].
The PS and the hadronization were modelled by Pythia 8.210 [69] with the A14 tune. The renormalization and factorization scales were set to the transverse mass of the top quark, defined as mT,t =
q m2
t + p2T,t,
where pT,t is the transverse momentum of the top quark in the t ¯t centre-of-mass reference frame. The t ¯t
sample is normalized to the next-to-next-to-leading-order (NNLO) theoretical cross-section of 832+46−51pb, obtained with Top++ 2.0 [70]. Alternative t ¯t samples used to derive systematic uncertainties are described in section7.
The simulated t ¯t events are categorized depending on the parton-level flavour content of particle jets3 not originating from the decay of the t ¯t system, using the procedure described in refs. [28,29]. Events containing at least one particle jet matched to a b-hadron are labelled as t ¯t + b ¯b. Events containing at least one particle jet matched to a c-hadron and no b-hadron are labelled as t ¯t + c ¯c. The t¯t + b¯b and t¯t + c ¯c categories are generically referred to as t ¯t+HF events (with HF standing for “heavy flavour”). Remaining events are labelled as t ¯t + light-jets (referred to as t ¯t + light) and also include events with no additional particle jets.
To model the dominant t ¯t + b ¯b background with the highest available precision, the relative contributions of the different heavy-flavour categories in the t ¯t sample described above are scaled to match the pre-dictions of an NLO t ¯t + b ¯b sample including parton showering and hadronization [71], generated with Sherpa+OpenLoops [56,72], using the procedure described in ref [29]. The sample was produced with Sherpa 2.2.1 and the CT10 four-flavour (4F) scheme PDF set [73,74]. The renormalization scale for this sample was chosen to be µR = Îi=t, ¯t,b, ¯bET,i1/4using the CMMPS prescription [71], while the factorization
3Particle jets are reconstructed by clustering stable particles, excluding muons and neutrinos, using the anti-k
talgorithm with a radius parameter R = 0.4.
scale is set to µF = 12
Í
i=t, ¯t,b, ¯bET,i. The resummation scale µQ, which sets an upper bound for the
hardness of the PS emissions, was also set to12Íi=t, ¯t,b, ¯bET,i.
The production of W and Z bosons in association with jets was simulated with Sherpa 2.2.1 [56] using the NNPDF3.0NNLO PDF set for both the ME calculation and the dedicated PS tuning developed by the Sherpa authors [75]. The ME calculation was performed with Comix [76] and OpenLoops [72], and was matched to the Sherpa PS using the MEPS@NLO prescription [77]. The MEs were calculated for up to two additional partons at NLO and for three and four partons at LO in QCD. The W /Z + jets samples are normalized to the NNLO cross-sections [78,79].
The diboson + jets samples were generated using Sherpa 2.1.1 as described in ref. [80]. Samples of t¯tW and t¯tZ (t¯tV) events were generated with an NLO ME using Madgraph5_aMC@NLO interfaced to Pythia 8.210 with the NNPDF3.0NLO PDF set and the A14 tune.
Samples of W t and s-channel single-top-quark backgrounds were generated with Powheg v1 at NLO accuracy using the CT10 PDF set. Overlap between the t ¯t and W t final states was resolved using the “diagram removal” scheme [81]. The t-channel single-top-quark events were generated using the Powheg v1 event generator at NLO accuracy with the CT10 4F scheme PDF set. For this process, top quarks were decayed using MadSpin. All single-top-quark samples were interfaced to Pythia 6.428 [82] with the Perugia 2012 tune [83]. The single-top quark t- and s-channel samples are normalized to the NLO theoretical cross-sections [84,85], while the W t channel is normalized to the approximate NNLO prediction [86,87].
Higgs boson production in association with a single top quark is a rare process in the SM, but is included in the analysis and is treated as a background. Samples of single top quarks produced in association with a W boson and a Higgs boson, tW H, were produced with Madgraph5_aMC@NLO interfaced to Herwig++[88] with the CTEQ6L1 PDF set. The other Higgs boson production modes are found to be
negligible and are not considered. The production of four top quarks (t ¯tt ¯t) as well as t ¯tWW events were generated with Madgraph5_aMC@NLO with LO accuracy and interfaced to Pythia 8.186. The t ZW production process was also generated with Madgraph5_aMC@NLO interfaced to Pythia 8.186, but at NLO accuracy.
In the single-lepton channel, the background from events with a jet or a photon misidentified as a lepton or with non-prompt leptons from hadron decays (hereafter referred to as a fake or non-prompt lepton) is estimated directly from data using a matrix method [89]. A data sample enhanced in fake and non-prompt leptons is selected by removing the lepton isolation requirements and, for electrons, loosening the identification criteria. The efficiency for these “loose” leptons to satisfy the nominal selection (“tight”) criteria is measured in data, separately for real prompt leptons and for fake or non-prompt leptons. For real prompt leptons, the efficiency is measured in Z boson events, while for fake and non-prompt leptons, it is estimated from events with low ETmissand low values of mWT .
The number of fake or non-prompt leptons satisfying the tight criteria can then be calculated by inverting the matrix defined by the two equations:
Nl = Nl
r+ Nfl, N
t = ε
rNrl+ εfNfl,
where Nl (Nt) is the number of events in data satisfying the loose (tight) lepton selection, Nrl (Nfl) is the number of events with a real prompt (fake or non-prompt) lepton in the loose lepton sample, and εr(εf) is the efficiency for these events to fulfil the tight lepton selection. By generalizing the resulting
providing a prediction for both the yields and the kinematic distributions of the fake and non-prompt lepton background.
When applying the matrix method in the case of high jet and b-tagged jet multiplicities, the number of events in data satisfying the loose and tight lepton selections is significantly reduced, leading to large fluctuations in the background predictions. In order to mitigate this problem, instead of tagging the jets by applying the b-tagging algorithm, their probabilities to be b-tagged are parameterized as a function of the jet pT. This allows all events in the sample before b-tagging is applied to be used in predicting
the normalization and shape of the background from fake or non-prompt leptons after b-tagging. The tagging probabilities are derived using an inclusive sample of fake or non-prompt leptons and the resulting predictions of this background estimate are in agreement with those obtained by applying the b-tagging algorithm and have greatly reduced statistical uncertainties.
In the dilepton channel, the background contribution from fake or non-prompt leptons is very small and is estimated from simulation and normalized to data in a control region with two same-charge leptons.
5 Event categorization
Events satisfying the object selection are categorized into analysis regions according to the number of leptons, jets and b-tagged jets. The regions enhanced in signal H → aa → 4b events relative to the backgrounds are referred to as signal regions (SRs). The other regions, referred to as control regions (CRs), are used to constrain the background predictions and related systematic uncertainties (see section 7) through a profile likelihood fit to the data (see section 8). The signal and backgrounds are derived consistently in the signal and control regions in a combined fit. The discrimination of signal from background is further enhanced in the signal regions by using multivariate techniques, as described in section6.
The H → aa → 4b decay chain is expected to have multiple b-tagged jets, often three or four, satisfying the object selection. The dominant background arises from t ¯t events in the single-lepton channel and Z + jets events in the dilepton channel, which can also have different jet and b-tagged jet multiplicities or leptons of different flavour in the case of the dilepton channel. The regions are referred to as (n``, njj, nbb) indicating n` leptons, nj selected jets and nb b-tagged jets. The SRs contain at least three b-tagged jets
and are (1`, 3j, 3b), (1`,4j, 3b) and (1`, 4j, 4b) for single-lepton events, and (2`, 3j, 3b), (2`, ≥4j, 3b) and (2`, ≥4j, ≥4b) for same-flavour dilepton events. The CRs are (1`, 3j, 2b), (1`, 4j, 2b), (1`, ≥5j, 3b) and (1`, ≥5j, ≥4b) for single-lepton events, (2`, ≥3j, 2b) for same-flavour dilepton events, and (2`, ≥3j, 3b) and (2`, ≥4j, ≥4b) for different-flavour dilepton events. The signal and control regions are summarized in figure2, indicating the main background sources probed in the CRs. Figure3summarizes the background composition in the signal and control regions.
In the single-lepton signal regions, background t ¯t events can only satisfy the selection criteria if accom-panied by additional b-tagged jets. The t ¯t + light background is dominant in the sample of events with exactly two or three b-tagged jets. The background processes t ¯t + c ¯c and t¯t + b¯b become more important as the jet and b-tagged-jet multiplicities increase. In particular, the t ¯t + b ¯b background dominates for events with ≥5 jets and ≥4 b-tagged jets. In the case of (1`, 3j, 3b) or (1`, 4j, 3b), the main sources of t¯t background are events with jets mistagged as b-tagged jets, particularly from W → cs decays, where the c-jet is misidentified, and from W → τν, where the τ-lepton decays hadronically and is likewise
SR SR SR
SR SR SR
CRW+ jets CRt¯t+ light CRt¯t+ light CRt¯t+b¯b
CRZ+ jets CRt¯t+c ¯c/b¯b CRt¯t+b¯b (≥5j, ≥4b) (4j, 4b) (≥5j, 3b) (4j, 3b) (3j, 3b) (≥5j, 2b) (4j, 2b) (3j, 2b) Single-lepton Dilepton same-flavor Dilepton different-flavor
Figure 2: Definition of the signal and control regions (SR and CR, respectively) in the single-lepton and dilepton channels. The main background component probed with the CR is indicated. The vertical axis shows the lepton selection, while the horizontal axis shows the jet and b-tagged jet multiplicities.
ATLAS = 13 TeV s Single lepton + light t t c + c t t b + b t t Other 1l, 3j, 2b (CR) 1l, 4j, 2b (CR) 1l, 3j, 3b (SR) 1l, 4j, 3b (SR) 1l, ≥5j, 3b (CR) 1l, 4j, 4b (SR) 4b (CR) ≥ 5j, ≥ 1l, (a) ATLAS = 13 TeV s Dilepton + light t t tt + cc b + b t t Z+jets Other 3j, 2b (CR) ≥ , -µ + µ / -e + e -, 3j, 3b (SR) µ + µ / -e + e -, ≥4j, 3b (SR) µ + µ / -e + e , 4j, 4b (SR) -µ + µ / -e + e e±µ, ± ≥3j, 3b (CR) e±µ, ± ≥4j, ≥4b (CR) (b)
Figure 3: Fractional contributions of the various backgrounds to the total background prediction in the (a) single-lepton and (b) disingle-lepton signal and control regions. The predictions for the various background contributions are obtained through the simulation and the data-driven estimates described in section4. The t ¯t background categories are also defined in section4.
mistagged. In the case of (1`, 4j, 4b), the t ¯t background includes more events with genuine b-quarks from gluon splitting to b ¯b pairs.
In the dilepton channel, the background is mainly composed of t ¯t and Z + jets events. In the case of the t¯t background, most events contain two prompt leptons from the leptonic decays of the two W bosons, and two b-jets from the top-quark decays. Additional jets arise from gluon splitting into b ¯b and c ¯c and from jets from initial-state radiation and pile-up. In each of these cases, the third and fourth b-tags in the event are from additional b-tagged jets, or from the mistag of additional c- or light-jets. In the samples with exactly three or four jets and exactly three b-tagged jets, the contributions of each of these sources is similar. In the case of the sample with exactly four jets and exactly four b-tagged jets, the contribution from events with real additional b-tagged jets, such as from gluon splitting into b ¯b, dominates.
In the case of the Z + jets background, the dominant contribution is from Z bosons produced in association with multiple heavy-flavour jets, for example from gluon splitting into b ¯b. In particular, for events with exactly three jets and three b-tagged jets or exactly four jets and four b-tagged jets, about half of the events are from Z + b ¯b with a mistagged light-flavoured jet and half are from Z + b¯bc with a mistagged c-jet. In the case of the events with exactly four jets and three b-tagged jets, approximately a third of the events are from Z + b ¯b with a mistagged light-flavoured jet, a third are from Z + b¯bc with a mistagged c-jet and a third are from Z + b ¯bb.
In the dilepton channel, the control regions are designed to be populated by the two main background processes: t ¯t and Z + jets. The control region with two same-flavour leptons, (2`, ≥3j, 2b), is populated by Z + jets and t ¯t + light. The control regions with two different-flavour leptons but with the same jet and b-tagged jet multiplicities as the signal regions, (2`, ≥3j, 3b) and (2`, ≥4j, ≥4b), are enhanced in t¯t + c ¯c and t ¯t + b ¯b processes.
6 Analysis strategy
In each of the six signal regions, a boosted decision tree (BDT) discriminant that combines information from several variables provides additional discrimination between signal and background. In the control regions, kinematic variables are used to provide additional discrimination between distinct sources of background. The distribution of HT, defined as the scalar sum of the pTof the jets, is used in the control
regions with two b-tagged jets, while the invariant mass of the b-tagged jets is used in the control regions with three or four b-tagged jets. A statistical analysis based on a binned likelihood function constructed as a product of Poisson probability terms over all regions and all bins considered in the search is used to derive the background predictions and uncertainties, and to test for the presence of signal. The statistical procedure and the results are described in section8.
The toolkit for multivariate analysis (TMVA) [90] is used to train the BDT discriminant. In the single-lepton channel, dedicated BDTs are trained to discriminate each of the signals with a-boson masses of 20, 30 and 50 GeV from t ¯t events. The discriminant trained at 50 GeV is found to have good sensitivity for the a-boson mass range 40–60 GeV. In the dilepton channel, dedicated BDTs are trained to discriminate each of the signals from both the t ¯t and Z + jets events. The discriminant trained at 30 GeV is found to have good sensitivity over the full mass range (20–60 GeV) for each of the signal regions.
The choice of inputs used in the BDT discriminants was based on the following considerations. Signal events are characterized by the presence of a resonance resulting from the Higgs boson decay H → aa → 4b. Several variables are used to reconstruct the particles from the signal decay chain. The first is the reconstructed invariant mass of the b-tagged jets, mbbb or mbbbb, defined for events with three or four b-tagged jets respectively, which peaks around the Higgs boson mass for signal events. In the case of three
b-tagged jets, the peak is due to events where two b-quarks are merged in a single jet or one of the b-quarks is very soft in an asymmetric decay and has a small impact on the kinematics. In the case of events with four b-tagged jets, the invariant masses of the two b-tagged jet pairs are discriminating variables between signal and background. The pairings are chosen to minimize the difference between the invariant masses of the b-tagged jet pairs, and are labelled mbb1and mbb2, such that mbb1> mbb2.
Additional kinematic variables exhibit differences between signal and background. In both channels, the average angular separation between b-tagged jets, referred to as average ∆R(b,b), is typically larger for background events where the b-tagged jets originate from the decays of different particles, such as the two top quarks in t ¯t events. In the single-lepton channel, several additional kinematic variables are included in the BDT discriminant. The HT variable is a measure of the total hadronic energy in the event, which
is typically larger for t ¯t than for W H events. The transverse momentum of the W boson, pWT , constructed from the vector sum of theE®Tmissand the lepton ®pT, is slightly higher for signal W H events, where the W
boson recoils against the Higgs boson, than for background t ¯t events.
Finally, two other variables are used to identify particles from the dominant t ¯t background decay chain in the single-lepton channel. The first variable is used in the (1`, 4j, 3b) channel to select t ¯t events with two b-tagged jets from the top-quark decays and a third b-tagged jet from a misidentified c- or light-jet from the hadronically decaying W boson. This variable is the invariant mass of two b-tagged jets (selected as the pair with the smallest ∆R separation) and the non-b-tagged jet, mbb j, which reconstructs the hadronically decaying top quark, peaking around the top-quark mass for these background events. The second variable is an mT2 observable, defined as the minimum “mother” particle mass compatible with all transverse
momenta and mass-shell constraints [91], that identifies events with several invisible particles. In the case of the t ¯t background events, in addition to the ETmiss from the neutrino from a leptonic W boson decay, invisible particles may arise from a τ-lepton decay or from a lost jet from a W boson. In these cases, mT2
has an endpoint at the top-quark mass, which is not the case for the signal.
For the dilepton channel, two variables are sensitive to the signal topology of a Z boson recoiling against a Higgs boson: the separation between the two leptons in the event, ∆R(`,`), and the separation between the Z boson, constructed from the two leptons, and the Higgs boson, constructed from the b-tagged jets, ∆R(Z,H). Another discriminating variable that carries information about the signal production mechanism is the cosine of the polar angle of the Higgs boson in the reference frame of the parent process Z∗→ZH, referred to as cos θ∗, which is sensitive to the spin of the parent particle. Finally, the ETmissvariable is used to discriminate against background t ¯t events that include the presence of multiple neutrinos.
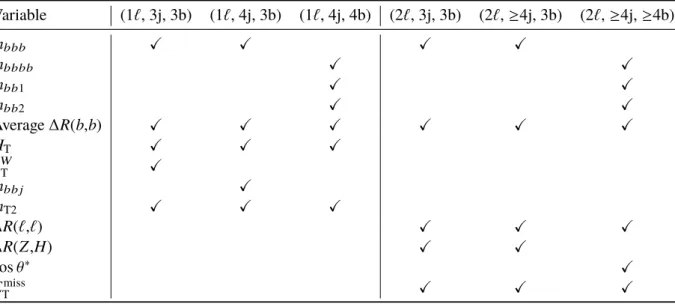
Table2summarizes the variables used to train each of the BDT discriminants for the six signal regions. Figures4and5show the expected distributions of the kinematical variables inclusively in number of jets and b-tagged jets. The jets with the largest values of the b-tagging discriminant are used to define the variables shown. The distributions are obtained “post-fit”, after accounting for the systematic uncertainties and applying the statistical procedure described in sections7and8, respectively.
Table 2: List of variables used to train the BDT multivariate discriminant for each signal region. Variable (1`, 3j, 3b) (1`, 4j, 3b) (1`, 4j, 4b) (2`, 3j, 3b) (2`, ≥4j, 3b) (2`, ≥4j, ≥4b) mbbb X X X X mbbbb X X mbb1 X X mbb2 X X Average ∆R(b,b) X X X X X X HT X X X pW T X mbb j X mT2 X X X ∆R(`,`) X X X ∆R(Z,H) X X cos θ∗ X Emiss T X X X
7 Systematic uncertainties
Many sources of systematic uncertainties affect this search, including those related to the integrated luminosity, to the reconstruction and identification of leptons and jets, and to the modelling of signal and background processes. Some uncertainties affect only the overall normalization of the samples, while others also impact the shapes of the distributions used to categorize events and build the final discriminants.
A single nuisance parameter is assigned to each source of systematic uncertainty, as described in section8. Some of the systematic uncertainties, in particular most of the experimental uncertainties, are decomposed into several independent sources, as specified in the following. Each individual source then has a correlated effect across all channels, analysis categories, signal and background samples. For modelling uncertainties, especially the t ¯t and Z + jets modelling, additional nuisance parameters are included to split some uncertainties into several sources affecting different subcomponents of a particular process independently.
The uncertainty of the combined integrated luminosity for 2015 and 2016 is 2.1%. It is determined using a methodology similar to that detailed in ref. [35]. Uncertainties in the modelling of pile-up are also estimated, and cover the differences between the predicted and measured inelastic cross-sections [92].
Uncertainties associated with leptons arise from the trigger, reconstruction, identification, and isolation efficiencies, as well as the momentum scale and resolution. These are measured in data using leptons in Z → `+`−
, J/ψ → `+`−and W → eν events [38,39] and have only a small impact on the result.
Uncertainties associated with jets arise from their reconstruction and identification efficiencies. These are due to the uncertainty in the jet energy scale (JES), resolution and the efficiency of the JVT requirement that is meant to remove jets from pile-up. The JES and its uncertainty are derived by combining information from test-beam data, LHC collision data and simulation [43]. Additional uncertainties are also considered, associated with the jet flavour and pile-up corrections. The total per-jet uncertainties are 1–6%, although the effects are amplified by the large number of jets in the final state.
0 100 200 300 400 500 [GeV] bbb m 0.75 0.875 1 1.125 Data / Pred. 0 100 200 300 400 500 3 10 × Events / 80 GeV ATLAS -1 = 13 TeV, 36.1 fb s 2 b-tags ≥ 3 jets, ≥ 1 lepton, = 60 GeV a 4b, m → aa → H Data 750) × WH ( + light t t c + c t t b + b t t Other (a) 0 100 200 300 400 500 [GeV] bbbb m 0.75 0.875 1 1.125 Data / Pred. 0 50 100 150 200 250 3 10 × Events / 80 GeV ATLAS -1 = 13 TeV, 36.1 fb s 2 b-tags ≥ 4 jets, ≥ 1 lepton, = 60 GeV a 4b, m → aa → H Data 1000) × WH ( + light t t c + c t t b + b t t Other (b) 0 0.5 1 1.5 2 2.5 3 3.5 4 4.5 5 R(b,b) ∆ Average 0.75 0.875 1 1.125 Data / Pred. 0 50 100 150 200 250 300 350 3 10 × Events ATLAS -1 = 13 TeV, 36.1 fb s 2 b-tags ≥ 3 jets, ≥ 1 lepton, = 60 GeV a 4b, m → aa → H Data 1000) × WH ( + light t t c + c t t b + b t t Other (c) 100 200 300 400 500 600 [GeV] T H 0.75 0.875 1 1.125 Data / Pred. 0 20 40 60 80 100 120 140 160 180 200 3 10 × Events / 25 GeV ATLAS -1 = 13 TeV, 36.1 fb s 2 b-tags ≥ 3 jets, ≥ 1 lepton, = 60 GeV a 4b, m → aa → H Data 750) × WH ( + light t t c + c t t b + b t t Other (d) 0 50 100 150 200 250 300 [GeV] W T p 0.75 0.875 1 1.125 Data / Pred. 0 50 100 150 200 250 300 350 400 3 10 × Events / 30 GeV ATLAS -1 = 13 TeV, 36.1 fb s 2 b-tags ≥ 3 jets, ≥ 1 lepton, = 60 GeV a 4b, m → aa → H Data 1000) × WH ( + light t t c + c t t b + b t t Other (e) 50 100 150 200 250 300 350 400 450 500 [GeV] bbj m 0.75 0.875 1 1.125 Data / Pred. 0 20 40 60 80 100 120 140 160 3 10 × Events / 20 GeV ATLAS -1 = 13 TeV, 36.1 fb s 2 b-tags ≥ 4 jets, ≥ 1 lepton, = 60 GeV a 4b, m → aa → H Data 1000) × WH ( + light t t c + c t t b + b t t Other (f)
Figure 4: Comparison of data with the post-fit background estimates for (a) mbbb, (b) mbbbb, (c) average ∆R(b,b), (d) HT, (e) pWT and (f) mbb jin the single-lepton sample inclusive in number of jets and b-tagged jets. Comparisons
use events with ≥ 3 jets, except when ≥ 4 jets are necessary to define the variable, in which case events with ≥ 4 jets are used. Distributions for the signal model (W H, H → aa → 4b), with ma = 60 GeV, normalized to the SM
pp → WH cross-section, assuming B(H → aa → 4b) = 1 and scaled by a factor as indicated in the figure, are overlaid. The hashed area represents the total uncertainty in the background. The last bin contains the overflow.
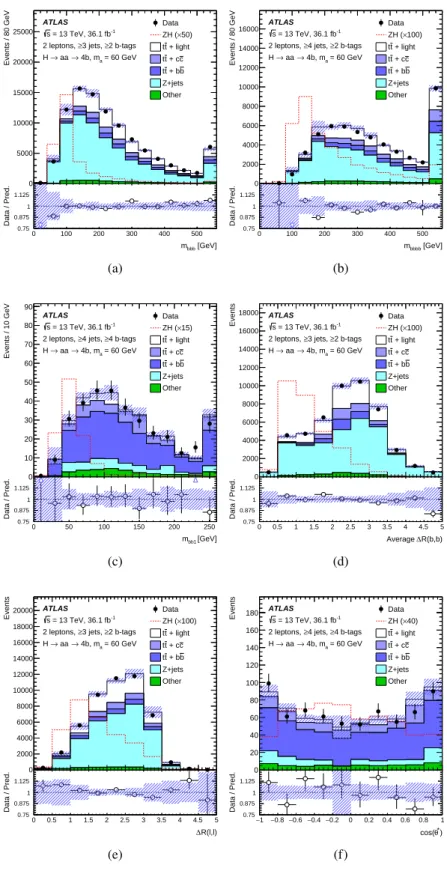
0 100 200 300 400 500 [GeV] bbb m 0.75 0.875 1 1.125 Data / Pred. 0 5000 10000 15000 20000 25000 Events / 80 GeV ATLAS -1 = 13 TeV, 36.1 fb s 2 b-tags ≥ 3 jets, ≥ 2 leptons, = 60 GeV a 4b, m → aa → H Data 50) × ZH ( + light t t c + c t t b + b t t Z+jets Other (a) 0 100 200 300 400 500 [GeV] bbbb m 0.75 0.875 1 1.125 Data / Pred. 0 2000 4000 6000 8000 10000 12000 14000 16000 Events / 80 GeV ATLAS -1 = 13 TeV, 36.1 fb s 2 b-tags ≥ 4 jets, ≥ 2 leptons, = 60 GeV a 4b, m → aa → H Data 100) × ZH ( + light t t c + c t t b + b t t Z+jets Other (b) 0 50 100 150 200 250 [GeV] bb1 m 0.75 0.875 1 1.125 Data / Pred. 0 10 20 30 40 50 60 70 80 90 Events / 10 GeV ATLAS -1 = 13 TeV, 36.1 fb s 4 b-tags ≥ 4 jets, ≥ 2 leptons, = 60 GeV a 4b, m → aa → H Data 15) × ZH ( + light t t c + c t t b + b t t Z+jets Other (c) 0 0.5 1 1.5 2 2.5 3 3.5 4 4.5 5 R(b,b) ∆ Average 0.75 0.875 1 1.125 Data / Pred. 0 2000 4000 6000 8000 10000 12000 14000 16000 18000 Events ATLAS -1 = 13 TeV, 36.1 fb s 2 b-tags ≥ 3 jets, ≥ 2 leptons, = 60 GeV a 4b, m → aa → H Data 100) × ZH ( + light t t c + c t t b + b t t Z+jets Other (d) 0 0.5 1 1.5 2 2.5 3 3.5 4 4.5 5 R(l,l) ∆ 0.75 0.875 1 1.125 Data / Pred. 0 2000 4000 6000 8000 10000 12000 14000 16000 18000 20000 Events ATLAS -1 = 13 TeV, 36.1 fb s 2 b-tags ≥ 3 jets, ≥ 2 leptons, = 60 GeV a 4b, m → aa → H Data 100) × ZH ( + light t t c + c t t b + b t t Z+jets Other (e) 1 − −0.8−0.6 −0.4 −0.2 0 0.2 0.4 0.6 0.8 1 ) * θ cos( 0.75 0.875 1 1.125 Data / Pred. 0 20 40 60 80 100 120 140 160 180 Events ATLAS -1 = 13 TeV, 36.1 fb s 4 b-tags ≥ 4 jets, ≥ 2 leptons, = 60 GeV a 4b, m → aa → H Data 40) × ZH ( + light t t c + c t t b + b t t Z+jets Other (f)
Figure 5: Comparison of data with the post-fit background estimates for (a) mbbb, (b) mbbbb, (c) mbb1, (d) average ∆R(b,b), (e) ∆R(`,`) and (f) cos θ∗in the dilepton sample inclusive in number of jets and b-tagged jets. Comparisons use events with ≥ 3 jets, except when ≥ 4 jets are necessary to define the variable, in which case events with ≥ 4 jets are used. Distributions for the signal model (Z H, H → aa → 4b), with ma = 60 GeV, normalized to the SM
pp → ZH cross-section, assuming B(H → aa → 4b) = 1 and scaled by a factor as indicated in the figure, are overlaid. The hashed area represents the total uncertainty in the background. The last bin contains the overflow.
The efficiency to correctly tag b-jets is measured in data using dilepton t ¯t events [93]. The mistag rate for c-jets is measured in events with W bosons decays into q ¯q. For light jets, it is measured in multi-jet events using jets containing secondary vertices and tracks with impact parameters consistent with a negative lifetime [46]. The uncertainty associated with the b-tagging efficiency ranges between 2% and 10% depending on the jet pT. The size of the uncertainties associated with the mistag rates is 5–20% for c-jets
depending on the jet pTand 10–50% for light jets depending on the jet pTand η.
For the long-lived a-boson signals, the secondary vertices of b-jets are, on average, further displaced from the primary vertex than those of b-jets from t ¯t events. An additional “displaced b-tagging” systematic uncertainty is applied to long-lived signal samples to account for a displacement-dependent mismodelling of the b-tagging efficiency. The uncertainty is determined using the “adjusted MC” method [94], which was originally developed for the calibration of the mistag rate for light-flavour jets. The resulting uncertainty increases approximately linearly with the a-boson proper lifetime, from ∼ 2% for prompt a-bosons to ∼ 10% for proper lifetimes of 10 mm. It is applied in addition to the standard b-tagging uncertainties. Uncertainties associated with energy scales and resolutions of leptons and jets are propagated to ETmiss. An uncertainty in the contribution from charged-particle tracks not associated with reconstructed leptons and jets is also included in the ETmissuncertainty [48].
Several sources of systematic uncertainty affecting the modelling of the main backgrounds, t ¯t and Z + jets are considered. For the t ¯t background, the procedure closely follows that described in ref. [28]. An uncertainty of 6% is assumed for the t ¯t production cross-section [70], including contributions from variations of the factorization and renormalization scales, and uncertainties arising from the PDFs, αS,
and the top-quark mass.
Systematic uncertainties affecting the shape of the t ¯t background account for the choice of generator, the choice of PS and hadronization models, and the effects of initial- and final-state radiation. The uncertainties are derived from comparisons between the nominal simulation (Powheg+Pythia) and alternative samples produced with Sherpa+OpenLoops (varying the NLO event generator, PS and hadronization models) or Powheg+Herwig 7 [95] (varying only the PS and hadronization models).
Additional uncertainties are evaluated to account for the use of Sherpa+OpenLoops NLO to model the t¯t+ b¯b and t¯t + c ¯c backgrounds. Uncertainties are also assessed for the choice of scheme to treat massive quarks and the choice of PDF sets, as well as the choice of shower recoil model and scale. Uncertainties are also included to account for differences in the relative contributions of the t ¯t + b ¯b, t¯t + c ¯c and t¯t+ light processes. All uncertainties are treated as uncorrelated across the t¯t flavour components. The normalization of the t ¯t + b ¯b process is included as an independent free-floating factor, while the t¯t + c ¯c component is assigned a 50% normalization uncertainty, derived from studies of alternative background samples [29].
In the case of the W + jets and Z + jets backgrounds, all normalizations are included as independent free-floating factors. In the case of the Z + jets background in the dilepton channel, a separate normalization factor is considered for each jet and b-tagged jet multiplicity bin: (2`, ≥3j, 2b), (2`, 3j, 3b), (2`, ≥4j, 3b) and (2`, ≥4j, ≥4b). Additional assigned uncertainties are based on variations of the factorization and renormalization scales and of the matching parameters in the Sherpa simulation.
A cross-section uncertainty of+5%−4% is assigned to the three single-top-quark production modes [86, 96,
97]. For the W t and t-channel production modes, uncertainties associated with the choice of PS and hadronization model and with initial- and final-state radiation are evaluated by using a set of alternative samples. The uncertainty in modelling of the interference between W t and t ¯t production at NLO is
assessed by comparing the default simulation to an alternative one that resolves the interference at the cross-section level (“diagram subtraction” scheme) instead of the amplitude level (“diagram removal” scheme) [81].
A 50% normalization uncertainty in the diboson background is assumed, which includes uncertainties in the inclusive cross-section and the production of additional jets [80]. The uncertainties in the t ¯tW and t ¯tZ NLO cross-section predictions are 13% and 12%, respectively [66,98], due to PDF and scale uncertainties, and are treated as uncorrelated between the two processes. An additional modelling uncertainty for t ¯tW and t ¯tZ , related to the choice of event generator, PS and hadronization models, is derived from comparisons of the nominal samples with alternative ones generated with Sherpa.
In the single-lepton channel, uncertainties in the estimation of the background with fake or non-prompt leptons come from the limited number of events in the data sample without the lepton isolation requirement and from uncertainties in the measured non-prompt and prompt lepton efficiencies. The normalization uncertainty assigned to this background is 50%, as derived by comparing the background prediction with data in control regions obtained by inverting the requirements on ETmiss and on mWT . An uncertainty in the shape of the predicted background distribution covers the difference between the prediction obtained using an inclusive sample before b-tagging is applied and the prediction after b-tagging. In the dilepton channel, the simulated non-prompt lepton background is assigned a 25% uncertainty, correlated across lepton flavours and all analysis categories.
Several sources of systematic uncertainty affect the theoretical modelling of the signal. Uncertainties originate from the choice of PDFs, the factorization and renormalization scales, and the PS, hadronization and UE models.
8 Results
The distributions of the discriminant for each of the analysis categories are combined in a profile likelihood fit to test for the presence of signal, while simultaneously determining the normalizations and constraining the differential distributions of the most important background components. As described in section6, in the signal regions, the output of the BDT classifier is used as the discriminant, while HT or the invariant
mass of the b-jets is used in the control regions.
The likelihood function, L(µ, θ), is constructed as a product of Poisson probability terms over all bins in each distribution. The Poisson probability depends on the predicted number of events in each bin, which in turn is a function of the signal-strength parameter µ = σ × B(H → aa → 4b), where σ are the pp → W H and Z H cross-sections. The nuisance parameters, θ, encode the effects of systematic uncertainties. The nuisance parameters are implemented in the likelihood function as Gaussian, log-normal or Poisson priors. The statistical uncertainty of the prediction, which incorporates the statistical uncertainty of the simulated events and of the data-driven fake and non-prompt lepton background estimate, is included in the likelihood as a nuisance parameter for each bin.
The likelihood function depends on six free-floating normalization factors for t ¯t+ b ¯b, Z +jets for the four jet and b-tagged jet multiplicities and W + jets. No prior knowledge from theory or subsidiary measurements is assumed for the normalization factors, hence they are only constrained by the profile likelihood fit to the data. As shown in table 3, the normalization factors are compatible with SM expectations within the uncertainties. The other main background components, particularly t ¯t + light and t ¯t + c ¯c, are also compatible with SM expectations within the uncertainties described in section7. In the combination of
the single-lepton and dilepton channels, the ratio of W H to Z H cross-sections is assumed to follow the SM prediction.
Table 3: Normalization factors included as independent free-floating factors in the likelihood fit. The uncertainties include statistical and systematic components.
Normalization factor
Sample Single-lepton Dilepton Combination
t¯t+ b¯b 1.5 ± 0.5 0.9 ± 0.3 1.1 ± 0.3 W + jets 0.7 ± 0.3 – 0.7 ± 0.3 Z + jets (2`, ≥3j, 2b) – 1.0 ± 0.1 1.1 ± 0.1 Z + jets (2`, 3j, 3b) – 1.2 ± 0.2 1.1 ± 0.2 Z + jets (2`, ≥4j, 3b) – 1.1 ± 0.2 1.1 ± 0.1 Z + jets (2`, ≥4j, ≥4b) – 1.4 ± 0.5 1.4 ± 0.5
The test statistic tµ is defined as the profile likelihood ratio: tµ = −2 ln(L(µ, ˆˆθµ)/L( ˆµ, ˆθ)), where ˆµ and ˆ
θ are the values of the parameters which maximize the likelihood function, and ˆˆθµare the values of the nuisance parameters which maximize the likelihood function for a given value of µ. This test statistic is used to measure the probability that the observed data is compatible with the signal+background hypothesis, and to perform statistical inferences about µ, such as upper limits using the CLsmethod [99–
101]. The uncertainty of the best-fit value of the signal strength, ˆµ, is obtained when varying tµ by one unit.
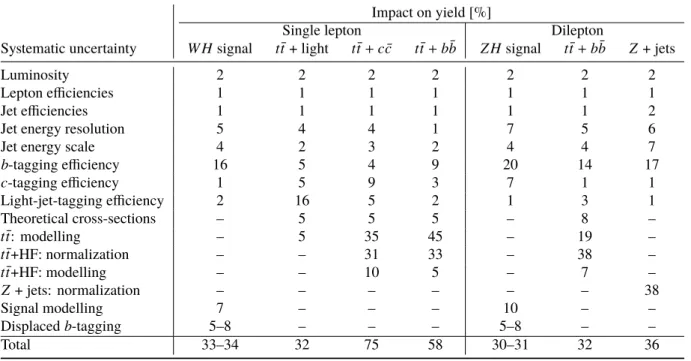
After performing the fit, the leading sources of systematic uncertainty are the modelling of the t ¯t and Z + jets backgrounds and the b-, c- and light-jet-tagging efficiencies. Table4summarizes the main systematic uncertainties by indicating their impact on the normalization of the main backgrounds and the signal ( ˆµ) with ma= 60 GeV in the most sensitive signal regions (1`, 4j, 4b) and (2`, ≥4j, ≥4b). The uncertainties in the normalization are obtained by varying the parameter corresponding to the source of uncertainty under consideration up and down by one standard deviation, while keeping the other nuisance parameters fixed at their central value.
Figures6and7show the distributions in the control regions of the single-lepton and dilepton channels, respectively, after performing the likelihood fit of these distributions to data assuming µ = 0. The fit produces better agreement between the data and the background predictions, and it reduces the uncertainties as a result of the nuisance-parameter constraints and the correlations generated by the fit. Figure8shows the post-fit background distributions for the signal regions of the dilepton and single-lepton channels. Table5compares the observed event yield with the SM background prediction in each signal region, as well as the expected number of signal events for a few representative values of ma. The overall acceptance times efficiency for signal is approximately 0.2% and 0.4% for the signal regions (1`, 4j, 4b) and (2`, ≥4j, ≥4b), respectively.
No significant deviations from the SM predictions are found and upper limits are set on σ × B(H → aa → 4b) for a mass hypothesis ma tested in steps of 10 GeV between 20 and 60 GeV, as shown in figure9. The observed (expected) upper limits on µ for the single-lepton channel range from 2.9 (2.4) pb, for ma = 20 GeV, to 1.6 (0.94) pb, for ma = 60 GeV. For the dilepton channel they range from 1.6 (1.2) pb,
for ma= 20 GeV, to 0.54 (0.39) pb for ma = 60 GeV. For comparison, the SM NNLO cross-sections for
pp → WH and ZH are σSM(WH)= 1.37 pb and σSM(ZH)= 0.88 pb, respectively [102]. Upper limits
0 50 100 150 200 250 300 350 400 [GeV] T H 0.75 0.875 1 1.125 Data / Pred. 0 20 40 60 80 100 120 140 160 180 200 220 3 10 × Events / 80 GeV ATLAS -1 = 13 TeV, 36.1 fb s
1 lepton, 3 jets, 2 b-tags
Data + light t t c + c t t b + b t t Other (a) 0 50 100 150 200 250 300 350 400 [GeV] T H 0.75 0.875 1 1.125 Data / Pred. 0 50 100 150 200 250 300 3 10 × Events / 80 GeV ATLAS -1 = 13 TeV, 36.1 fb s
1 lepton, 4 jets, 2 b-tags
Data + light t t c + c t t b + b t t Other (b) 0 100 200 300 400 500 600 [GeV] bbb m 0.75 0.875 1 1.125 Data / Pred. 0 10000 20000 30000 40000 50000 60000 Events / 100 GeV ATLAS -1 = 13 TeV, 36.1 fb s 5 jets, 3 b-tags ≥ 1 lepton, Data + light t t c + c t t b + b t t Other (c) 0 100 200 300 400 500 600 700 800 [GeV] bbbb m 0.75 0.875 1 1.125 Data / Pred. 0 2000 4000 6000 8000 10000 Events / 200 GeV ATLAS -1 = 13 TeV, 36.1 fb s 4 b-tags ≥ 5 jets, ≥ 1 lepton, Data + light t t c + c t t b + b t t Other (d)
Figure 6: Comparison between data and prediction in the single-lepton control regions of the HTvariable for (a)
(1`, 3j, 2b) and (b) (1`, 4j, 2b) and the invariant mass of b-tagged jets for (c) (1`, ≥5j, 3b) and (d) (1`, ≥5j, ≥4b), after the combined single-lepton and dilepton fit to the data. The last bin contains the overflow.
Table 4: Summary of the impact of the considered systematic uncertainties (in %) on the yields for the main backgrounds and the signal (ma= 60 GeV) for the single-lepton and dilepton regions (1`, 4j, 4b) and (2`, ≥4j, ≥4b) after the fit. The total uncertainty can differ from the sum in quadrature of individual sources due to correlations.
Impact on yield [%]
Single lepton Dilepton
Systematic uncertainty WH signal t¯t + light t¯t+ c ¯c t¯t+ b¯b ZH signal t¯t+ b¯b Z + jets
Luminosity 2 2 2 2 2 2 2
Lepton efficiencies 1 1 1 1 1 1 1
Jet efficiencies 1 1 1 1 1 1 2
Jet energy resolution 5 4 4 1 7 5 6
Jet energy scale 4 2 3 2 4 4 7
b-tagging efficiency 16 5 4 9 20 14 17 c-tagging efficiency 1 5 9 3 7 1 1 Light-jet-tagging efficiency 2 16 5 2 1 3 1 Theoretical cross-sections – 5 5 5 – 8 – t¯t: modelling – 5 35 45 – 19 – t¯t+HF: normalization – – 31 33 – 38 – t¯t+HF: modelling – – 10 5 – 7 – Z + jets: normalization – – – – – – 38 Signal modelling 7 – – – 10 – – Displaced b-tagging 5–8 – – – 5–8 – – Total 33–34 32 75 58 30–31 32 36 0 100 200 300 400 500 600 700 800 900 1000 [GeV] T H 0.75 0.875 1 1.125 Data / Pred. 0 2000 4000 6000 8000 10000 12000 14000 16000 Events / 80 GeV ATLAS -1 = 13 TeV, 36.1 fb s 3 jets, 2 b-tags ≥ , -µ + µ / -e + e Data + light t t c + c t t b + b t t Z+jets Other (a) 0 100 200 300 400 500 600 [GeV] bbb m 0.75 0.875 1 1.125 Data / Pred. 0 500 1000 1500 2000 2500 3000 3500 Events / 100 GeV ATLAS -1 = 13 TeV, 36.1 fb s 3 jets, 3 b-tags ≥ , ± µ ± e Data + light t t c + c t t b + b t t Other (b) 0 100 200 300 400 500 600 [GeV] bbbb m 0.75 0.875 1 1.125 Data / Pred. 0 50 100 150 200 250 Events / 100 GeV ATLAS -1 = 13 TeV, 36.1 fb s 4 b-tags ≥ 4 jets, ≥ , ± µ ± e Data + light t t c + c t t b + b t t Other (c)
Figure 7: Comparison between data and prediction in the dilepton control regions of (a) the HTvariable for
same-flavour dilepton events with (2`, 3j, 2b) and the invariant mass of b-tagged jets for different-same-flavour dilepton events with (b) (2`, ≥3j, 3b) and (c) (2`, ≥4j, ≥4b), after the combined single-lepton and dilepton fit to the data. The last bin contains the overflow.
1 − −0.8−0.6 −0.4 −0.2 0 0.2 0.4 0.6 0.8 1 = 50 GeV) a BDT (3j, 3b, m 0 0.5 1 1.5 Data / Pred. 10 2 10 3 10 4 10 5 10 6 10 Events ATLAS -1 = 13 TeV, 36.1 fb s
1 lepton, 3 jets, 3 b-tags = 60 GeV a 4b, m → aa → H Data WH + light t t c + c t t b + b t t Other (a) 1 − −0.8−0.6 −0.4 −0.2 0 0.2 0.4 0.6 0.8 1 = 30 GeV) a BDT (3j, 3b, m 0.75 0.875 1 1.125 Data / Pred. 1 10 2 10 3 10 4 10 5 10 Events ATLAS -1 = 13 TeV, 36.1 fb s , 3 jets, 3 b-tags -µ + µ / -e + e = 60 GeV a 4b, m → aa → H Data ZH + light t t c + c t t b + b t t Z+jets Other (b) 1 − −0.8−0.6 −0.4 −0.2 0 0.2 0.4 0.6 0.8 1 = 50 GeV) a BDT (4j, 3b, m 0.75 0.875 1 1.125 Data / Pred. 3 10 4 10 5 10 6 10 Events ATLAS -1 = 13 TeV, 36.1 fb s
1 lepton, 4 jets, 3 b-tags = 60 GeV a 4b, m → aa → H Data WH + light t t c + c t t b + b t t Other (c) 1 − −0.8−0.6 −0.4 −0.2 0 0.2 0.4 0.6 0.8 1 = 30 GeV) a BDT (4j, 3b, m 0.75 0.875 1 1.125 Data / Pred. 1 10 2 10 3 10 4 10 5 10 Events ATLAS -1 = 13 TeV, 36.1 fb s 4 jets, 3 b-tags ≥ , -µ + µ / -e + e = 60 GeV a 4b, m → aa → H Data ZH + light t t c + c t t b + b t t Z+jets Other (d) 1 − −0.8−0.6 −0.4 −0.2 0 0.2 0.4 0.6 0.8 1 = 50 GeV) a BDT (4j, 4b, m 0.5 0.75 1 1.25 Data / Pred. 1 10 2 10 3 10 4 10 5 10 6 10 Events ATLAS -1 = 13 TeV, 36.1 fb s
1 lepton, 4 jets, 4 b-tags = 60 GeV a 4b, m → aa → H Data WH + light t t c + c t t b + b t t Other (e) 1 − −0.8−0.6 −0.4 −0.2 0 0.2 0.4 0.6 0.8 1 = 30 GeV) a BDT (4j, 4b, m 0.25 0.625 1 1.375 Data / Pred. 2 − 10 1 − 10 1 10 2 10 3 10 4 10 5 10 Events ATLAS -1 = 13 TeV, 36.1 fb s , 4 jets, 4 b-tags -µ + µ / -e + e = 60 GeV a 4b, m → aa → H Data ZH + light t t c + c t t b + b t t Z+jets Other (f)
Figure 8: Comparison between data and prediction for the BDT discriminants in the (left) single-lepton signal regions trained with a signal with ma= 50 GeV: (a) (1`, 3j, 3b), (c) (1`, 4j, 3b) and (e) (1`, 4j, 4b) and in the (right)
same-flavour dilepton signal regions trained with a signal with ma = 30 GeV: (b) (2`, 3j, 3b), (d) (2`, ≥4j, 3b) and
(f) (2`, ≥4j, ≥4b), after performing the combined single-lepton and dilepton fit of the predictions in all SRs and CRs to the data. The signal yield (solid red) is normalized to ˆµ after the fit for a signal with ma = 60 GeV.
Table 5: Expected event yields of the post-fit background estimates and observed data in three signal regions for the single-lepton and dilepton channels after the combined single-lepton and dilepton fit to the data. The expected number of signal events for a few representative values of ma are indicated, assuming the SM pp → W H and Z H cross-sections, σSM(WH) = 1.37 pb and σSM(ZH) = 0.88 pb [102], respectively, and B(H → aa → 4b) = 1.
The uncertainties include statistical and systematic components. The total uncertainty can differ from the sum in quadrature of individual sources due to correlations.
Process (1`, 3j, 3b) (1`, 4j, 3b) (1`, 4j, 4b) (2`, 3j, 3b) (2`, ≥4j, 3b) (2`, ≥4j, ≥4b) t¯t+ light 9040 ± 490 25600 ± 1300 469 ± 76 65 ± 25 161 ± 48 5 ± 4 t¯t+ c ¯c 1240 ± 570 4500 ± 1500 240 ± 100 60 ± 32 165 ± 66 6 ± 6 t¯t+ b¯b 1470 ± 690 4900 ± 1100 580 ± 150 41 ± 16 137 ± 43 30 ± 9 t¯t + γ/W/Z 18 ± 2 88 ± 7 16 ± 2 1.2 ± 0.4 45 ± 6 7 ± 1 Z + jets 137 ± 75 205 ± 67 8 ± 6 483 ± 42 1123 ± 73 91 ± 17 W + jets 1400 ± 380 1550 ± 490 53 ± 20 - -
-Single top quark 1360 ± 160 2210 ± 320 57 ± 31 4 ± 2 10 ± 3 1 ± 1
Dibosons - - - 12 ± 7 45 ± 22 1 ± 1 Fakes 860 ± 280 1130 ± 370 68 ± 20 3 ± 1 8 ± 2 0.3 ± 0.1 Total 15520 ± 470 40190 ± 880 1485 ± 88 670 ± 31 1693 ± 60 140 ± 12 Data 15428 40045 1488 670 1689 140 H → aa → 4b WH ZH ma= 60 GeV 103 ± 24 100 ± 21 27 ± 9 28 ± 6 55 ± 10 12 ± 4 ma= 40 GeV 120 ± 25 100 ± 19 24 ± 7 32 ± 7 55 ± 10 11 ± 3 ma= 20 GeV 65 ± 15 52 ± 11 9 ± 3 18 ± 4 25 ± 5 4 ± 1
to Z H cross-sections follows the SM prediction. The observed (expected) 95% CL upper limits on µ range from 3.0 (2.2) pb, for ma = 20 GeV, to 1.3 (0.74) pb, for ma = 60 GeV. The combined result excludes
branching ratios as low as 0.45 in the mass range mabetween about 25 GeV and 60 GeV, assuming the SM WH and ZH cross-sections. The reduced sensitivity for the lighter a-boson hypotheses, where it is not possible to set limits on the branching ratio, is due to a lower acceptance caused by overlapping b-jets.
Lifetime-dependent 95% CL upper limits on the cross-section times B(H → aa → 4b) for the combination of single-lepton and dilepton channels are shown in figure10. For a-boson mean proper lifetimes up to ∼ 0.5 mm, the increased displacement of the b-jets leads to an enhanced b-tagging efficiency, and the limits improve slightly. For longer a-boson lifetimes, the b-jets become sufficiently displaced such that the jet reconstruction and b-tagging efficiencies are diminished and the limits decrease rapidly.
[GeV] a m 20 30 40 50 60 4b) [pb] → aa → B(H × WH σ 95% CL upper limits on 0 1 2 3 4 5 6 7 Observed 95% CL σ 1 ± Expected 95% CL σ 2 ± Expected 95% CL WH) → (pp SM σ ATLAS s = 13 TeV, 36.1 fb-1 Single-lepton (a) [GeV] a m 20 30 40 50 60 4b) [pb] → aa → B(H × ZH σ 95% CL upper limits on 0 0.5 1 1.5 2 2.5 3 Observed 95% CL σ 1 ± Expected 95% CL σ 2 ± Expected 95% CL ZH) → (pp SM σ ATLAS s = 13 TeV, 36.1 fb-1 Dilepton (b) [GeV] a m 20 30 40 50 60 4b) [pb] → aa → B(H × VH σ 95% CL upper limits on 0 1 2 3 4 5 6 7 Observed 95% CL σ 1 ± Expected 95% CL σ 2 ± Expected 95% CL VH) → (pp SM σ ATLAS s = 13 TeV, 36.1 fb-1 Combined
Figure 9: Summary of the 95% CL upper limits on σ × B(H → aa → 4b) for (a) the single-lepton channel and (b) the dilepton channel, and (c) the combination of both channels. The observed limits are shown, together with the expected limits (dotted black lines). In the case of the expected limits, one- and two-standard-deviation uncertainty bands are also displayed.
[mm] a τ c 1 − 10 1 4b) [pb] → aa → B(H × VH σ 95% CL upper limits on 0 1 2 3 4 5 ATLAS -1 = 13 TeV, 36.1 fb s Prompt = 20 GeV a m = 60 GeV a m VH) → (pp SM σ Observed Expected
Figure 10: Summary of the expected and observed combined 95% CL upper limits on σ × B(H → aa → 4b) with prompt and long-lived a-bosons. Expected (observed) limits for prompt a-bosons are shown as empty (filled) circles. Expected (observed) limits for long-lived signals are shown as dashed (solid) lines for two signal scenarios: ma= 20 and 60 GeV.
9 Conclusion
This paper presents a search for exotic decays of the Higgs boson into a pair of spin-zero particles, H → aa, where the a-boson decays into two b-quarks. The search focuses on processes in which the Higgs boson is produced in association with a W or Z boson that decays leptonically. The analysis uses the pp collision dataset at
√
s = 13 TeV recorded by the ATLAS detector at the LHC in 2015 and 2016, corresponding to an integrated luminosity of 36.1 ± 0.8 fb−1. The search for H → aa → 4b is performed in the mass range 20 GeV ≤ ma ≤ 60 GeV, considering prompt as well as long-lived a-bosons with mean proper lifetimes
cτaup to 6 mm. The analysis uses several kinematic variables combined in a multivariate discriminant in signal regions and uses control regions to reduce uncertainties in the background estimates. No significant excess of data is observed relative to the SM predictions. Upper limits at 95% CL are derived for the WH and ZH production cross-section times branching ratio of the decay H → aa → 4b. The combined observed upper limit for promptly decaying a-bosons ranges from 3.0 pb for ma = 20 GeV to 1.3 pb
for ma = 60 GeV, assuming that the ratio of WH to ZH cross-sections follows the SM prediction. For
a-bosons with longer proper lifetimes, the best limits are 1.8 pb and 0.68 pb, for ma= 20 GeV and 60 GeV
Acknowledgements
We thank CERN for the very successful operation of the LHC, as well as the support staff from our institutions without whom ATLAS could not be operated efficiently.
We acknowledge the support of ANPCyT, Argentina; YerPhI, Armenia; ARC, Australia; BMWFW and FWF, Austria; ANAS, Azerbaijan; SSTC, Belarus; CNPq and FAPESP, Brazil; NSERC, NRC and CFI, Canada; CERN; CONICYT, Chile; CAS, MOST and NSFC, China; COLCIENCIAS, Colombia; MSMT CR, MPO CR and VSC CR, Czech Republic; DNRF and DNSRC, Denmark; IN2P3-CNRS, CEA-DRF/IRFU, France; SRNSFG, Georgia; BMBF, HGF, and MPG, Germany; GSRT, Greece; RGC, Hong Kong SAR, China; ISF, I-CORE and Benoziyo Center, Israel; INFN, Italy; MEXT and JSPS, Japan; CNRST, Morocco; NWO, Netherlands; RCN, Norway; MNiSW and NCN, Poland; FCT, Portugal; MNE/IFA, Romania; MES of Russia and NRC KI, Russian Federation; JINR; MESTD, Serbia; MSSR, Slovakia; ARRS and MIZŠ, Slovenia; DST/NRF, South Africa; MINECO, Spain; SRC and Wallenberg Foundation, Sweden; SERI, SNSF and Cantons of Bern and Geneva, Switzerland; MOST, Taiwan; TAEK, Turkey; STFC, United Kingdom; DOE and NSF, United States of America. In addition, individual groups and members have received support from BCKDF, the Canada Council, CANARIE, CRC, Compute Canada, FQRNT, and the Ontario Innovation Trust, Canada; EPLANET, ERC, ERDF, FP7, Horizon 2020 and Marie Skłodowska-Curie Actions, European Union; Investissements d’Avenir Labex and Idex, ANR, Région Auvergne and Fondation Partager le Savoir, France; DFG and AvH Foundation, Germany; Herakleitos, Thales and Aristeia programmes co-financed by EU-ESF and the Greek NSRF; BSF, GIF and Minerva, Israel; BRF, Norway; CERCA Programme Generalitat de Catalunya, Generalitat Valenciana, Spain; the Royal Society and Leverhulme Trust, United Kingdom.
The crucial computing support from all WLCG partners is acknowledged gratefully, in particular from CERN, the ATLAS Tier-1 facilities at TRIUMF (Canada), NDGF (Denmark, Norway, Sweden), CC-IN2P3 (France), KIT/GridKA (Germany), INFN-CNAF (Italy), NL-T1 (Netherlands), PIC (Spain), ASGC (Taiwan), RAL (UK) and BNL (USA), the Tier-2 facilities worldwide and large non-WLCG resource providers. Major contributors of computing resources are listed in Ref. [103].
References
[1] ATLAS Collaboration, Observation of a new particle in the search for the Standard Model Higgs
boson with the ATLAS detector at the LHC,Phys. Lett. B 716 (2012) 1,
arXiv:1207.7214 [hep-ex]. [2] CMS Collaboration,
Observation of a new boson at a mass of 125 GeV with the CMS experiment at the LHC,
Phys. Lett. B 716 (2012) 30, arXiv:1207.7235 [hep-ex].
[3] ATLAS Collaboration, Measurements of the Higgs boson production and decay rates and
coupling strengths using pp collision data at√s= 7 and 8 TeV in the ATLAS experiment,
Eur. Phys. J. C 76 (2016) 6, arXiv:1507.04548 [hep-ex]. [4] CMS Collaboration,
Precise determination of the mass of the Higgs boson and tests of compatibility of its couplings with the standard model predictions using proton collisions at 7 and 8 TeV,
Eur. Phys. J. C 75 (2015) 212, arXiv:1412.8662 [hep-ex]. [5] ATLAS and CMS Collaborations,
Measurements of the Higgs boson production and decay rates and constraints on its couplings
from a combined ATLAS and CMS analysis of the LHCpp collision data at√s= 7 and 8 TeV,
JHEP 08 (2016) 045, arXiv:1606.02266 [hep-ex].
[6] M. J. Strassler and K. M. Zurek, Echoes of a hidden valley at hadron colliders,
Phys. Lett. B 651 (2007) 374, arXiv:hep-ph/0604261 [hep-ph].
[7] R. M. Schabinger and J. D. Wells, Minimal spontaneously broken hidden sector and its impact
on Higgs boson physics at the CERN Large Hadron Collider,Phys. Rev. D 72 (2005) 093007,
arXiv:hep-ph/0509209 [hep-ph].
[8] B. Patt and F. Wilczek, Higgs-field Portal into Hidden Sectors, (2006), arXiv:hep-ph/0605188 [hep-ph].
[9] D. Curtin et al., Exotic Decays of the 125 GeV Higgs Boson,Phys. Rev. D 90 (2014) 075004, arXiv:1312.4992 [hep-ph].
[10] B. A. Dobrescu and K. T. Matchev,
Light axion within the next-to-minimal supersymmetric standard model,JHEP 09 (2000) 031,
arXiv:hep-ph/0008192.
[11] U. Ellwanger, J. F. Gunion, C. Hugonie and S. Moretti,
Towards a No-Lose Theorem for NMSSM Higgs Discovery at the LHC, (2003),
arXiv:hep-ph/0305109.
[12] R. Dermisek and J. F. Gunion, Escaping the Large Fine-Tuning and Little Hierarchy Problems in
the Next to Minimal Supersymmetric Model and h —> aa Decays,
Phys. Rev. Lett. 95 (2005) 041801, arXiv:hep-ph/0502105.
[13] S. Chang, R. Dermisek, J. F. Gunion and N. Weiner, Nonstandard Higgs Boson Decays,
Ann. Rev. Nucl. Part. Sci. 58 (2008) 75, arXiv:0801.4554 [hep-ph].
[14] D. E. Morrissey and A. Pierce, Modified Higgs boson phenomenology from gauge or gaugino
mediation in the next-to-minimal supersymmetric standard model,