Development and
Application of Laser
Hologram Production
Techniques for the Teaching
of Physics and the Public
Awareness of Science
José Caiongo Chibaca
Mestrado em Física (especialização em Física Experimental)
Departamento de Física e Astronomia, FCUP 2018/2019
Orientador: Helder Manuel Paiva Rebelo Cerejo Crespo, Prof. Auxiliar, DFA-FCUP
Todas as correções determinadas pelo júri, e só essas, foram efetuadas. O Presidente do Júri,
3 Agradecimentos
Antes de tudo um profundo agradecimento ao meu orientador, Professor Helder Crespo, por todo o apoio prestado durante a realização desse trabalho com toda a sua dedicação, por um artigo publicado, pela promoção da minha participação em eventos internacionais de Física e por me ter desafiado com um tema que em muito vai ajudar para a iniciação ao ensino de Física aplicada e para o ensino de Ótica e Fotónica na minha Instituição em particular e no meu país em geral.
Um grande agradecimento ao Miguel Miranda e em especial ao Miguel Noronha da Canhota "Mike" e Ana Sofia Silva por todo o apoio prestado e as dificuldades que me foram tirando ao longo deste trabalho. Queria dizer-vos também que vocês foram para mim uma família e que apesar da minha timidez tudo fizeram para que eu me pudesse sentir à vontade no vosso seio.
Agradeço também ao Diretor do Curso Prof. Augusto Rodrigues e à sua comissão científica por me terem aceite no Mestrado em Física nesta grande faculdade pois o sonho escrito na minha carta de motivação na altura da minha candidatura foi realizado.
Aos meus professores de licenciatura Makengo Ndala (por tudo que fizeste para que eu pudesse vir para Portugal estudar Física) e Nsakala Simon Pierre (por sempre me ter apoiado em cada viagem a Portugal) aqui vão os meus sinceros agradecimentos.
Ao meu amigo Dalne Antonio, obrigado pelos momentos partilhados, pelos teus conselhos, pelo teu apoio material e pela preocupação que sempre tiveste em me ver terminar este curso. Também ao meu amigo Nigeriano “Babatunde Akinsanmi” pelo teu apoio e suporte em Inglês.
Agradeço bastante à minha família: André Mendoça (por todo o apoio moral e material ao longo desta jornada), Guilherme Chibaca, Nené Mucuta Vieira, Vieira Muteteleno, Benvinda Chibaca, Florinda Chibaca, Chibuabua Chibaca, Hélder Jorge, Anita Mandjolo, Maiquena Jorge, e Joãozito Muquepe por todo apoio que me foram prestando mesmo estando longe de vocês e em particular a minha mãe Uissa Chaquenha Muianze pelas noites e dias de orações que perdeste para torceres por mim.
Finalmente, um especialíssimo agradecimento à minha esposa Nfilu Maria Kinkani Manuel por todo o apoio e motivação prestada e principalmente quando me disseste que não me querias ver reprovar novamente em nenhuma disciplina e por tudo que suportaste durante a minha ausência, e aos meus filhos Elizandro Maquiquena Lukombo Chibaca e Glorieth Sofia André Chibaca por conseguirem entender os motivos da minha ausência durante a minha formação de mestrado em Física.
4 Abstract (in English)
Holography is a set of techniques by which coherent light (laser light) is used to capture the phase and amplitude characteristics of light from a three-dimensional object on a two-dimensional photographic plate. Both diffraction and interference of light are directly behind its remarkable characteristics. The main objectives of this work followed two major lines: i) the development of experimental approaches for hologram production using simple and inexpensive setups, and ii) the production of holograms effectively capable of illustrating important optical instruments, physical principles and/or effects. This is for the purpose of engaging students in the study of Physics, and to reinforce the yet modest presence of optical physics (including interferometry) and modern physics in undergraduate physics courses in Angola. Here we present experimental results in hologram production obtained with a versatile setup based on a single-frequency diode-pumped solid-state laser. Even though the experimental work was performed using advanced optical and optomechanical components within a laboratory setting, we see this approach as a necessary step for the understanding and efficient application of holographic techniques, prior to developing new, simpler and less expensive setups. In this thesis, we also highlight a set of published works on applied holography that show how interference and diffraction phenomena are vital to many fields of applied physics, and how holography can be applied in different areas of science, technology and industry.
Keywords: Holography, hologram production techniques, optics, interferometry, teaching of physics
5 Resumo (em Português)
A Holografia é um conjunto de técnicas pelas quais a luz coerente (luz laser) é usada para capturar as características de fase e amplitude da luz proveniente de um objeto tridimensional em uma chapa fotográfica bidimensional. Tanto a difração quanto a interferência da luz estão por detrás das características notáveis da holografia. Os principais objetivos deste trabalho orientam-se segundo duas linhas principais: i) o desenvolvimento de abordagens experimentais para a produção de hologramas usando configurações simples e de baixo custo e ii) a produção de hologramas efetivamente capazes de ilustrar importantes princípios físicos, efeitos ou instrumentos óticos. Isto tem como propósito envolver os estudantes no estudo da Física e reforçar a presença da física ótica (incluindo a interferometria) e da física moderna nos cursos de graduação em Física em Angola. Apresentamos resultados experimentais de produção de hologramas obtidos com uma configuração versátil baseada num laser de estado sólido com uma única frequência bombeado por díodos. Embora o trabalho experimental tenha sido realizado com componentes óticos e oto-mecânicos avançados e num laboratório de ótica, consideramos esta abordagem importante para uma aprendizagem e aplicação eficientes das técnicas holográficas, antes de pensar no desenvolvimento de métodos novos, mais simples e menos dispendiosos. Nesta tese destacamos ainda um conjunto de trabalhos publicados na área da holografia aplicada que mostram como os fenómenos de interferência e difração são vitais em muitos campos da Física e Engenharia e em como a holografia pode ser aplicada em diferentes áreas da ciência, tecnologia e indústria.
Palavras-chave: Holografia, técnicas de produção de hologramas, ótica, interferometria, ensino da física.
6
Contents ... 6
1. Introduction ... 8
1.1. Motivation and objectives... 8
1.2. State of the art ... 9
1.3. Structure of this thesis ...11
2. Holography: a brief description and brief historical perspective ...12
2.1. What are Holograms? How to produce them? And what is holography? ...12
2.2. A brief historical perspective ...15
2.3. Some applications of Holography: a brief description ...18
2.3.2. Holography and optical communications ...20
2.3.3. Holography in scientific research and science teaching ...20
3. The Physics behind Holography...23
3.1. Interference of light waves ...23
3.2. Visibility and polarization influence ...25
3.3. Holographic recording and reconstruction ...26
3.3.1. Recording and reconstruction ...26
3.3.2. Mathematical description of holographic recording and reconstruction ...27
3.3.2.1. Object and reference wave ...27
3.3.2.2. Recording ...28
3.3.2.3. Gratings ...29
3.3.2.4. Reconstruction ...29
3.4. Volume hologram ...30
3.5. Conjugated Object Wave ...32
3.5.1. Position of the conjugated image ...33
3.5.2. Reversal of the reconstruction wave ...33
4. Experimental production of holograms ...35
4.1. Laser sources and their characteristics ...35
7
4.3. Production and replay of transmission holograms ...37
4.4. Production and replay of reflection holograms ...38
4.4.1. Single-beam reflection hologram ...38
4.4.2. Holographic magnifying glass and holographic mirror ...40
4.4.2.1. Production and replay of a magnifying glass hologram and of a holographic mirror 41 4.4.3. Double exposure holographic Interferometry ...46
5. Holography in the context of Physics teaching ...49
5.1. Holography as a pedagogical tool for the teaching of Physics ...49
5.2. Pedagogical implications of Holography ...50
6. Conclusion and perspective ...51
8 1. Introduction
1.1. Motivation and objectives
Along my academic journey at FCUP I had trouble in understanding all the subjects I studied due to my background in Physics and sometimes I was surprised by those subjects. When I started understanding the subjects then I felt a challenge to help my home faculty and my country in things that could help in the teaching of applied Physics and research in this area. When visiting Femtolab, I had the chance to view the hologram of Prof. Marcelo Rebelo de Sousa made by Prof. Helder Crespo. I was very surprised and was asking myself: what is a hologram and how can we make it? While looking for a subject for my master’s thesis in physics, and to my good surprise, my supervisor suggested me to work in the production of holograms for pedagogical purposes in the context of physics and physics teaching and I accepted this challenge. Holography has a strong impact on viewers in showing a three-dimensional image of an object. The question is: what gives rise to that three-dimensional image obtained from a two-dimensional glass plate or film?
The interaction of light and matter has a wide range of applications in science and technology, where several important optical effects play a key role. In particular, interference and diffraction phenomena can result whenever two or more light beams are superimposed, or when light is diffracted by an object. There are many experiments that can be performed to explain the phenomenon and the consequences of the interaction of light with matter. These range from simple to more complex experiments about the behavior of matter when it interacts with radiation, such as in optical tweezers, x-ray diffraction and in many more techniques and phenomena. The practicality of these experiments in Angola is almost impossible in view of the high cost of purchasing the required equipment, the lack of qualified instructors and the reduced interest by managers of higher education institutions, who have to struggle with many different issues. Presently, what students learn in optics courses is often just the reflection and refraction of light, and this usually does not go beyond obtaining images using lenses and mirrors with simple, incoherent sources.
The objective here is to explore the phenomena of interference and diffraction of laser light by making holograms capable of illustrating important physics principles and effects in the context of teaching of applied physics to undergraduate physics students in Angola. This includes illustrations on how to make several high-precision measurements in physics and engineering, such as mechanical deformations or displacements, using optical techniques. For this work, we defined two major lines: i) the development of experimental approaches for hologram production using, whenever possible, simple and inexpensive
9
setups, and ii) the production of holograms effectively capable of illustrating important optical instruments, physical principles and/or effects.
1.2. State of the art
Since the invention of holography by Dennis Gabor in 1947 [1] (for which he was awarded the Nobel Prize in Physics in 1971) and with the invention of the laser by Maiman in 1960, several new holographic techniques and applications have been devised and others are still being developed today. These range from scientific research to technological applications, such as medical imaging techniques, and also in the field of education as well as in art and/or public engagement [2], where a hologram is also seen as a way of communicating science and technology.
In the beginning of holography, as Gabor said of his invention, its main purpose was to improve optical or electronic microscopy. By recording a hologram using X-rays and playing it back using, e.g., visible radiation, the resulting magnification (given by the ratio between visible and X-ray wavelengths) would make fine details of an object visible. This invention gave rise to other fields of holography employing different techniques with different purposes depending on a particular application. Besides optical holography, also called classical holography, a new enhanced technique is also employed today where holograms are computer generated, which has become most promising in the field of applied holography.
The invention of the laser and its advances gave rise to a new way of seeing holography and led to the development of different types of laser sources for holographic applications with both continuous and pulsed lasers. Optical holography is already being applied as a security measure in important documents [3] playing a leading role in the authenticity and fidelity of information contained in such documents.
Three-dimensional (3D) display technologies are one of the most promising for the introduction of undergraduate students to basic optics courses [4] and as an art medium, where computer-generated hologram (CGH) technologies are also used. CGH is considered to be the next generation of 3D display technology [5], [6] and is considered the best solution satisfying all types of depth cues (full-parallax) among all 3D display technologies. It may represent the future of technology and communications that may affect dramatically many fields, including business, education, telecommunications and healthcare [7].
Holography is also a very effective tool for the teaching of different areas of science, from physics to life sciences, again due to its capability of reproducing 3D images [8].
10
Various uses of holography have been suggested by different authors for application in the field of education, from physics outreach and as a teaching tool for holography itself [9], [10], in optical image processing classes [11], in optics courses in general [12] and for math contents [13], providing a wide range of possibilities for solidifying the knowledge of middle and high schools students [14] while introducing the basic concepts of optics and photonics. Optical Holography is the most used technique for the teaching of physics and/or public engagement because it helps understand the physics of interference of coherent light and is a very motivating tool for the teaching of applied optics. It opens valuable discussions about several subjects of daily life due to the strong impact that holograms have on a public audience. For this purpose, a color device for color holography was developed by Vaslion & Escarguel (2012) which was used by Salançon & Escarguel (2019) as an upgrade of their pedagogic tool for monochromatic holography for demonstrations or for science outreach purposes which can be used just as effectively in outdoor popular science events as in higher level physics teaching [15]. The monochromatic device is based on reflection holograms produced with a helium-neon laser of approximately 0.8 mW of output power emitting at 632.8 nm. This kit differs from standard holographic systems/setups because it does not require an appropriate/specific room for the exposure or development procedure nor a vibration-isolated optical table, and it is portable. On the other hand, it still needs adequate obscurity conditions, a power source for the laser and access to water for the hologram development.
For predicting the behaviour of diffraction gratings, which have many applications in science and technology, a model described by Olson (2013) [16] as a “simple, complete, and novel quantitative model of holography for students of science and science education” was developed that also allows understanding the principles behind wave interference.
Years & Peña (2000) [17] included holography as a tool for the teaching of optics, where they considered three key themes:
➢ Light radiation. Origin and main features; ➢ Radiation overlapping. Hologram recording;
➢ Light propagation in matter. Hologram reconstruction.
In the present work, we highlight how holography has been used to teach science, in particular in the teaching of physics contents at different levels, where firstly we show briefly its progress from Gabor’s invention to its application in the field of education, with the purpose of showing the current state of holography and its advantage in different areas of science and technology compared to more traditional techniques.
11 1.3. Structure of this thesis
This master’s thesis in physics is structured in six chapters, as described below: ➢ In the first chapter we present our motivation for this master’s project in physics and
we highlight the main objectives along two major lines that guided all the project as well as the current state-of-the art in the field;
➢ In the second chapter we define what is holography and a hologram and describe briefly a historical background of holography since its invention by Gabor in 1947 to the present day, where we also highlight some advances made in this area after the invention of the laser. Some important applications of holography in different areas of science and technology and in the field of education are also described;
➢ In the third chapter we describe fundamental physics principles and mathematical tools in which holographic principles are based as well as different types of holograms. In this chapter we also describe how holograms are recorded and reconstructed;
➢ The fourth chapter was dedicated to the production of holograms following Gabor’s and Denisyuk’s principles. Experimental details regarding the laser source as well as all optical components used to produce holograms are described and including detailed images of all experimental setups depicting the corresponding geometric configurations as well as images of the obtained holograms;
➢ In the fifth chapter we show how holography has been used as a pedagogical tool in the teaching of physics, highlighting some work of different authors and the impact of holography in the teaching of physics, engineering, maths, and science and technology in general.
➢ Finally, in the sixth chapter, we summarize our results, expectations and future work within the scope of this master’s thesis.
12
2. Holography: a brief description and brief historical perspective
2.1. What are Holograms? How to produce them? And what is holography?
In general, a hologram is a thin flat piece of film or glass [18], or two-dimensional (2-D) surface, that can produce a three-dimensional image of a three-dimensional object when illuminated by light [19]. It is a recording of the interaction of two mutually coherent light beams, in the form of a microscopic pattern of interference fringes [20]. Holography is the set of techniques that can be used to produce holograms. For optical hologram recording of a 3D object, a laser is usually necessary, due to its spatial and temporal coherence properties. In practice, the basic condition for producing a hologram is to superimpose and record, in a holographic emulsion, the light coming from the object illuminated by a laser (the object beam), together with another beam of light coming directly from the same laser (the so-called reference beam). The reference beam and the object beam interfere with each other on a high-resolution photographic emulsion (also called a holographic emulsion), usually coated in glass or film, where the corresponding interference pattern is recorded [19] , [21]. The resulting hologram enables reconstructing a 3-D image of the object since the interference pattern encodes phase information of the light reflected by the object [22]. The obtained record, called a hologram, contains all the luminous information of the object and therefore, when properly illuminated, produces an image in every way similar to the original object. The complete wavefront of an object is recorded and subsequently reconstructed in the absence of the original wavefront and the observation of this reconstructed wavefront will give the same physical effect as the observation of the original wavefront., i.e., a 3D image is observed just as if the object was still present and being illuminated in the same way as when the holographic recording was made [23].
Besides a laser source, which is a key element in holographic recording, there are other essential optical components for the complete optical setup for hologram production. Note that, unlike in photography, no lens is used between the holographic object and the holographic film. The hologram is usually recorded using a single exposure, and the laser must be the only source of light, as shown in figure 2.1. After the light exposure (which can last from a few seconds to several minutes, depending on laser power, object and plate size, and emulsion grain size and sensitivity), the film is developed by a special process. The permanent recording thus obtained is the hologram, which, when illuminated solely by the reference beam, produces a complete three-dimensional image of the object, even in the absence of the latter.
13
Figure 2.1: Multi-beam setup for recording a laser transmission hologram. In this case, two beams are used to illuminate the object from two sides. Note that in this configuration both the light from the object and the reference beams impinge on the same side of the holographic plate (adapted from [24]).
A crucial aspect for the realization of the hologram is the stability of all optical components used in the setup [25], including the object itself: if any of the elements move or vibrate during exposure, even for a fraction of a thousandth of a millimetre, the holographic recording can be completely destroyed.
Note that holography is not limited to the production of holograms for scientific or even artistic purposes, where the form and color of real or virtual objects are artistically or figuratively exploited. There are two major types of holography: analog and digital holography. Analog holography is performed using real reference and object beams. An example of a large analog hologram produced in Porto and used for public awareness of science is shown in Fig. 2.2. Digital holography involves simulating the interference of light using a computer, calculating the corresponding interference pattern, and performing laser optical recording, point by point (or voxel by voxel, where voxel stands for volume pixel), of the resulting hologram. It is usually used for producing diffractive optical elements (DOEs) and binary optics [26], but can also be used to produce full-color holograms of non-existing 3D objects. Several companies already provide digital holograms on demand, for scientific,
14
technical, artistic or commercial purposes (e.g., Ultimate Holography in France, or Geola, in Lithuania).
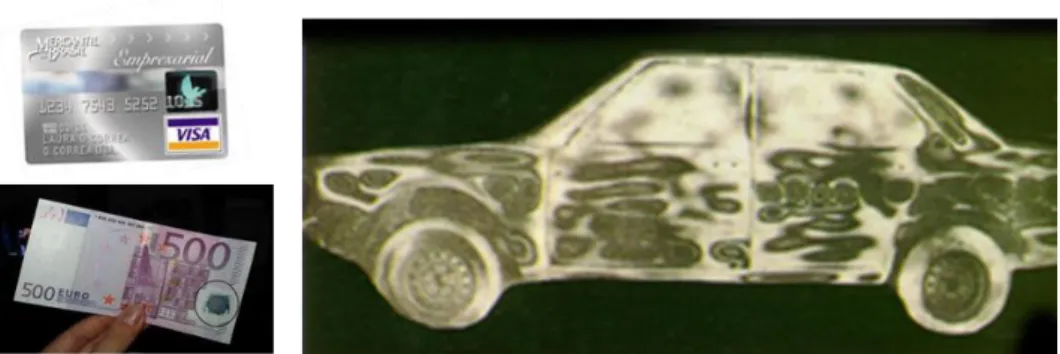
Holograms nowadays have many and varied practical applications [27], [28], [29]. They are, for example, used as a security element in documents - credit cards, euro banknotes and football tickets, quality control (e.g. measurement of small deformations), among others (see Fig. 2.3) - and are also the basis for new and promising optical technologies for high-density data storage.
Figure 2.2: Image of the large hologram (holographic plate of 40x60 cm and image depth of more than 7 meters) produced by the IFIMUP team for the Fantaslux hologram exhibition organized by IFIMUP within the Fantasporto 2012 film festival. The composition of objects is allusive to the celebration of the 30th anniversary of Ridley Scott’s “Blade Runner”, as well as to the city of Porto (image courtesy of IFIMUP).
Figure 2.3: Holograms used as security elements in documents - credit cards, banknotes and in quality control. (e.g. measurement of small deformations in the automobile industry).
15 2.2. A brief historical perspective
The theoretical principles underlying holography could, indeed, have been formulated as early as in 1816, the year that Auguste Fresnel described mathematically Thomas Young’s early theory of diffraction and interference [20]. In 1856, Scott Archer discovered how to produce a light-sensitive material coated on glass. So it would at that time have been just possible to make a single-beam reflection hologram of a shallow object using a narrow bandwidth light source such as a gas-discharge lamp.
The employment of Bragg interference planes [30] for the production of color photographic images was exploited by Gabriel Lippmann in the 1890s (Nobel Prize in Physics 1908), and he also showed how Fourier analysis could be applied to imagery. But holography dates from 1947 when British (native of Hungary) scientist Dennis Gabor developed the theory of holography while working to improve the resolution of an electron microscope [31] introducing “a new microscopic principle” [32] which enabled to record the amplitude and phase of an object wave in a holographic plate - Gabor coined the term hologram from the Greek words holos, meaning "whole," and gramma, meaning "message" [33] and, in 1971, Gabor was awarded the Nobel Prize in Physics “for his invention and development of the holographic method”. The Gabor technique is in-line holography and consists in using nearly collinear reference and object beams in the direction perpendicular to the holographic plate (figure 2.4). This technique has been used to measure particles in large volumes giving wide depth of field relatively to conventional imaging systems [34]. On the other hand, due to symmetry reasons, two images are generated when the wavefront is reconstructed. An example of this occurs in emission electron as well as in x-ray and gamma-ray holography, where the source-to-object distances are small, and the reconstructed images of atoms are very close to their twin images from which they can hardly be distinguished [35]. The problem related with the overlapped spurious real image was due to the lack of sufficiently coherent light, and the spatial overlap with the virtual image compromised the viewing of the replayed wave front.
After the invention of the laser in 1960, Leith and Upatnieks [20], [36], [37] at the University of Michigan solved the problem of the spurious real image that occurs when using Gabor’s original inline setup, by displacing the reference beam so that the unwanted image was moved out of line. When this off-axis beam (figure 2.1 is also an example of off-axis geometry) is used to replay the hologram, the unwanted image is conveniently displaced by an angle equal to twice the angle between the reference and object beams.
16
Figure 2.4: A conceptual image of the inline holography imaging setup (from [34]).
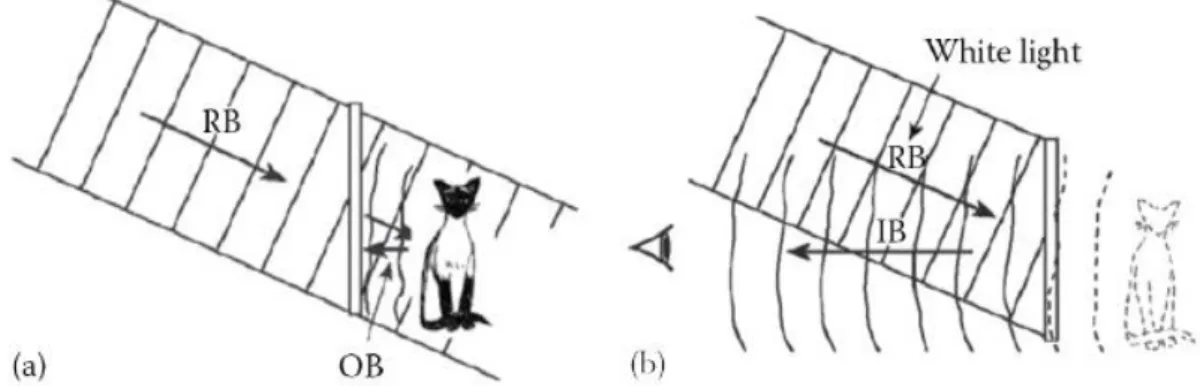
In the Soviet Union, Yuri Denisyuk was experimenting with an optical configuration that was radically different from Gabor´s. In his arrangement, the reference and object beams were incident on the emulsion from opposite directions, as shown in figure 2.5.
Figure 2.5: Principle of the Denisyuk (single-beam reflection) hologram. (a) In making this type of hologram, the reference beam (RB) passes through the emulsion and illuminates the object to form the object beam (OB), which is incident on the emulsion on the side opposite to the reference beam. (b) The hologram is replayed by a reconstruction beam (RB) using the same optical path as the original reference beam, incident from the viewing side; the image beam (IB) is diffracted from the hologram (from [20]).
In 1959, Denisyuk had succeeded in producing holograms that could be replayed using a point source of white light. Due to the Bragg condition, this type of hologram and other types of reflection hologram do not have to be replayed by laser light and, when the hologram is replayed by white light, it reflects only light with wavelength approximately close
17
to the wavelength used for recording as the other wavelengths interfere and are transmitted due to destructive interference [38]. For his first hologram, Denisyuk used a high-pressure mercury lamp source which produced sufficiently coherent light for recording a hologram of a very shallow object placed on the opposite side of the plate, which enabled the image to be viewed from the front whereas Leith and Upatniek’s configurations [39], [20] required a monochromatic replay beam set up behind the hologram. In 1962, Denisyuk’s work was published in the Journal of the Optical Society of America and in 1963, Leith and Upatnieks were producing the first laser transmission holograms [40]. Figure 2.6 summarizes the recording and reconstruction geometries of Gabor, Denisyuk and Leith/Upatnieks holograms.
Figure 2.6: A model of wavefront recording and reconstruction illustrating the Gabor, Denisyuk and Leith/Upatnieks hologram recording geometries (from [41]).
Digital holography began years after Gabor’s invention in 1947 and different techniques were being developed by many researchers in order to generate holograms using computational methods and it give another way of viewing holography as it does not necessarily require the use of a laser for optical recording and reconstruction [42].
The formation of the hologram itself can be calculated on a computer, which gives the complex field distribution to be stored as a hologram [43]. Digital holography is an important technique for studying biological cells and 3D pictures and movies have been made using this technique [44]. With the improvement of laser light sources, optical elements, and the production of high-resolution silver halide holographic plates and other holographic recording media, the quality of holographic images has significantly improved [45].
18
Several researchers have put significant efforts in holography. One of them is Hans Bjelkhagen who since 1968 is still working on holography for applied science and technology, artistic holography and for medicine and industry. His first work in holography as a student was at the Royal Institute of Technology in Stockholm, Sweden. A detailed historical text about his efforts devoted to holography research can be found in the proceedings of the recent 11th international symposium on display holography – ISDH 2018, which took place in Aveiro, Portugal [46].
2.3. Some applications of Holography: a brief description
Since the invention of holography, various techniques for application of high-quality three-dimensional imagery have been explored and applied to different areas of science, technology, art and in education. Leith and Upatnieks [47] are some of the pioneers in advancing applied holography. In their paper entitled “Holograms: their properties and uses” they described some areas in which holographic principles could be applied. Nowadays, holography has a wide range of applications and is considered one of the most promising techniques for goggle-free 3D visualization in the near future [48]. This stems from the ideas in digital holography [49] initially proposed by Goodman and Lawrence [50] where images were reconstructed with the aid of computations from a digitized Fourier hologram [51], that was electronically detected by a video camera [50] from an optically recorded hologram; its fundamental theory was conceived by Yaroslavskii and Merzlyakov in 1980 [48].
Besides DH and optical holography there is also another type of holography - Computer Generated Holography (CGH) first proposed by Brown and Lohmann in 1966 [52], [53]. It allows the generation of holograms with the aid of sophisticated mathematical manipulations of an object that does not physically exist but can be described in mathematical terms. CGH refers to the family of techniques that generate a hologram from virtual objects using mathematical manipulations and then reconstruct the image optically using classic laser illumination methods [39], [48]. Regardless of their type, - holograms are sometimes used to engage the public in science and technology due to their 3D capability, which has a strong visual impact on viewers [54].
2.3.1. Holography and information technology
The field of information technology is one area of interest in applied holography ranging from information storage [55], to communication theory, as well as optical information processing [56].
Concerning the information storage, the associative storage (figure 2.7) is a basic property of holography where either (object or reference) of the original beams can illuminate the hologram to reconstruct the other [56], where the resolution of the recording
19
medium provides significant advantages, yielding for example many superimposed holograms in the same volume, and enabling its use in switching and optical networks [56].
Figure 2.7. Diagram demonstrating associative storage property of holographic storage using the Fourier-transform method (from [56], [51]).
These properties can be understood in the following way: the hologram with the sought-after information, is placed in the common focal plane of the lenses [51]; the basic equation of holography for the intensity distribution I within a hologram
𝐼 = |𝑟|2+ |𝑜|2+ 𝑟𝑜∗+ 𝑟∗𝑜 (1.1)
remains unchanged when exchanging the object wave o and the reference wave r. When illuminating the hologram with the object wave o the reference wave r is reproduced, just like o is reproduced by r. Thus, one wave or information reproduce the other. This is the property of associative storage [51], [55]. The Fourier-transform method enables information to be stored by superimposing holograms, exhibiting excellent volumetric stability, low scatter and high sensitivity for recording. On the other hand, Fourier transform and related computer algorithms are key methods in computerized modern imaging techniques [26] for image reconstruction from projections including computerized tomography [57], magnetic resonance imaging [58], and others. In this field, digital holographic (DH) microscopy is a new technology applied to optical microscopy due to its capability of producing 3D volumetric images from a single image capture.
Imaging of microscopic objects is an essential tool, especially in life sciences [45]. An important example is medical imaging, where Lagendijk et al. performed measurements of tumour volume in breast cancer patients using 3D automated breast volume scanner images. Their technique is based on 3D ultrasonography, which is in reality a holographic technique [59].
20
2.3.2. Holography and optical communications
Holographic principles have been also explored in the field of communication theory to enhance the transmission of information adapting it for example to fiber communications [60]. In 1961 Leith and Upatnieks [36], looked at Gabor work (a two-step imaging process which involves photographing the Fresnel diffraction pattern of an object and using this recorded pattern to reconstruct an image of this object) from the viewpoint of communication-theory, showing that the reconstruction of the hologram constitutes a sequence of three well-known operations: modulation, frequency dispersion, and a square-law detection, where in the reconstruction process, the inverse-frequency-dispersion operation was carried out in which the signal-to-noise ratio was unity.
DH has become a fundamental tool for communication technology, like in digital video holography, which combines mathematical methods to record, reconstruct and store more information in a single bit due to the properties of holograms. DH techniques are extended further to video format yielding video holograms where the concept that a bit of hologram contains full information of the original video is used to reduce the file size required for communication in terms of storage, security and speed [61].
Alresheedi et. al [62] in their paper about application of holograms in Optical Wireless Communications [48], [63], [64] showed that their adaptive fast angle and power adaptive holograms (FAPA-Holograms) system provides around 35 dB Signal-to-Noise Ratio gain over non-imaging diversity line strip multi-beam systems (LSMS).
2.3.3. Holography in scientific research and science teaching
Here we describe some applications of holography highlighting their importance in different fields of science and technology and in the field of education. In chapter 4 we describe the pedagogical implications of holography and its impact in the context of physics teaching.
There is significant research being carried out in holography. For example, Desse and Tribillon [65] in 2005 developed a real-time color holographic interferometry (RCHI) technique to obtain the refractive index of materials. The technique is based on using light with three wavelengths (red, green and blue) from a mixed gas (argon and krypton) laser. These wavelengths can nowadays be obtained using cheaper, more reliable and user-friendly diode-pumped solid-state (DPSS) lasers. With this technique they recorded high resolution panchromatic transmission holograms. Near-field acoustical holography (NAH) [66], [67] is another field that some researchers have explored for investigating the location of noise sources and understanding the relationship between structure vibration and sound radiation using holographic principles [68]. Another technique that has gained interest in
21
research and application fields since the invention of holography is holographic interferometry [69], [70]. It has been used for the determination of small and/or large deformations [65], to study the problems related to aberration in holographic images [71], as a method for measuring strain caused by polymerization shrinkage of dental composite [72] and to measure microscopic displacements on the surface of an object and small changes in the refractive index of transparent objects [73], [74]. Each particular application of holographic interferometry requires a specific arrangement of the optical setup [75].
Barkhaya and Halim in their article entitled “A review of application of 3D Hologram in education: a meta-analysis “ [76], highlight the application of three-dimensional hologram technology in education which they recognized as a teaching tool in the classroom. In the following table they summarize the role of 3D holography fields. In the field of physics education, there are many physical principles (e.g., interference, diffraction, superposition principle) which can be taught and illustrated by the simple realization of a laser hologram. It is also possible to make several experiments illustrating important applications of holography, such as holographic interferometry used in mechanical stress diagnostics, angular multiplexing used in holographic data storage, “notch” filters used in Raman spectroscopy and holographic diffraction gratings used in passive spectroscopy. For example, in the basic courses on ray and wave optics at Lund University, holography has played an important role both in stimulating the students to explore the fascinating world of optics and in visualizing various interesting concepts within the courses. In Lund, students have four-hour lab sessions in holography aimed at stimulating their interest in optics, lasers and optical measurement techniques [77]; To simplify and to help the teaching of holography, a teaching kit for holography that can be packed into a small case which includes all the equipment required to produce holograms was created at Lund University. This kit is also particularly suited for science outreach, teaching of undergraduate and graduate students and continuing education [78]. Similar approaches have been followed in other countries. Holography has another advantage in the field of education when it is thought as information communication technology (ICT) medium of the teaching of sciences as pointed by Ghuloun [79] and it has been used by different researchers or educators as teaching agent or pedagogical tool in different areas of physics teaching.
22
Table 2.1. Role of holography in different fields (adapted from [76]).
Meta-analysis of 3DH in various fields and in education Study Field (Application) Uses Advantages Vandembosch et.al (2005) Cardiothoracic Surgery (Dynamic 3D echocardiography) Observing the 3D echocardiographic data sets (normal an
pathological mitral valve) in a hologram
Useful tool in clinical practice
Robin (2013) Medical training-Neurosurgery (Pulse Brain Hologram) Combine biomedical data on 3D image Explaining planned procedure to increase patient satisfaction due to explanation Romero (2015) Neuroscience (Cerebellar control model-CCM) Evaluation of models to control robotic origami arm
Precise and fast movement of robotic arm Abin (2013) Business (Advertisement) Advertising and promotion A business or product stands out from the competitors Khan et al
(2013)
Photo-Optical Instrumentation Engineering
HOE-based display (as far converging lens)
High resolution images, relatively bright, visible under ambient indoor lighting
Freeman (2010)
Pharmacology Display the transport and effect of drugs in the several internal organs of the human body.
Help students to understand clearly how drugs work and affect the human body Aina (2010) Astronautical engineering (Genx Theatre) Farnborough Air show in 2006
Show and discuss large engine that cannot physically fit in classroom Very interesting technique to view different angles. Jurmain et al. (2008) Archeological study (Artifacts) Projecting realistic images of artifacts Archeology students are able to explore and analyse holograms of rare artifacts, hence preventing damage to the original artefacts Upadhy (2013) Engineering education (Graphics and Drawing) A diagram of projection of hexagonal pyramid with isometric view
Increase student understanding Monnin (2010) Early childhood education (“Bugs Bunny” cartoon character)
23 3. The Physics behind Holography
3.1. Interference of light waves
Light is an electromagnetic wave and it has many scientific and technological applications; in holography, only the electric field strength is considered. Electromagnetic waves are 3-D waves, with three space dimensions and one time dimension [26], [80]. Here we represent the object wave with “o” and the reference wave with “r” and the intensity with 𝐼 and it is the square of the electrical field amplitude. When the object and reference wave are superimposed, they create an interference pattern which can be recorded on the holographic plate and the hologram will represent this interference pattern [81], [82].
The electric field 𝐸(𝑡) of a plane wave at a given point in space, assuming propagation in the z - direction, is given by the following equation [83]:
𝐸(𝑧, 𝑡) = 𝐴𝑐𝑜𝑠(2𝜋𝑓𝑡 + 𝜑)
= 𝐴𝑐𝑜𝑠(𝜔𝑡 + 𝜑) (3.1) where A is the amplitude of the oscillation and is the angular frequency. The parameter 𝜑 represents a phase factor for 𝑡 = 0.
Figure 3.1 shows a “snapshot” of the light wave, where, 𝜆 is the wavelength, c is the speed of light, and 𝑇 the oscillation period of the eletric field. The reciprocal value describes the frequency 𝑓 = 1 𝑇⁄ . Since a point at a distance z from the point of origin starts to oscillate with a phase shift proportional to the time 𝑡0= 𝑧 𝑐⁄ = 𝑧 (𝑓𝜆)⁄ , the equation of oscillation at
this point becomes:
𝐸(𝑧, 𝑡) = 𝐴𝑐𝑜𝑠(𝜔(𝑡 − 𝑡0) + 𝜑) (3.2)
Figure 3.1: Representation of a plane wave (from [83] )
The plane wave equation can therefore be written as:
𝐄(z, t) = 𝐴 cos(𝜔𝑡 − 𝑘𝑧 + 𝜑) = 𝐴 cos(𝜔𝑡 + 𝜙) (3.3𝑎) where 𝑘 = 2 𝜋 𝜆⁄ is the wave number and 𝜙 = 𝜑 − 𝑘𝑧. Using the complex notation of Euler’s relation 𝑒±𝑖𝜙= 𝑐𝑜𝑠𝜙 ± 𝑖𝑠𝑖𝑛𝜙, Eq. 3.3a becomes:
24
Here only the real part is important and the bold character denotes the complex amplitude. The term 𝜔𝑡 in the exponent can be left out for simplicity. The term
𝐄(t) = 𝐴𝑒−𝑖𝜙 (3.3𝑐)
is the complex amplitude and A is the amplitude of the complex amplitude field.
The interference of two plane waves of a coherent light source is discussed in order to explain how volume holograms are generated [81], for example in a thick medium. Eqs (3.4) and (3.5) represent the object and the reference waves [26], and figure 3.2 depicts the interference fringes or system of standing waves as generated by the two coherent point light sources
𝐨 = 𝑜𝑒−𝑖𝜙 (3.4) 𝐫 = 𝒓𝑒−𝑖Ψ (3.5) r and o are, in this case, the field amplitudes of the respective waves at the point of superposition P. The phase 𝛹 = 𝛹𝑅 − 2𝜋(𝑟1⁄ ) is determined by the starting phase of the 𝜆
wave at point R and the phase change at distance 𝑟1. The same is valid for 𝜙 = 𝜙𝑂−
2𝜋(𝑟2⁄ ). 𝜆
The complex amplitude adds up at point P: 𝑟 + 𝑜. the intensity 𝐼 is the square of the sum of the complex amplitudes:
𝐼 = |𝑟 + 𝑜|2 (3.6𝑎) 𝐼 = 𝑟. 𝑟∗+ 𝑜. 𝑜∗+ 𝑜. 𝑟∗+ 𝑟. 𝑜∗
𝐼 = 𝑟2+𝑜2+ 𝑟. 𝑜{e−i(ϕ−Ψ)
+ ei(ϕ−Ψ)} (3.6𝑏)
(3.6𝑏)
If the light sources are emitting completely independently then the average of 𝑐𝑜𝑠(𝜙 − 𝛹) vanishes since the phases vary statistically, which results in
𝐼 = 𝑟2+𝑜2 (3.7)
In this case the waves are called “incoherent.” The intensities of both waves add up, and interference does not occur.
If the value of 𝛹𝑅− 𝜙𝑂 does not change, the waves are “coherent.” According to Eq.
(3.6a) locations in space exist where 𝑐𝑜𝑠(𝛹 − 𝜙) = ±1. If the field strengths oscillate in the same phase (+) this results in
𝑟 + 𝑜
and the intensity reaches a maximum
𝐼𝑚𝑎𝑥= 𝑟2+𝑜2+ 2𝑟. 𝑜 (3.8𝑎)
25 𝑟 − 𝑜
and the intensity reaches a minimum
𝐼𝑚𝑖𝑛 = 𝑟2+𝑜2− 2𝑟. 𝑜 (3.8𝑏)
Figure 3.2 Interference fringes or system of standing waves as generated by two coherent point light sources R and O (from [83]).
The expression 𝑟. 𝑜{e−i(ϕ−Ψ)+ ei(ϕ−Ψ)} is the “interference term.”
The interference pattern for 𝛹𝑅= 𝜙𝑂± 𝑁(2𝜋) is shown in figure 3.2. The maxima of
oscillation are given by
𝑟1 − 𝑟2= ±𝑁𝜆 (3.9)
At the position of the maxima both waves oscillate in phase. Equation (3.9) describes a set of rotational hyperboloids. The distance between maxima is given by
𝑑 = 𝜆
2 sin(𝛼) (3.10) where 2𝛼 is the angle enclosed by 𝑟1 and 𝑟2. For the connecting line 𝑅𝑂̅̅̅̅ is 𝛼 = 𝜋 2⁄ and the
distance of the maxima becomes 𝑑 = 𝜆 2⁄ . The so-called Fresnel zone lens appears when the interference pattern is cut perpendicular to its symmetry axis.
3.2. Visibility and polarization influence
For the recording of the hologram, the visibility V in the interference field is determined by the ratio of the two waves 𝐼1= 𝑟2 and 𝐼2= 𝑜2 and is given by
𝑉 =𝐼𝑚𝑎𝑥− 𝐼𝑚𝑖𝑛 𝐼𝑚𝑎𝑥+ 𝐼𝑚𝑖𝑛
(3.11) For coherent waves and using eqs. (3.8a), (3.8b), and (3.7) one gets
26 𝑉 = 2 ∙ √𝐼1 𝐼2 1 +𝐼𝐼1 2 (3.12𝑎)
where the maximum of visibility is reached when 𝐼1= 𝐼2.
Assuming that the polarization of the light waves is parallel, it follows that the maximal visibility of 𝑉 = 1 holds for 𝐼1= 𝐼2. If the polarization directions of two linearly polarized
waves enclose an angle 𝜓 the following equations result instead of eqs. (3.6a) and (3.12a): 𝐼 = 𝑟2+𝑜2+ 2𝑟. 𝑜 𝑐𝑜𝑠(𝜙 − 𝛹) 𝑐𝑜𝑠 𝜓 (3.6𝑏) and 𝑉 = 2 ∙ √𝐼𝐼1 2 1 +𝐼1 𝐼2 𝑐𝑜𝑠𝜓 (3.12𝑏)
Meaning that interference does not occur if the directions of polarization are perpendicular to each other.
3.3. Holographic recording and reconstruction 3.3.1. Recording and reconstruction
The intensity of the electromagnetic field of the light wave impinging on the photosensitive layer (figure 3.3a) is given in Eq. 3.6a, where the factor (𝒓 + 𝒐)∗ represent complex functions of r and o, which gives:
𝐼 = 𝑟. 𝑟∗+ 𝑜. 𝑜∗+ 𝑜. 𝑟∗+ 𝑟. 𝑜∗ (3.13𝑏) here the star represents the complex conjugate. This factor contains the object wave o and it is particularly important for holography. The darkening of the holographic film is dependent on the intensity 𝐼.
The reconstruction is performed by illuminating the hologram with the reference wave r (Fig. 3.3b). Assuming that the amplitude transmission of the material is proportional to 𝐼 then the reconstruction yields the light amplitude 𝑢 directly behind the hologram:
27
Figure 3.3 Description of holography (off-axis hologram): (a) recording, (b) reconstruction, and (c) inversion of the reconstruction wave (from [83]).
The wavefield behind the hologram is composed of three parts namely:
➢ 𝑢0 is the zeroth diffraction order governing the reference wave which
is weakened by the darkening of the hologram;
➢ 𝑢−1 describes the complex conjugate object wave 𝑜∗ and
corresponds to the −1𝑠𝑡 diffraction order which gives a real and pseudoscopic image due to convergent diffraction;
➢ 𝑢+1 represents the first diffraction order, where the object wave itself
is reconstructed with the amplitude of the reference wave |𝑟|2 being constant
over the whole hologram and proves that the object wave o can be completely reconstructed. This gives a virtual and orthoscopic because the diffraction is divergent.
3.3.2. Mathematical description of holographic recording and reconstruction
3.3.2.1. Object and reference wave
The complex amplitude of the object wave 𝑜(𝑥, 𝑦) with absolute value |𝑜(𝑥, 𝑦)| and phase 𝛷(𝑥, 𝑦) depend on the coordinates 𝑥 and 𝑦 on the photographic plate. If the time dependence of the waves is not considered, Eq. (3.14) for the object wave can be written as
𝒐(𝑥, 𝑦) = |𝒐(𝑥, 𝑦)|e−𝑖ϕ= 𝑜(𝑥, 𝑦)e−𝑖ϕ. (3.15)
The phase 𝛹 depends on the angle of incidence 𝜎 and can be calculated by (Fig. 3.4) 𝑟(𝑥, 𝑦) = 𝑟e−𝑖𝛹= 𝑟(𝑥, 𝑦)e+𝑖2𝜋𝑥𝜎𝑟. (3.16) The distance between the two maxima of the reference wave in the hologram plane is given by 𝑑𝑟 = 1 𝜎⁄ : 𝑟
28 𝑑𝑟 = 1 𝜎𝑟 = 𝜆 sin 𝛿, (3.17)
where 𝜎𝑟 is the so-called spatial frequency of the wave, i.e., the number of maxima per unit
length.
3.3.2.2. Recording
The intensity in the plane of the photographic layer is therefore given by (see also Eq. (3.13b))
𝐼 = |𝒓(𝑥, 𝑦) + 𝒐(𝑥, 𝑦)|2 = |𝒓(𝑥, 𝑦)|2+ |𝒐(𝑥, 𝑦)|2+ 𝒓∗(𝑥, 𝑦)𝒐(𝑥, 𝑦) + 𝒓(𝑥, 𝑦)𝒐∗(𝑥, 𝑦) (3.18)
𝐼 = 𝑟2+ 𝑜2+ 𝑟𝑜(𝑥, 𝑦)(𝑒−2𝜋𝑖𝜎𝑟𝑥𝑒−𝑖𝝓(𝑥,𝑦)+ 𝑒2𝜋𝑖𝜎𝑟𝑥𝑒𝑖𝝓(𝑥,𝑦)) (3.19)
Figure 3.4: Phase 𝜓 = −2𝜋 𝛥 𝜆⁄ of an angular incident wave on a hologram (from [83])
The four summands can be calculated as
Eq. (3.19) shows that the intensity distribution in the photographic layer contains the object wave’s amplitude 𝑂(𝑥, 𝑦) as well as the phase 𝜙(𝑥, 𝑦). The amplitude 𝑂(𝑥, 𝑦) modulates brightness while the phase modulates the distance of the fringes with spatial carrier frequency 𝜎𝑟 = 𝑓𝑟𝑖𝑛𝑔𝑒𝑠 𝑢𝑛𝑖𝑡 𝑙𝑒𝑛𝑔𝑡ℎ⁄ .
The transmission decreases proportionally to the exposure intensity I and the exposure time 𝜏. The transmission without any exposure is given by
𝑡 = 𝑡0+ 𝛽𝜏𝐼 = 𝑡0+ 𝛽𝐸. (3.20)
The term 𝐸 = 𝜏𝐼 describes the energy density of the light, commonly called the “exposure.” The parameter 𝛽 is negative and is represented by the slope in the H&D curve (Fig. 3.5). The amplitude transmission is then given by
𝑡(𝑥, 𝑦) = 𝑡0+ 𝛽𝜏𝑟2+ 𝛽𝜏𝑜2(𝑥, 𝑦) + 𝛽𝜏𝑟0(𝑥, 𝑦)𝑒−𝑖2𝜋𝜎𝑟𝑥𝑒−𝑖𝜙(𝑥,𝑦)
29
Figure. 3.5: Transparency and phase curves of holographic materials: (a) phase shift 𝛥𝛷 as a function of the light energy 𝐸, (b) amplitude transparency 𝑡 of a holographic emulsion layer as a function of the light energy E, and (c) optical density 𝐷 = log 1 𝑡⁄ as a function of E (Hurler and 2
Driffield, H&D curve), (from [83]).
3.3.2.3. Gratings
The transmission t of a plane object wave o which illuminates the photographic layer similar to the reference wave in eq.(3.21a) with 𝜙 = −𝑖2𝜋𝜎0𝑥 and the Euler equation then
gives
𝑡(𝑥) = 𝑡̅ + 𝑡1cos(𝑘𝑥)
𝑘 = 2𝜋(𝜎𝑟+ 𝜎0)
𝑡̅(𝑥) = 𝑡0+ 𝛽𝜏(𝑟2+ 𝑜2(x, y))
𝑡1= 𝛽𝜏𝑟0. (3.21𝑏)
The amplitude transmission t of a hologram formed by two plane waves r and o is therefore a cosine-like diffraction grating. Hence the intensity transmission 𝑇 = 𝑡2 is proportional to a cos2-function.
3.3.2.4. Reconstruction
For the reconstruction of the object wave, the developed hologram is again illuminated with the reference wave 𝑟(𝑥, 𝑦) = 𝑟𝑒𝑖2𝜋𝜎𝑟𝑥. The hologram 𝑡(𝑥, 𝑦) acts like a filter and the wave field 𝑢(𝑥, 𝑦) directly behind the photographic layer is given by
𝒖(𝑥, 𝑦) = 𝒓(𝑥, 𝑦)𝒕(𝑥, 𝑦) (3.22) With the help of equations (3.15), (3.16) and (3.21a) this becomes
30 𝒖(𝑥, 𝑦) = (𝑡0+ 𝛽𝜏𝑟2)𝒓(𝑥, 𝑦) +𝛽𝜏𝑜2(𝑥, 𝑦)𝒓(𝑥, 𝑦) ∶ 𝑢0 +𝛽𝜏𝑟2𝒐(𝑥, 𝑦) ∶ 𝑢+1 +𝛽𝜏𝑟2(𝑥, 𝑦)𝒐∗(𝑥, 𝑦)𝑒𝑖4𝜋𝜎𝑟𝑥 ∶ 𝑢 −1. (3.23)
This expression describes the effect of a hologram on a light wave during the reconstruction. It is given by four summands which are written in four lines (Fig. 3.3b).
The first summand refers to the intensity reduction of the reconstruction wave (=reference wave) by the factor (𝑡0+ 𝛽𝜏𝑟2) during reconstruction.
The second term is small assuming that we choose 𝑜(𝑥, 𝑦) < 𝑟 during recording. This term is distinguished from the first term by its spatial variation 𝑜2(𝑥, 𝑦). The 𝑜2(𝑥, 𝑦) term contains low spatial frequencies which have small diffraction angles and create a so-called halo around the reconstruction wave.
The size of the halo is given by the angular dimension of the object. The first two terms form the zeroth diffraction order in eq. (3.23).
The third expression in eq. (3.23) denotes the object wave 𝑜(𝑥, 𝑦) multiplied with the constant factor 𝛽𝜏𝑟2. The third term is the most important and represent the first diffraction order.
The wave travels divergent from the hologram thus creating a virtual image at the position of the original object and this image cannot be captured on a screen. The intensity (square of amplitude) of the image does not depend on the sign of 𝛽. Therefore, it is unimportant whether the hologram is processed as “positive” or “negative”.
The fourth term is the conjugate complex of the object wave o∗(𝑥, 𝑦) and represents
the first diffraction order. It creates a conjugated real image. The conjugated wave 𝑜∗(𝑥, 𝑦)
is mutipied with the constant factor 𝛽𝜏𝑟2 as well as the exponential function 𝑒𝑖4𝜋𝜎𝑟𝑥. The latter means that the wave has roughly twice the angle of incidence (2𝛿) compared to that of the reference wave (more precisely: the sine of that angle is twice as large). Since the complex conjugated wave, the phase changes its sign with respect to 𝑜(𝑥, 𝑦). Therefore, the wave 𝑜∗(𝑥, 𝑦) travels convergent and forms a real image.
3.4. Volume hologram
There are a number of different types of hologram, usually grouped into two main categories: transmission and reflection holograms. Reflection holograms are made with the object and reference beams incident on the holographic emulsion from opposite sides; transmission holograms are made with both beams incident from the same side [84] (see
31
figure 3.6). Transmission holograms are reconstructed using laser light usually with the same wavelength used during recording, whereas reflection holograms can be reconstructed using white light.
Figure 3.6: Basic single-beam transmission (a) and reflection (b) hologram setups (from [25]).
Here we briefly describe only one type of hologram that we worked on - volume holograms recorded in a thick medium. A major advantage gained with this type of hologram is that the hologram is wavelength selective and thereby also works with white light (if it is a reflection hologram) after recording and can have very high diffraction efficiency [26].
An example of the recording of a volume hologram is given in figure 3.7, where the object and reference wave interfere in a thick emulsion and the resulting pattern recorded represents a volume grating. When the same reference wave is used for the reconstruction, the object wave is perfectly replayed.
Figure 3.7.: Interference pattern of two plane waves generating a volume grating in a thick emulsion (from [26]).
32
One can find other types of holograms such as Fresnel and Fraunhofer holograms, Fourier holograms and embossed holograms.
3.5. Conjugated Object Wave
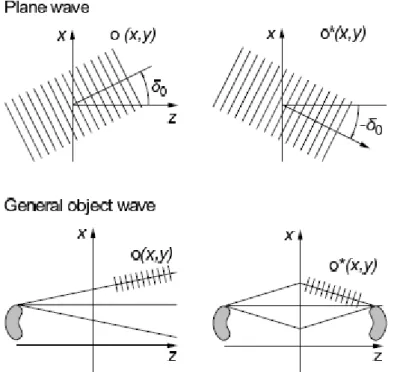
To show which properties the conjugate complex object wave 𝑜∗(𝑥, 𝑦) has behind the hologram, a plane wave with an angle of incidence 𝛿0 is considered (see fig. 3.8). In this
case the object wave can be written similar to eqs. (3.16) and (3.17): 𝒐∗(𝑥, 𝑦) = 𝑜𝑒𝑖2𝜋𝜎0𝑥 and 𝜎
0= sin 𝛿0⁄ 𝜆
or
𝒐∗(𝑥, 𝑦) = 𝑜𝑒𝑖2𝜋𝜆𝑥 sin 𝛿0 (3.24) The conjugate complex object wave is formed by changing the sign of the exponent in eq. (3.24). The negative sign can then be included in the sine function:
𝒐∗(𝑥, 𝑦) = 𝑜𝑒𝑖2𝜋𝜆𝑥 sin(−𝛿0) (3.25) In Figure 3.8 it becomes apparent that the conjugate complex wave 𝑜∗(𝑥, 𝑦) emerges from 𝑜(𝑥, 𝑦) by exchanging the angles 𝛿0 and −𝛿0. 𝑜∗(𝑥, 𝑦) forms a real image mirrored with
respect to the hologram plane.
Figure 3.8: The conjugate complex object wave 𝑜∗(𝑥, 𝑦) can be created from 𝑜(𝑥, 𝑦) by mirroring at the hologram plane. 𝑜∗(𝑥, 𝑦) creates a conjugated pseudoscopic mirror image (from [83]).
33
Furthermore, it is noticeable that the three-dimensional images formed by 𝑜(𝑥, 𝑦) and 𝑜∗(𝑥, 𝑦) have different properties. For an opaque object, only the concave inner surface of
the image produced by 𝑜(𝑥, 𝑦) can be seen (Fig. 3.8). For an image formed by 𝑜∗(𝑥, 𝑦) this
surface becomes convex. This image with reversed curvatures is called “pseudoscopic.” The normal image on the other hand is called “orthoscopic.”
3.5.1. Position of the conjugated image
It can be calculated from the fourth term 𝑢−1 in Eq. (3.23) if, for simplification, a plane
object wave 𝑜(𝑥, 𝑦) is assumed. Therefore 𝑜∗(𝑥, 𝑦) is also a plane wave. If 𝑜(𝑥, 𝑦) has the angle of incidence 𝛿0 (see fig. 3.8), Eqs. (3.23) and (3.25) can be written as
𝑢−1= 𝛽𝜏𝑟2𝑂𝑒𝑖 2𝜋
𝜆𝑥 sin(−𝛿0)+ 2sin 𝛿. (3.26) Here the relation 𝑒𝑎𝑒𝑏 = 𝑒𝑎+𝑏 was used. Expression (3.26) represents a wave with the angle of incidence 𝛿−1 with
sin 𝛿−1= sin(−𝛿0) + 2 sin 𝛿 . (3.27)
As already stated, the conjugated image with 𝛿0= 0 (object wave impinging
perpendicular on the hologram) appears at an angle of 𝑠𝑖𝑛𝛿−1= 2𝑠𝑖𝑛𝛿;
where 𝛿 is the angle of the reference and reconstruction waves.
3.5.2. Reversal of the reconstruction wave
In two-stage holography also the real conjugated pseudoscopic image is used (figure 3.3b). But sometimes the image position is geometrically unfavorable and it is reconstructed in a different manner, namely by reversing the direction of the reconstruction wave (figure 3.3c). The same effect can be achieved by turning the hologram by 180◦ (around an axis perpendicular to the plane of paper). The reversal of a plane reconstruction wave like in Eq. (3.16)
𝒓(𝑥, 𝑦) = 𝑟𝑒𝑖2𝜋𝜆𝑥 sin( 𝛿)
means that 𝛿 is replaced by 180° + 𝛿. From the relation sin( 180° + 𝛿) = −sin 𝛿 follows that the reversed reconstruction wave is described by 𝑟∗ (Fig. 3.5). By reversing the reconstruction wave, Eq. (3.23) changes to
𝒖,(𝑥, 𝑦) = 𝒓∗(𝑥, 𝑦)𝑡(𝑥, 𝑦). (3.22𝑎) Instead of Eq. (3.24), the following equation results:
𝒖,(𝑥, 𝑦) = (𝑡
0+ 𝛽𝜏𝑟2)𝒓∗(𝑥, 𝑦)
+𝛽𝜏𝑜2(𝑥, 𝑦)𝒓∗(𝑥, 𝑦) ∶ 𝒖 𝟎
34
+𝛽𝜏𝑟2𝒐(𝑥, 𝑦) ∶ 𝒖+𝟏, +𝛽𝜏𝑟2(𝑥, 𝑦)𝒐∗(𝑥, 𝑦)𝑒𝑖4𝜋𝜎𝑟𝑥 ∶ 𝒖
−𝟏
, . (3.23𝑎)
The terms 𝑢0, , 𝑢+1, , and 𝑢−1, can be interpreted analogously to the last section. The results are shown in figure 3.3c. The first and second terms form 𝑢0, in analogy with 𝑢0 in
Section 3.3 with the difference that the direction of the reference wave has been reversed. The third term (𝑢+1, ) represents the object wave 𝑜∗(𝑥, 𝑦) although the direction is
angled by roughly −2𝛿 due to the exponential function. According to figure 3.3c a virtual orthoscopic image is formed.
The fourth term (𝑢−1, ) describes the conjugated object wave 𝑜∗(𝑥, 𝑦). This wave produces an image at the location where the object was originally placed. The image is real but pseudoscopic since it was generated with the conjugated wave. The reversal of the reconstruction wave therefore leads to a real pseudoscopic image which can be used as a new object in two-stage holography.
35 4. Experimental production of holograms
4.1. Laser sources and their characteristics
A laser is an adequate light source for hologram recording due to its unique properties, such as a high degree of monochromaticity, spatiotemporal coherence, brightness, directionality and, in some cases, its short temporal duration [85]. Various types of laser sources can be used in hologram production, operating either in a continuous wave (CW) or pulsed regime. Essentially, there are five types of solid-state laser technology which meet the need for long coherence length in order to produce holograms, namely: frequency-converted diode-pumped lasers (DPL or DPSS lasers), tunable frequency-frequency-converted CW optical parametric oscillators (OPOs), single-frequency and/or frequency-stabilized diode lasers, frequency-converted fiber lasers and pulsed solid-state lasers [22].
There are also gas lasers suitable for holography, namely neon lasers, helium-cadmium lasers and argon or krypton ion lasers [86], although the latter are now considered obsolete technology. For our purposes, we work with a modern single-frequency frequency-doubled DPSS CW laser (CNI, model MSL-FN-532-50mW) at 532 nm (green), with 50 mW of output power and more than 50 m of coherence length.
4.2. Optical components and experimental details
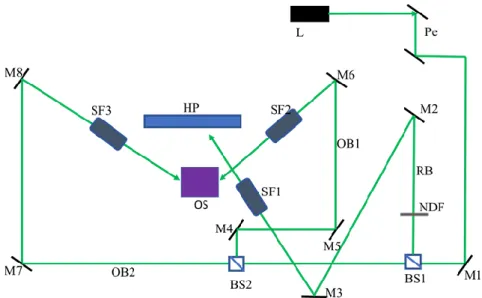
For the production of holograms, we used two facilities: the Hololab at IFIMUP / Department of Physics of FCUP and the darkroom of the same institute, where hologram development was performed. Apart from an adequate laser source for hologram production, additional optical components are needed for the complete experimental setup. In this section we briefly describe the main characteristics and role of the main optical components we used in the production of holograms. In the first part of the thesis work, we opted to build a versatile setup capable of switching from a transmission hologram geometry (figure 4.1) to a reflection hologram geometry like in the case of figure 4.5. There is also one more setup of transmission holography for doing a holographic magnifying glass (figure 4.7).
36
Figure 4.1: Multibeam transmission hologram setup. Laser source (L), Periscope (Pe), Mirrors (M), spatial filter (SF), reference beam (RB), object beam (OB), holographic plate (HP), Object scene (OS), beam splitters (BS) and neutral density filter (NDF). Our first object scene was a simple setup depicting a Michelson interferometer (MI) without source.
Figure 4.2: Images of the multi-beam transmission hologram setup, with laser off (a) and on (b) after recording/exposure and development procedures wherein PH is the plate holder with the holographic plate HP.
For the setup of figure 4.2, three spatial filters (equipped with microscope objectives and adequate pinholes), two neutral density filters and two beam splitters, BS1 (7/92 reflection/transmission) and BS2 (37/63 reflection/transmission), were used. The neutral density filter is used to reduce power during alignment. The reference beam was incident on the plate at the Brewster angle. A beam ratio of approximately 4:1 (reference:object) was obtained by adjusting the distances of the two spatial filters illuminating the object (SF2 and SF3). The holographic plate was an ultra-high-resolution silver-halide emulsion coated on glass (Ultimate 08) with a grain size of 8 nm, a resolution of >8000 lines/mm) and 45 inches in size. The sensitivity of these plates is around 100-200 J/cm2, which is a remarkably low value given the small grain size. The setups were built on a vibration-isolated optical table.
37
As our first object, we used a setup depicting a basic Michelson interferometer (figure 4.3) – a simple yet powerful optical device that can also be used to test the stability and detect potential vibrations in the optical setup itself.
Figure 4.3: Basic Michelson interferometer for testing vibrations on optical table and optical components: laser (L), diverging lens (DL), beamsplitter (BS), mirrors (M1 & M2), and screen (S). Adapted from [25].
4.3. Production and replay of transmission hologram s
The exposure time for the transmission hologram setup was 9 s, calculated from a total intensity (sum of reference and object beam intensities) of approximately 16W cm⁄ 2,
measured with a power meter head placed on the plane of the holographic plate holder. Processing of the exposed plate was performed in the darkroom under red safelight illumination and consisted of a proprietary developer followed by a rehalogenating bleach step, washing and drying, according to the recommendations of the plate manufacturer (for more details on the processing, see Ultimate Holography website: http://shop.ultimate-holography.com/img/cms/process%20et%20spécifications/processU08-en.pdf). The final holograms were very transparent, with very minor residual scattering, which is a good indication of correct exposure and development. The diffraction efficiency was also very high (by eye), as shown in Figure 4.4.
An image where light actually passes through it is called a real image; otherwise it is called a virtual image (like an image on a mirror). When a hologram is replayed, the virtual image is not the only image present. Figure 6 shows images of the obtained transmission hologram in two different reconstruction conditions: conjugate reference beam and normal

![Figure 2.6: A model of wavefront recording and reconstruction illustrating the Gabor, Denisyuk and Leith/Upatnieks hologram recording geometries (from [41])](https://thumb-eu.123doks.com/thumbv2/123dok_br/15703395.1067637/17.892.252.662.392.774/wavefront-recording-reconstruction-illustrating-denisyuk-upatnieks-recording-geometries.webp)
![Figure 2.7. Diagram demonstrating associative storage property of holographic storage using the Fourier-transform method (from [56], [51])](https://thumb-eu.123doks.com/thumbv2/123dok_br/15703395.1067637/19.892.248.665.208.379/figure-diagram-demonstrating-associative-property-holographic-fourier-transform.webp)
![Figure 3.2 Interference fringes or system of standing waves as generated by two coherent point light sources R and O (from [83])](https://thumb-eu.123doks.com/thumbv2/123dok_br/15703395.1067637/25.892.325.622.257.482/figure-interference-fringes-standing-waves-generated-coherent-sources.webp)
![Figure 3.3 Description of holography (off-axis hologram): (a) recording, (b) reconstruction, and (c) inversion of the reconstruction wave (from [83])](https://thumb-eu.123doks.com/thumbv2/123dok_br/15703395.1067637/27.892.136.717.109.383/figure-description-holography-hologram-recording-reconstruction-inversion-reconstruction.webp)