UNIVERSIDADE DE LISBOA FACULDADE DE CIÊNCIAS
Ventilated Passive Cooling: Climatic Cooling Potential and
Cooling Demand Savings
Analysis at a large spatiotemporal scale
Doutoramento em Sistemas Sustentáveis de Energia
Hugo Miguel Gil Campaniço
Tese orientada por:
Doutor Pedro Miguel Matos Soares Doutor Pierre Hollmuller
UNIVERSIDADE DE LISBOA FACULDADE DE CIÊNCIAS
Ventilated Passive Cooling: Climatic Cooling Potential and
Cooling Demand Savings
Analysis at a large spatiotemporal scale
Doutoramento em Sistemas Sustentáveis de EnergiaHugo Miguel Gil Campaniço
Tese orientada por:
Doutor Pedro Miguel Matos Soares Doutor Pierre Hollmuller
Júri: Presidente:
● Doutor João Catalão Fernandes (Faculdade de Ciências, Universidade de Lisboa) Vogais:
● Doutor Pierre Hollmuller (Institute de Sciences de L´Environnement da Université de Gèneve, Suíça) ● Doutor Adélio Manuel Rodrigues Gaspar (Faculdade de Ciências e Tecnologia da Universidade de Coimbra) ● Doutor Daniel Aelenei (Faculdade de Ciências e Tecnologia da Universidade Nova de Lisboa)
● Doutor João Manuel de Almeida Serra (Faculdade de Ciências da Universidade de Lisboa)
● Doutor Guilherme Carvalho Canhoto Carrilho da Graça (Faculdade de Ciências da Universidade de Lisboa)
Acknowledgments
I gratefully acknowledge the Ministry of Science, Technology and Higher Education of Portugal for financing this project through the Doctoral grant SFRH / BD / 51329 / 2010. I am thankful to professor Bernard Lachal, Institut des Sciences de l'environnement, University of Geneva, for helpful scientific discussions. I am deeply thankful to my advisors, Professor Pedro Matos Soares and Professor Pierre Hollmuller, for all their support, counselling and friendship both in times when I failed and in those in which I succeeded. I am also thankful to Professor Rita Cardoso for her valuable scientific contributions and suggestions. To my parents and my sister for being ever-supporting and comprehensive no matter what. To all my friends who have closely followed this work, specially to David Ferreira and Maria Pinheiro, for their support and effort in dealing with my frustrations and disappointments during this path. To Nuno Mateus, a colleague and friend, always willing to help. To Pedro Nunes, a supportive colleague who became a dear friend.
Abstract
Buildings are the largest energy consuming sector, above industry and transportation, which places them as one of the major greenhouse gases emitters. Building thermal conditioning represents nearly 50% of their total energy use, mostly heating; however, trends show an increase in air-conditioning adoption for cooling, and, moreover, global warming will probably boost this tendency. The present thesis main goal is to contribute to the characterization of passive cooling systems, and their operating strategies, to reduce buildings energy demand for cooling. For that, first, one has developed a model able to estimate the cooling demand savings based on the climatic cooling potential (CCP) for different ventilated passive cooling systems for buildings. The CCP expresses the cooling load that a passive system can bring to a building as compared with standard ventilation from outdoor. The model was validated with extensive numerical simulations using the thermal simulation tool TRNSYS. For the 7,776 cases simulated, the model was able to reproduce the cooling demand savings with an error below 1% when compared to TRNSYS. In a second phase, using the same model and results from the Weather Research and Forecasting Model (WRF) forced by the global atmospheric reanalysis ERA-Interim, the CCP for direct ventilation and evaporative cooling was computed for the Iberian Peninsula. In a third phase, the WRF forced by the earth system model EC-EARTH for present and future climates allowed to assess the climate change impact on the CCP over Iberia, both for direct ventilation and evaporative cooling. The future simulations follow the Representative Concentration Pathway scenario RCP8.5 from IPCC. The results show that the CCP for both direct ventilation and evaporative cooling is expected to decrease by the end of the century due to increased air temperatures; nevertheless, the future CCP is at most 40% lower than the present CCP. Finally, a comparative analysis between present and future climates cooling degree hours for Iberia was carried out. The results show that, generally, future cooling degree hours increase 2.5 times comparing to the present, which is a higher increase than the corresponding decrease in the CCP.
The model developed, as well as the spatiotemporal datasets derived from it, can be used to estimate the cooling demand savings associated to the use of direct ventilation and evaporative cooling in buildings for Iberia. The proposed methodology can be easily extended for other regions or climates.
Keywords: Passive Cooling; Climatic Cooling Potential; Cooling Demand Savings;
Resumo
O sector dos edifícios é o maior consumidor energético, acima da indústria e do transporte. Este facto coloca o sector dos edifícios como um dos maiores responsáveis pela emissão de gases com efeito de estufa. O aquecimento e arrefecimento representa cerca de 50% da energia utilizada dentro dos edifícios, e, embora a maior fração desta energia se deva ao aquecimento do espaço, a tendência tem vindo a mostrar um aumento do número de aparelhos de ar-condicionado. Além disso, a problemática do aquecimento global contribuirá ainda mais para este aumento bem como para o aumento da quantidade de energia despendida no arrefecimento dos espaços dentro dos edifícios. Esta tese tem como principal objetivo contribuir para a caracterização dos sistemas de arrefecimento passivos com recurso a ventilação e das suas estratégias operacionais, possibilitando assim uma redução do consumo energético associado ao arrefecimento dos espaços nos edifícios. Para isso, numa primeira fase deste estudo, desenvolveu-se um modelo baseado no potencial climático de arrefecimento. Este modelo integra temporalmente o produto entre o caudal de ventilação de um dado sistema de arrefecimento passivo e as diferenças entre a temperatura de conforto do edifício durante a época de arrefecimento (aqui definida igual a 26ºC) e a temperatura do ar fornecido pelo sistema de arrefecimento passivo. Do modelo, designado de Potencial Climático de Arrefecimento, ou Climatic Cooling Potential (CCP), resulta o potencial de arrefecimento, ou, a quantidade máxima de energia térmica que um dado sistema de arrefecimento passivo sujeito a um determinado caudal de ventilação é capaz de extrair de um edifício num dado intervalo de tempo, em kWh. Os resultados provenientes do modelo CCP são comparados com as necessidades de arrefecimento do edifício num determinado intervalo de tempo, sendo que do valor mínimo entre as necessidades de arrefecimento e o CCP, nesse mesmo intervalo de tempo, resulta o potencial útil de arrefecimento ou Useful Cooling Potential (UCP). O UCP representa a quantidade de energia que se poderá poupar no arrefecimento de um edifício fazendo uso de um determinado sistema de arrefecimento passivo. Nesta tese aplicaram-se os modelos suprarreferidos, a diferentes sistemas de arrefecimento passivos com recurso a ventilação, nomeadamente, ventilação direta, tubos enterrados, arrefecimento evaporativo, sistema de desfasamento térmico (phase shifter), e combinações entre estes. O modelo do CCP foi aplicado a cada um dos sistemas de arrefecimento passivo para uma base de dados climática horária da região de Genebra,
Suíça, para os anos de 2003 e 2004. Além disso, paralelamente, conduziram-se uma série de simulações através do software de simulação térmica TRNSYS. As simulações via TRNSYS foram conduzidas para a mesma base de dados climática utilizada no modelo do CCP. Estas simulações tiveram em conta a simulação integrada de cada um dos sistemas de arrefecimento passivo em foco, bem como as suas combinações para um edifício típico, onde se fez variar o tipo de isolamento, inércia térmica, ganhos internos, área de envidraçado e proteção solar exterior, resultando num total de 7,776 casos diferentes. Posteriormente, dos dados das necessidades de arrefecimento provenientes das simulações TRNSYS, para os casos em que não foram utilizados sistemas de arrefecimento passivos (casos de referência), e dos dados do modelo CCP, calculou-se o UCP. O UCP foi calculado tendo em conta dados horários, diários, semanais e mensais das necessidades de arrefecimento do edifício, e foi comparado com os resultados provenientes da simulação TRNSYS para cada um destes intervalos de tempo, para cada sistema de arrefecimento passivo e solução construtiva. Desta análise, verificou-se que que os dados das necessidades de arrefecimento para os quais o modelo do UCP produz os resultados da simulação via TRNSYS com menor erro são os dados diários. Nestes casos, o erro médio entre a poupança energética calculada através do TRNSYS e do modelo proposto é inferior a 1% (considerando a totalidade dos 7,776 casos). Nos casos em que se procedeu ao cálculo do UCP baseando-se em dados horários das necessidades de arrefecimento, o valor da poupança energética associada ao uso dos sistemas passivos é subestimado face aos resultados das simulações via TRNSYS. Para os casos em que se procedeu ao cálculo do UCP com base nos dados semanais e mensais das necessidades de arrefecimento, as poupanças via modelo UCP são sobrestimadas face aos resultados das simulações TRNSYS. No entanto, mesmo para o pior dos casos (dados horários das necessidades de arrefecimento), o coeficiente de correlação estatístico (R2) entre o modelo UCP e as simulações TRNSYS é superior a 0,95. Para o casos em que se utilizaram dados mensais das necessidades de arrefecimento, o valor de R2 é superior a
0,96. Assim, na primeira fase deste estudo, desenvolveu e validou-se um modelo capaz de estimar as poupanças energéticas associadas ao uso de diferentes sistemas de arrefecimento passivo por ventilação para uso em edifícios. O modelo não recorre a simulação térmica e é “independente das características do edifício”, sendo que para uso do mesmo, são apenas necessários os dados das necessidades de arrefecimento do edifício
em causa, sejam estes dados horários, diários, semanais e/ou mensais. Numa segunda fase, face à boa correlação entre o modelo UCP e as simulações TRNSYS, o modelo foi adaptado por forma a que pudesse ser expresso em unidades de energia por volume (kWh/m3), e dessa forma possibilitar o mapeamento do CCP a uma larga escala espaciotemporal. Nesta fase do estudo, através da adaptação do modelo do CCP e fazendo uso de uma base de dados climática de alta resolução espácio-temporal, foi possível realizar um mapeamento ao nível da Península Ibérica do potencial de arrefecimento passivo possibilitado pelo uso dos sistemas de ventilação direta e arrefecimento evaporativo em edifícios. A base de dados climática utilizada foi criada através do modelo numérico de mesoescala atmosférico para a predição climática Weather Research and Forecasting (WRF), forçado pela reanálise ERA-Interim e comtempla um total de 21870 pontos inclusos na Península Ibérica, para os quais existem registos horários das variáveis meteorológicas. Numa terceira e última fase deste estudo, visando o impacto das alterações climáticas no comportamento dos sistemas de ventilação direta e arrefecimento evaporativo, o modelo WRF, forçado pelo modelo do sistema terra EC-EARTH foi comparado face às simulações forçadas pela ERA-Interim, concluindo-se que as simulações forçadas pelo modelo EC-EARTH podem ser utilizadas para simulação do clima futuro. Assim, o modelo EC-EARTH foi utilizado para os climas presente e futuro, permitindo-se avaliar o efeito da mudança climática no potencial de arrefecimento passivo na Península Ibérica para estes sistemas. As simulações de clima futuro do modelo EC-EARTH integram os dados das concentrações de CO2 do Representative
Concentration Pathway scenario 8.5 (RCP8.5) do IPCC. Os resultados mostram que embora exista um decréscimo do potencial de arrefecimento passivo, devido ao aumento das temperaturas no final do século, este decréscimo é no máximo 40%. Por último, e de forma complementar, procedeu-se a uma análise comparativa entre os graus hora de arrefecimento para os climas presente e futuro, mostrando-se que os graus hora de arrefecimento aumentam em cerca de 2,5 vezes face ao presente, o que representa um aumento maior do que o decréscimo que se verifica no potencial de arrefecimento passivo para o clima futuro.
O modelo aqui desenvolvido, bem como as bases de dados que dele derivam, podem ser facilmente utilizados para estimar as poupanças energéticas associadas ao uso dos
sistemas de ventilação direta e arrefecimento evaporativo em edifícios na Península Ibérica. A metodologia aqui proposta pode ser utilizada noutras regiões e climas.
Palavras-chave: Arrefecimento Passivo; Potencial de Arrefecimento Climático;
Poupanças Energéticas de Arrefecimento; Recursos Renováveis de Energia; Península Ibérica
Publications list
This doctorate is based in the following original publications, which are reproduced in chapters 2, 3 and 4:
Paper 1:
Hugo Campaniço, Pierre Hollmuller, Pedro M. M. Soares (2014), Assessing energy savings in cooling demand of buildings using passive cooling systems based on ventilation, Applied Energy, Volume 134, Pages 426–438
Paper 2:
Hugo Campaniço, Pedro M. M. Soares, Pierre Hollmuller, Rita M. Cardoso (2016), Climatic cooling potential and building cooling demand savings: High resolution spatiotemporal analysis of direct ventilation and evaporative cooling for the Iberian Peninsula, Renewable Energy Volume 85, Pages 766–776
Paper 3:
Hugo Campaniço, Pedro M. M. Soares, Pierre Hollmuller, Rita M. Cardoso (2017), Impact of climate change on building cooling potential of direct ventilation and evaporative cooling: a high resolution view for the Iberian Peninsula. Submitted to Renewable Energy
1. Table of Contents
Acknowledgments ... a
Abstract ... i
Resumo ... iii
Publications list ... vii
List of Figures ... xiii
List of tables ... xvii
List of abbreviations and nomenclature... xix
1. Introduction ... 1
1.1. Research Questions ... 3
1.2. General approach ... 5
1.3. Contents ... 7
2. Assessing energy savings in cooling demand of buildings using passive cooling systems based on ventilation ... 9
Abstract ... 9
2.1. Introduction ... 10
2.1.1. State of the art ... 10
2.1.2. Objectives ... 13
2.2. Passive cooling with ventilation ... 14
2.2.2. Models ... 16
2.2.3. System configuration... 19
2.2.4. Ventilation rate, control and system size ... 21
2.3. Climatic cooling potential and energy savings in buildings ... 23
2.4. Integrated building simulation ... 27
2.5. Results and discussion ... 30
2.5.1. Effective savings ... 30
2.5.2. Dynamic over a typical week ... 33
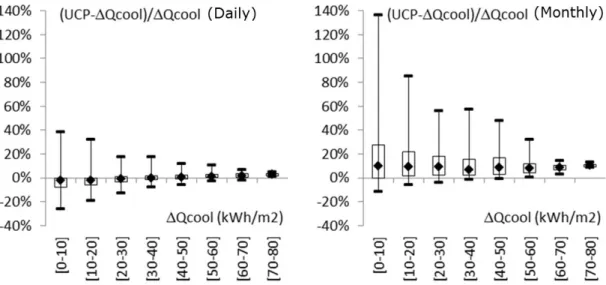
2.5.3. Simplified method versus numerical simulation ... 37
2.6. Conclusions ... 41
3. Climatic cooling potential and building cooling demand savings: high resolution spatiotemporal analysis of direct ventilation and evaporative cooling for the Iberian Peninsula ... 43
3.1. Introduction ... 45
3.1.1. Direct ventilation and evaporative cooling ... 45
3.1.2. Climatic cooling potential ... 46
3.1.3. Climate models ... 48
3.1.4. Objectives and outline ... 49
3.2. Methodology ... 49
3.3. Climate data ... 53
3.4. Results and discussion ... 54
3.4.1. Direct Ventilation Vs Evaporative Cooling ... 54
3.4.2. Sensitivity to air flow rate ... 59
3.4.3. Assessing Useful Cooling Potential ... 63
3.5. Conclusions ... 64
4. Impact of climate change on building cooling potential of direct ventilation and evaporative cooling: a high resolution view for the Iberian Peninsula ... 67
4.1. Introduction ... 70
4.2. Methodology and data ... 74
4.2.1. Methods ... 74
4.2.2. Climate Data: WRF high resolution simulations ... 76
4.2.3. Cooling Degree Hours ... 77
4.3. Evaluation of the historical present climate ... 77
4.3.1. Direct ventilation ... 78 4.3.2. Evaporative Cooling ... 81 4.4. Future Projections ... 82 4.5. Conclusions ... 92 5. Conclusions ... 95 References ... 99
List of Figures
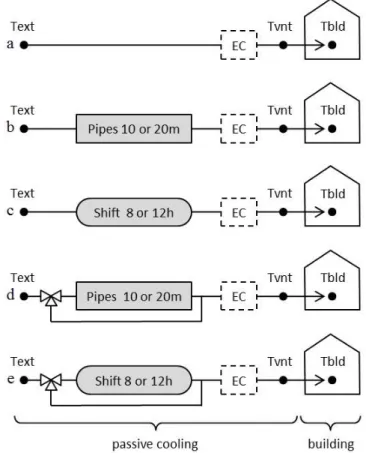
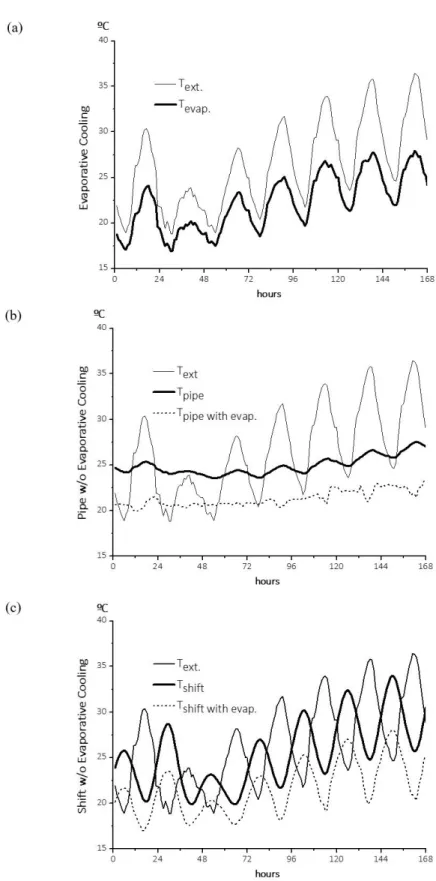
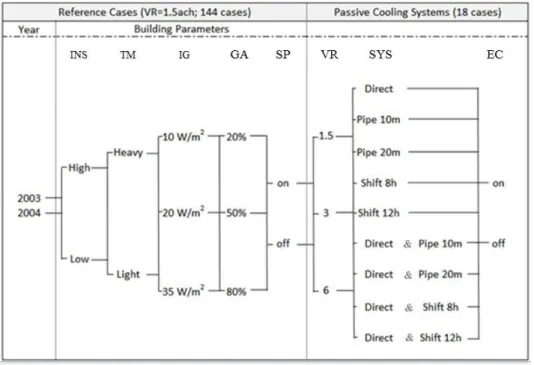
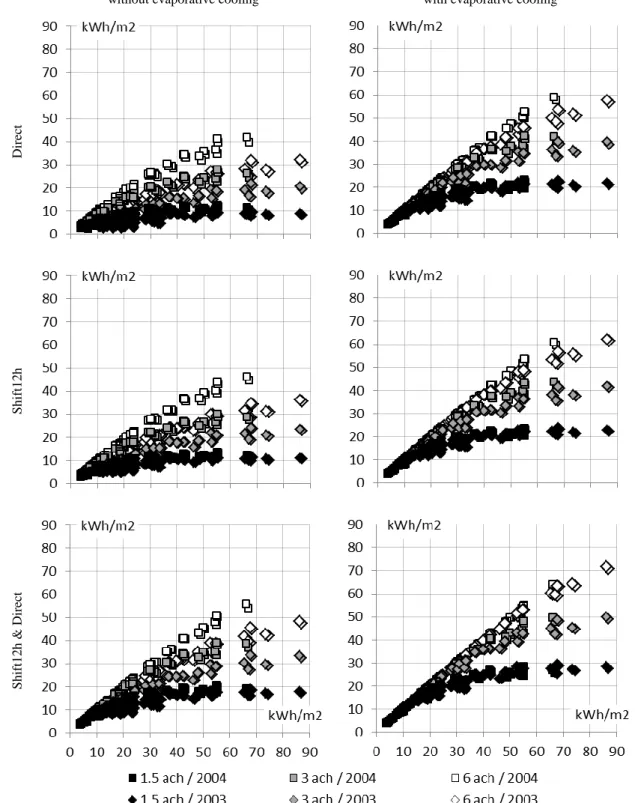
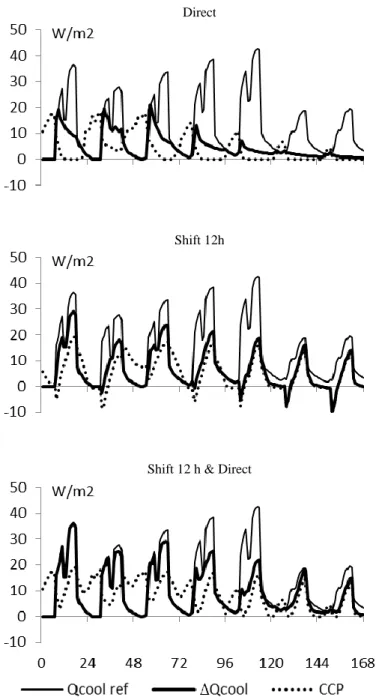
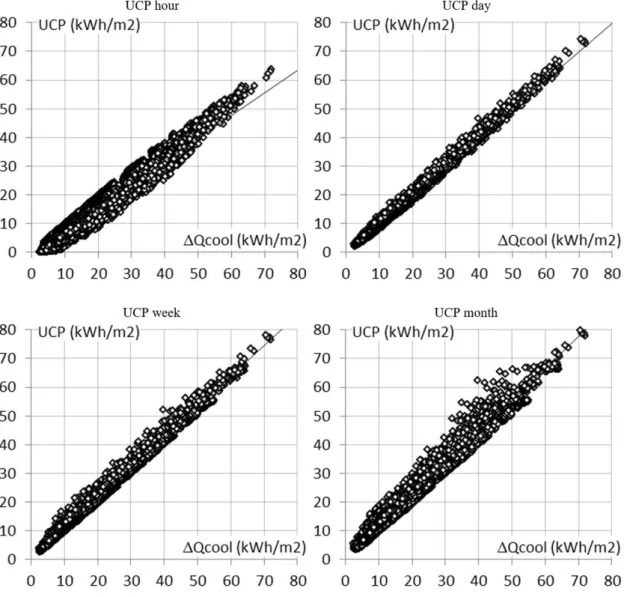
Figure 2.1. Schematic layout of passive cooling systems: (a) direct ventilation, (b-c) buried pipes and thermal phase-shifting, (d-e) buried pipes and thermal phase-shifting, combined with direct ventilation. All systems are considered with or without evaporative cooling (dashed box). ... 15 Figure 2.2. Simulated passive cooling systems on a hot summer week. External temperature and output temperatures for the different cooling systems: (a) evaporative cooling system (50% efficiency), (b) buried pipes system (20 m), with and without evaporative cooling, and (c) phase-shifter system (12 h), with and without evaporative cooling. ... 22 Figure 2.3. Schematic of UCP model ... 23 Figure 2.4. Schematic evolution and relation of climatic cooling potential (CCP) and useful cooling potential (UCP) over time, for 2 different rates of ventilation (left and right) and 3 different cooling demands. ... 27 Figure 2.5 Overview of the 7776 simulated combinations: 2 weather data sets, 72 buildings, 18 passive cooling systems, 3 flow rates / system sizes (INS: insulation; TM: thermal Mass; IG: internal Gains; GA: glazing area; SP: solar protection; VR: ventilation rate;.SYS: passive cooling system; EC: evaporative cooling). ... 27 Figure 2.6. Savings in cooling demand (∆Qcool: vertical axis) in function of cooling demand in absence of passive cooling (Qcool: horizontal axis) for the 72 reference buildings and the 2 meteorological data sets (144 reference cases). ... 31 Figure 2.7. Outdoor, building and ventilation temperatures (Text, Tbld, Tvnt), as well as ventilation flow rate and resulting cooling demand (m and Qcool) over a typical summer week. ... 33 Figure 2.8. Climatic cooling potential (CCP) and effective savings in cooling demand (∆Qcool), as well as cooling demand of reference case (Qcool ref) over a typical summer week. ... 35 Figure 2.9. Useful cooling potential (UCP) versus effective savings ∆Qcool, for the different passive cooling systems and buildings. ... 38
Figure 2.10. Relative error of the useful cooling potential (UCP) method (min, max, median, 2nd and 3rd quartiles), in daily and monthly basis, relatively to effective savings ∆Qcool. ... 40 Figure 2.11. Relative error of the useful cooling potential (UCP) method (min, max, median, 2nd and 3rd quartiles), in daily and monthly basis, relatively to the passive cooling fraction ∆Qcool/Qcool ... 41 Figure 3.1. Direct Ventilation´s CCP for reference and passive rates of ventilation of 1.5ach. Top: CCP´s monthly average values; Bottom: CCP´s monthly standard deviation, for the period 1989-2008. ... 55 Figure 3.2. Evaporative Cooling´s CCP for reference and passive rates of ventilation of 1.5ach. Top: CCP´s monthly average values; Bottom: CCP´s monthly standard deviation, for the period 1989-2008. ... 56 Figure 3.3. Relative difference (%) between CCP for evaporative cooling and direct ventilation for 1.5ach reference and passive rates of ventilation ... 58 Figure 3.4. Relative difference (%) between CCP for evaporative cooling and direct ventilation for 1.5ach reference and passive rates of ventilation for a region in the coastline and in the inland of the IP ... 59 Figure 3.5. Spatial statistics of CCP for direct ventilation: ratio between CCP for 6.0 and 1.5 ach (blue) and between CCP for 3.0 and 1.5 ach (red). ... 60 Figure 3.6. Spatial statistics of CCP for evaporative cooling: ratio between CCP for 6.0 and 1.5 ach (blue) and between CCP for 3.0 and 1.5 ach (red). ... 60 Figure 3.7. CCP (left axis) and CCP´s relative difference between evaporative cooling and direct ventilation (right axis) in an inland (top) and a coastal region (bottom) for different rates of ventilation. ... 62 Figure 4.1. CCP Direct Ventilation, 6.0 ach (1989 to 1999), average monthly values: (a) hindcast; (b) control. ... 79 Figure 4.2. CCP Direct Ventilation, 6.0 ach (1989 to 1999), average monthly values. Relative difference between hincast and control: 100*(hindcast - control)/control. ... 80 Figure 4.3. CCP Evaporative Cooling, 6.0 ach (1989 to 1999), average monthly values: (a) hindcast; (b) control. ... 81 Figure 4.4. CCP Evaporative Cooling, 6.0 ach (1989 to 1999), average monthly values. Relative difference between hincast and control: 100*(hindcast - control)/control. ... 82
Figure 4.5. CCP Direct Ventilation, 1.5 ach, future climate (2070 to 2100), average monthly values: (top) future values; (bottom) relative difference between future and historical values: 100*(future - historical)/historical... 83 Figure 4.6. CCP Direct Ventilation, 6.0 ach, future climate (2070 to 2100), average monthly values: (top) future values; (bottom) relative difference between future and historical values: 100*(future - historical)/historical... 85 Figure 4.7. CCP Evaporative Cooling, 1.5 ach, future climate (2070 to 2100), average monthly values: (top) future values; (bottom) relative difference between future and historical values: 100*(future - historical)/historical... 87 Figure 4.8. CCP Evaporative Cooling, 6.0 ach, future climate (2070 to 2100), average monthly values: (top) future values; (bottom) relative difference between future and historical values: 100*(future - historical)/historical... 89 Figure 4.9. Relative difference (%) between CCP for Evaporative Cooling and Direct Ventilation for 1.5ach reference and passive rates of ventilation for a region in the coastline and in the inland of the IP, for historical and future climate ... 90 Figure 4.10. Relation between yearly average CDH for future climate data set (vertical axis) and yearly average CDH for historical data set (horizontal axis). ... 91
List of tables
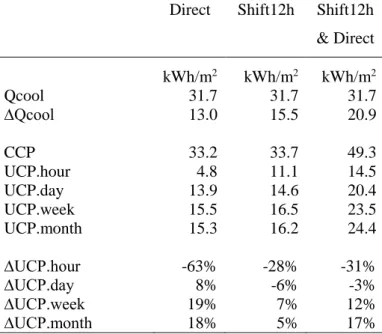
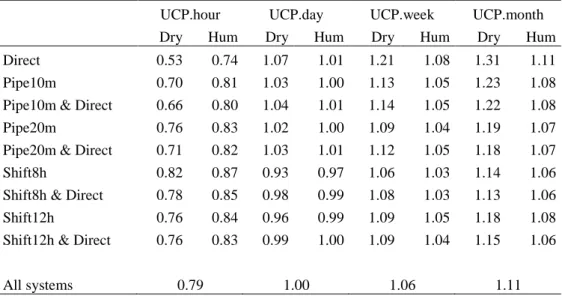
Table 2.1. Integrated savings in cooling demand for 3 passive cooling systems: i) reference cooling demand and effective savings (Qcool and ∆Qcool); ii) climatic and useful cooling potential (CCP and UCP), as well as relative error in relation to the effective savings. ... 36 Table 2.2. Average correlation (linear regression) between useful cooling potential UCP and effective savings ∆Qcool, for the different passive cooling systems, with and without evaporative cooling (Dry/Hum)... 39 Table 4.1. Relative difference between yearly average CDH for future and historical climates for the main urban centres in the Iberian Peninsula. ... 92
List of
abbreviations
and nomenclature
ach (air changes per hour (h-1))
AR (assessment report)
CCP (Climatic Cooling Potential)
CDH (Cooling Degree Hours (Kh)
E.U. (European Union)
ECMWF (European Centre for Medium-Range Weather Forecasts)
GCM (Global Circulation Model)
GHG (Greenhouse Gases)
HVAC (Heating Ventilation and Air Conditioned)
IPCC (International Panel on Climate Change)
RCM (Regional Climatic Model)
RCP (Representative Concentration Pathway scenarios)
UCP (useful cooling potential)
U.S. (United States)
Introduction
1. Introduction
Global Warming and its anthropogenic relation, as well as its damaging consequences, are no longer hypothesis, but instead scientific facts. The number of scientific publications related to Climate Change has more than doubled from 2005 to 2010. Between 1970 and 1990, the number of Climate Change related studies published in English was less than a thousand, but at the end of 2012, this number was already over 150 thousand [1]. These studies have shown the irrevocability of the global warming phenomena by anthropogenic actions, caused by emissions of greenhouse gases, especially CO2, and its threatening influence on Earth´s ecosystems as well as society. In fact, the scientific consensus about recent global warming as consequence of human activities is over 97% [2]. In 2012, renewable energies represented less than 12% of the World energy demand. The latter is increasing at an average of 1.40% per year [3] and world population at 1.13% [4]; since Earth is a finite system, it is impossible to endure with this paradigm, thus, the replacement of the non-renewable energy sources is crucial. Besides the finitude of fossil fuels, its use gives origin to most of the anthropogenic greenhouse gases emissions, which impacts on climate and ecosystems. The International Panel on Climate Change (IPCC) latter Assessment Report (AR5) [5] uses four different Representative Concentrations Pathways (RCP) to assess the Climate Change and its consequences due to the anthropogenic greenhouse gases (GHG) emissions. The RCPs are based on population size, economic activity, lifestyle, energy use, land use patterns, technology and climate policy, and vary from a lower GHG emission scenario to a high emission scenario. The AR5 shows a clear relation between the RCP scenarios and the projected temperature change till the end of the century, which is expected to rise in any of the scenarios considered. Even the stringent RCP scenario (RCP2.6) projects a global
Introduction
mean surface temperature increment between 0.3°C and 1.7°C by the end of the century (2081–2100), relatively to 1986–2005. The effect of climate change is believed to imply the occurrence of warmer temperatures, decrease in precipitation levels in mid-latitude and subtropical dry regions and increased precipitation in mid-latitude wet regions, as well as an increase in ocean acidification [5]. These consequences will negatively affect marine and terrestrial species as well as their habitats, food production, heath and economy. The current energy mix is far from being a viable solution to ensure a sustainable future. The implementation of clean and unlimited energy sources is vital and should be done at a large scale, ideally, in a short term.
Buildings are the largest energy consuming sector worldwide, representing nearly 40% of the energy consumption in the E.U. and the U.S., of which over 50% is due to space heating and cooling. [6] Although space heating may represent a bigger ratio then space cooling (~68% of energy demand dedicated to space heating and cooling in U.S. residential and commercial buildings is due to space heating) [7], the warming climate issue will further boost the implementation of air conditioned devices and will increase the number of cooling operating hours in order to maintain comfort levels. Therefore, building space cooling is an important issue concerning global energy demand and climate change. Here emerges the scope of the present thesis, which aims to fill some of the gaps in the existing literature, by contributing to the state of the art knowledge concerning building cooling demand reduction given by ventilated passive cooling systems.
A passive system can be considered as any system that operates or performs a specific function without any or nearly any need for an external source of energy besides the ones which are naturally and “permanently” available [8]. In this sense, a passive cooling system or device is any system or device that can promote heat losses or decrease the heat gains from a certain system, such as a building, without any need for an additional energy source beyond those which are naturally and permanently available. In literature, the Solar and Heat Protection Techniques are considered passive cooling techniques [9], although the application of these techniques does not promote the extraction of heat from inside a building, but they will reduce the amount of heat that is transferred to the building. These techniques are extremely important, once they can drastically reduce the heat gains
Introduction
and therefore decrease the cooling loads; however, they cannot suppress the dependence on cooling devices alone. These techniques can include shading, insulation, radiative cooling, and control of internal heat gains, among others [10]. Other techniques, which promote heat losses, are often referred as heat dissipation techniques. They use low temperature heat sinks/reservoirs to dissipate the excess of heat from the building [11]. The most important heat sinks/reservoirs are the atmosphere, lakes and oceans and the lithosphere [12]. This study will be focused on the heat dissipation techniques, more specifically the following ventilated passive cooling systems; direct ventilation, evaporative cooling, buried pipes, and the thermal phase shifting. A full description and a state of the art review of these systems is available in chapters 2, 3 and 4 of this document.
1.1. Research Questions
The literature concerning passive cooling systems is vast and rich, mostly proving a great potential inherent to the use of such systems, both from energetic and economic points of views. Still, the behavioral analysis of these systems, such as their efficiency on reducing cooling loads in a particular building in a given region, is attached to the use of complex simulation tools. The integration of the passive cooling systems in thermal simulation tools requires expertise and the fundamental knowledge on the passive cooling systems. The latter fact tends to restrict and diminish their implementation. Only a few studies sought to provide ways to overcome this difficulty. In fact, none of the existing literature has focused on proposing a simple but precise evaluation method/model able to predict the cooling demand savings in buildings, associated to the use of ventilated passive cooling systems. Ideally, to overcome these difficulties, such method should be independent of building properties and not require the use of thermal simulation tools. Hence, here rises the first research questions addressed in this thesis:
For the case of passive cooling systems based on ventilation, is it possible to compute a climatic cooling potential as a function of meteorological data, independently of any building properties? If so, how can it be linked to the cooling load of a particular building, for yielding of the associated useful cooling potential?
Introduction
Development and validation of such a model would constitute a valuable tool for HVAC companies to use and thereby conduct knowledgeable proposals to consumers, involving solutions apart from the conventional ones (i.e. air conditioned devices), which in turn, would have a substantial contribution towards the implementation of passive cooling systems and therefore in reducing the global demand for fossil fuels. Moreover, enhancement of such a model could allow a comprehensive characterization of some passive cooling systems at a large spatiotemporal scale. Therefore, a valuable data set, comprising geographical information regarding cooling demand savings associated to use of a certain passive cooling system in any building, could be established. This leads us to the 2nd research question:
In the case of the Iberian Peninsula, how do the climatic cooling potential of direct ventilation and evaporative cooling behave and compare in present climate?
Even in the case where the aforementioned data set is available, a question still remains. Climate is changing and getting warmer, which will likely affect the contribution of the ventilated passive cooling systems for cooling demand reduction in buildings. Therefore, it is important to assess the effects of climate change in passive cooling systems and the cooling demand reduction that they provide, namely, whether they still worth the investment from an energetic/ecological point of view. This leads to the 3rd and final research question covered by this thesis:
In the case of the Iberian Peninsula, what could be the impact of climate change on the cooling potential of direct ventilation and evaporative cooling?
Summarizing, the purpose of this thesis is to create knowledge related to the use of ventilated passive cooling systems, by introducing innovative and validated methodologies, from which one can easily assess cooling demand reduction in buildings. This will also hopefully contribute to increase the implementation of such systems at a large scale and consequently contribute to a sustainable energetic paradigm, by reducing fossil fuels dependency and hence mitigating GHGs emissions.
Introduction
1.2. General approach
This section succinctly describes the backbone of the methodology followed in this work, providing an overview over the approach used to tackle the research questions. The detailed methodology, namely its analytic components, is explicit in papers 1, 2 and 3, which contents are reproduced in the chapters bellow.
Building thermal behavior and ventilated passive cooling systems behavior are strongly related to local climate. Therefore, to characterize the ventilation systems, there is the need for detailed climate observations. The literature concerning passive cooling systems is vast, still, only a few studies aimed to the characterization of these systems in terms of their potential at a large spatiotemporal scale, relating it with the cooling demand savings in buildings. Artman et al [13] proposed a climatic index named climatic cooling potential (CCP), and defined it as the summation of products between building and external air temperature-differences and time interval. This index was computed for the case of night time direct ventilation for several locations across Europe, however, no relation between CCP and effective savings was established. Other studies, concerning the potential of passive cooling systems either rely on thermal simulation software [14], or do not establish a relation between the CCP and the cooling demand savings in buildings [15, 16]. To overcome these difficulties, in a first phase of this study (2nd chapter), a methodology linking the CCP potential for several ventilated passive cooling systems and cooling demand savings is established and validated. Then, in chapter 3, the proposed methodology of 2nd chapter is applied to a high-resolution regional climate simulation. These regional climate simulations were performed using the state-of-the-art atmospheric mesoscale numerical weather prediction system WRF (Weather Research and Forecasting) as a regional climate model (RCM) [17]. The WRF simulation presented in chapter 3, for the Iberian Peninsula was forced by the Interim reanalysis [18]. ERA-Interim is a global atmospheric reanalysis which is continuously updated in real time and its produced by the European Centre for Medium-Range Weather Forecasts (ECMWF) which uses the atmospheric model and data assimilation system Integrated Forecasting System (IFS). The spatial resolution of the data set given by the ERA-Interim reanalysis is approximately 80km for the full globe. The WRF simulation was performed at 9 km resolution and covered the full Iberia. Its results were used and evaluated in diverse
Introduction
studies, such as temporal distributions of Portuguese temperature [19, 20] and Iberian solar resources [21]. The output form de WRF model forced by the ERA-Interim reanalysis, particularly, surface temperature (2m), specific humidity (2m) and surface atmospheric pressure, are used as input in chapter 3 to compute the CCP of direct ventilation and evaporative cooling for the period 1989-2008 with a 9 km (WRF9km) horizontal grid spacing for the full Iberian Peninsula.
To assess the climate change impact on the CCP for direct ventilation and evaporative cooling, in chapter 4, the WRF RCM model was forced by the EC-EARTH GCM. The EC-EARTH is an Earth System Model based on the prediction system of ECMWF, it consists of an atmospheric and an ocean model. The EC-EARTH can be forced by different GHGs concentrations scenarios, and other variables, which result in changes in the atmospheric and ocean circulation models at global and regional scales [22]. The EC-EARTH model´s spatial resolution is approximately 120km, and like ERA-Interim covers the full globe. In a first step, and to evaluate the WRF-EC-EARTH simulation, the CCP for direct ventilation and evaporative cooling given by the WRF-EC-EARTH input for present climate is compared to one given by the WRF-ERA-Interim. Finally, a simulation for future climate using WRF model forced by the EC-EARTH for the period 2070-2100, is used to assess the climate change impact on the CCP. In this latter case, the EC-EARTH model uses the CO2 atmospheric concentration levels as defined by the RCP 8.5 from the IPCC latter Assessment Report AR5 for the period 2070-2100 [5]. The RCP8.5 assumes high population with low energy intensity improvements, which in the long term, leads to high energy demand and GHG emissions. It corresponds to the IPCC scenario with the highest greenhouse gas emissions.
Introduction
1.3. Contents
In order to meet the research questions presented earlier, the next chapters of the current thesis are composed as follows:
Chapter 2: Here a model attempting to answer the first research question is created and
successfully validated over 7776 simulations. This chapter constitutes the first original paper published.
Chapter 3: In this chapter a redefined concept of the Climatic Cooling Potential is
proposed and its use for evaporative cooling and direct ventilation over a large spatiotemporal scale is presented, successfully addressing the 2nd research question of this thesis. From this study a second paper was published.
Chapter 4: In order to address the 3rd and final research question of this thesis, chapter
5 focus on the climate change effect on some ventilated passive cooling systems output for Iberia. The contents of this chapter allowed the preparation of a third paper that is presently submitted.
Chapter 5: Is the final chapter of this thesis and where the main conclusions of the present
2. Assessing energy savings in cooling demand of
buildings using passive cooling systems based on
ventilation
Abstract
The objective of this article is to develop and test a simplified method to compute the savings in building cooling demand by use of passive cooling systems based on ventilation (direct night ventilation, air-soil heat exchangers, controlled thermal phase-shifting, evaporative cooling, as well as possible combinations thereof). The systems are characterized in terms of a climatic cooling potential, independently of any building, which is then compared to the cooling load of a particular building. The method is tested against an extensive numerical simulation campaign, combining diverse passive cooling systems and sizes with diverse constructive and operational modes for an administrative building situated in Geneva. The key point of the simplified method is to choose an appropriate time resolution, for taking into account the building thermal inertia. Although best results are obtained with a daily resolution, good results are also obtained with monthly data, where an overestimation of the passive cooling fraction remains less than 20% in half of the cases. This opens way for using the method for first assessing the potential of these passive cooling techniques on a large spatiotemporal scale, for which integrated building and system simulation becomes prohibitive.
Keywords: passive cooling; climatic cooling potential; useful cooling potential; effective
2.1. Introduction
2.1.1. State of the art
In most parts of Europe, electricity demand for air-conditioning of buildings is in rapid increase [23, 24], and will be further boosted by the global warming issue [25, 26]. Mitigation of this demand requires as well adequate architectural and constructive measures (reduction of the solar and internal gains, access to the thermal mass), as development of passive cooling techniques. Such techniques make use of naturally available heat sinks, which are usually closely related to local meteorological variables. The viability of such systems/techniques has been proved in several works, either by the use of simulation tools or in situ measurements [12]. State of the art can be divided in studies of effectiveness, implementation, modelling and prediction of the cooling demand reduction in buildings by the use of the referred passive cooling techniques.
Within this study, we will focus on passive cooling systems which are linked to ventilation, namely direct ventilation, evaporative cooling, buried pipes and phase-shifter. The simplest of the mentioned techniques and certainly the most widely used is direct ventilation. Direct ventilation techniques use the ambient cool air to reduce the building´s inner temperature, therefore the building´s structure is used as a heat sink, allowing the inside air temperature to be reduced. Direct ventilation can be mechanically forced (by fans), natural (by openings and use of thermal gradients) or both natural and mechanic [13]. The use of direct ventilation to cool a building is often used during the night period and is referred as night cooling. The direct ventilation cooling effect on the reduction of cooling loads depends on three main parameters: the difference between indoor and outdoor temperatures (mostly during the night), the air flow rate, and the building´s thermal mass [27]. The effectiveness of night ventilation techniques on the reduction of the cooling loads of a building has been proven in several studies [28-31]. As a second technique, evaporative cooling is a process where the latent heat of vaporization of water is used. Evaporative cooling can be direct or indirect. Direct evaporative cooling is the process where cooled and humidified air is directly brought into the building. This process can have low efficiency in the case of humid climate, where air can be close to its saturation point. In order to improve the cooling efficiency the air is sometimes forced into a membrane that allows separation of the water vapor from the air. The indirect
evaporative cooling is a similar process but using a heat exchanger (permeable wall) between the air flow and the cooled air, allowing the air inside a room to cool down without increasing its humidity, therefore decreasing the eventual condensation and the consequent release of heat into the room [32]. The evaporative cooling techniques have been largely studied and its efficiency has been shown both from technical and economical stand points [33-36]. It is expected that the indirect evaporative cooling systems will take up 20% of the air-conditioning market in buildings in the next 20 years in particular for the dry and hot climes [37]. The third technique, namely buried pipes or earth to air heat exchangers, act like a damper for the outside temperatures, so that at times of the day when temperatures are high the outlet air is at a lower temperature. There are several modelling and validation studies of buried pipes systems [38-42], as well as on its economic viability and effectiveness on the reduction of buildings cooling loads [43-45]. Finally, thermal input signal delay or phase shifting is a phenomena first discovered in a study concerning a buried pipes system [46]. The thermal phase-shifting device is a storage device where the storage material is homogeneously distributed within a ventilating duct in order to increase the heat-transfer surface of inlet air, and to decrease the penetration distance to thermal mass. In this way a homogeneous airflow and a good convective exchange are provided, permitting to delay the day/night temperature´s oscillation almost without dampening, and allowing the night cooling peak to be available in the middle of the day [47].
All of preceding systems are linked to the ventilation system of the building (possibly with some thermal storage) so as to activate the available cooling resource and distribute it within the building. As will be mentioned further down, several analytical and numerical models allow computing the achievable cooling temperature of these systems in a particular climatic situation, in function of specific design properties. However, determination of the effective cooling potential for a particular building usually needs further integrated dynamic building simulation, with ventilation from the available cooling source [28, 48].
Despite the extensive literature and numerous validation models on the referred techniques, a model relating the output temperatures from a given passive cooling system and the cooling demand savings in a building has not yet been developed in a way
independent of building thermal simulation. Ideally such a model would enable the computation of the cooling demand savings in buildings by the use of the aforementioned passive systems in a simplified and accessible way without the need for detailed knowledge on thermal simulation software and of the building properties. In this regard, Artmann et al [13] proposed a new integrated index named “climatic cooling potential” (CCP), defined as the summation of products between building and external air temperature-differences and time interval, that was computed for several locations across Europe. Their results pointed out that for the Northern Europe there is a very significant potential for passive cooling by night-time ventilation, and that even in some regions of Southern Europe the climatic cooling potential is still significant. Nonetheless, these authors didn’t address the relation between potential and effective savings, not emphasizing that even high CCP may have low utility (if there is no cooling needs then even a high CCP represents zero savings). Furthermore, the CCP was computed regardless of any building properties, such as internal gains, cooling demand, thermal inertia and insulation. Finally, the CCP was computed for night cooling only, neglecting some eventual day time potential that may be useful.
Another study in that direction was developed by Belarbi et al [14]. These authors suggested two approaches in order to evaluate the passive cooling potential. The first one is independent of any building characteristics, and the second is based on thermal simulation of the building. Both methodologies provide helpful information on the viability of the passive cooling techniques, however, the first only characterizes the “effectiveness” of a certain passive cooling system relatively to different climatic zones. The second approach allows a more detailed view, nevertheless, it requires expertise and detailed knowledge on thermal simulation software and of the building properties. A more recent study by V.I. Hanby et al [15] used UK climate projections (UKCP09) to access the wet-bulb depression and the effects of climate change on the performance of evaporative cooling systems. They simulated a simplified single zone building model combined with an evaporative cooling plant. The results provided by simulations showed that the evaporative cooling plant was able to decrease the cooling demand, however this decrease was lower than the one provided by the meteorological evaporative potential. Nevertheless, it was concluded that the evaporative cooling systems are a viable solution
for cooling buildings presently and in the context of a changing climate. Although, this study showed a comparison between the potential provided by the weather data and the simulated building, no relation between savings and potential was established. Additionally, the evaporative cooling potential was simulated only for the summer period (taken as April to September) and for the occupation hours (07:00 to 19:00), neglecting some eventual potential, mostly during night, which might be used to take advantage of the building´s thermal inertia decreasing the cooling loads on the day after.
A.T.Nguyen et al [16] presented a method to assess the thermal comfort using passive systems (natural ventilation and passive cooling). This method was applied for the hot humid climate of Vietnam, and it relies on the selection of an appropriate comfort zone on a building psychometric chart, the extraction of data from the chart and printing, and on the analysis and assessment of thermal comfort, heating and cooling potential of passive strategies. It is a helpful tool for a quick assessment of the availability of thermal comfort by way of passive systems. Regardless of the simplicity of the method and its applicability do different climates, the results only express the potential percentage of time within thermal comfort that can be achieved in a certain climate using some passive systems, not relating it with savings in energy demand. Furthermore, in the referred study the method was not validated against simulations or in situ measurements, which raises questions regarding its effectiveness.
2.1.2. Objectives
The main goal of this paper is to develop and test a performance indicator for passive cooling systems based on ventilation. This indicator, to be called climatic cooling potential, should be sufficiently robust to allow the estimation of the potential savings in cooling demand of buildings, without need for integrated building-system simulation. The fundamental outcome of such an indicator is, for ongoing work, to allow the characterization of the diverse cooling techniques on a large geographical area (some hundreds of km) and a large time horizon (some decades, including future climate change scenarios), for which overall building simulation becomes computationally unaffordable, due of the many possible architectural and operational configurations. In this sense, the
objective of the climatic cooling potential is not to replace integrated building simulation, which will give finer results, but to allow for rough estimation of the potential of the aforementioned cooling techniques on a large geo-referenced spatial and temporal scale.
For this purpose, we will develop a method which allows: i) to characterize the diverse passive cooling techniques linked to ventilation in a coherent way, independently of any building, in terms of output temperature and associated airflow; ii) in a second step, to evaluate their effective contribution in terms of thermal energy savings for a particular building, as characterized by its cooling demand in absence of passive cooling. In this respect, one of the crucial points is to determine the time step at which the cooling sources (and separately the building cooling demand) have to be characterized. For this sake, the simplified method developed hereafter will be validated against integrated building simulation, for the case of an administrative building located in Geneva, for an important set of passive cooling techniques, as well as a variety of constructive and operational configurations (solar protection, thermal mass and insulation, internal gains).
This paper is organized as follows. In section 2.2 we present the studied cooling passive systems, as well as their physical properties and a brief reference to related analytical models. section 2.3 is devoted to the description of the proposed method, which allows the computation of the climatic cooling potential and the associated cooling demand saving. For the sake of validation, in section 2.4 the method will be compared to integrated building-system simulations. Section 2.5 shows a brief description on the behavior (provided by integrated simulation) of some of the passive systems, followed by the results and validation of the proposed method. Finally, the main conclusions of the present study are presented in section 2.6.
2.2. Passive cooling with ventilation
2.2.1. System description
As an alternative to direct ventilation, for which the available cooling temperature is given by the outdoor condition, we will consider two types of passive cooling systems based on
thermal storage of the meteorological day/night oscillation that is carried by ventilation (figure 2.1).
Figure 2.1. Schematic layout of passive cooling systems: (a) direct ventilation, (b-c) buried pipes and thermal phase-shifting, (d-e) buried pipes and thermal phase-shifting, combined with direct ventilation. All systems are considered with or without evaporative cooling (dashed box).
The first concerns air-soil heat exchangers, in which the air passes through an array of pipes buried under or next to the building, for the meteorological day/night oscillation to be dampened by charge/discharge in the soil. Previous work allowed for the analysis of several case studies, as well as for development of well validated numerical and analytical models [38, 39, 46, 47]. As the daily heat wave propagation around the pipes extends on approximately 15-20 cm, latter can be arranged in a compact geometry, with inter-axial distance of approximately 50 cm, immediately under the building, if necessary in multiple layers. Although such systems may in principle also be designed for dampening of the summer/winter oscillation, the associated size (approx. 2 m depth and 4 m inter-axial distance) generally turns out incompatible with the available soil, at least in urban context and for buildings of a certain size.
As a second storage technique, we will consider controlled thermal phase-shifting, a device in which the storage material is homogeneously distributed within the ventilating duct, in order to increase the heat-transfer surface and to decrease the penetration distance to the thermal mass. Providing a homogeneous airflow and a good convective exchange, it becomes possible to delay the day/night oscillation almost without dampening, for the night cooling peak to be available in the middle of the day. This technique, which arises from a theoretical work, recently gave rise to the development of a first series of lab prototypes [49].
As an optional downstream complement to preceding techniques (or to direct ventilation), we will finally consider direct evaporative cooling, for further decrease of the air temperature brought to the building by ventilation.
2.2.2. Models
Within this study, modeling of the thermal storage systems (buried pipes, thermal phase-shifting) is performed by way of previously developed and validated analytical models, for a constant airflow. In the case of buried pipes [47], a set of two coupled differential equations account for the convective heat exchange between air and pipe, as well as cylindrical heat diffusion in the soil around the pipe, with adiabatic boundary condition at inter-axial pipe-pipe distance. In the case of the phase-shifting device [49], the physical phenomenon under consideration takes place in a thermal storage similar to a packed-bed, with storage elements sufficiently small for their individual temperature to be regarded as homogeneous (no intra-element temperature gradient), leading to a simplified set of differential equations known as the Schuman model.
In both cases, the core of the model concerns the case of a sinusoidal temperature input:
) cos( 0 0 t T x (Eq.2.1)
Explicit resolution of the associated set of differential equations leads to following temperature output, which is characterized by amplitude-dampening and phase-shifting of the input signal:
a a a a a c m k S v x t m c h S T cos ( ) exp 0 (Eq. 2.2)
In preceding equations, 𝑚̇ (kg/s) and va (m/s) are the airflow rate and velocity, and ca
(J/kg.K) the specific heat of air.
In the case of the buried pipes S=2πr0 x is the pipe exchange surface, with r0 (m) its radius
and x (m) its length. The amplitude-dampening and phase-shifting coefficients h (W/K.m2) and k (W/K.m2) account for the serial link of (i) convective heat exchange between air and pipe; (ii) heat diffusion in the soil around the pipe. They are given by decomposition in real and imaginary part of:
ik h h h h h s s 0 0 (Eq. 2.3a) Where: 0 1 0 0 0 1 0 0 0 1 0 1 0 1 0 1 ) 1 ( ) 1 ( ) 1 ( ) 1 ( ) 1 ( ) 1 ( ) 1 ( ) 1 ( ) 1 ( ) 1 ( R i I r i K R i K r i I R i I r i K R i K r i I i hs s
(Eq.2b)
2as
(Eq. 2.3c)
In preceding equations h0 (W/K.m2) is the air-pipe convective exchange coefficient, λs
(W/K.m) and as (m2/s) are the thermal conductivity and diffusivity of the soil, r0 (m) is
the pipe radius and R0 (m) the total pipe and soil radius (half of the inter-axial distance
between the pipes). In and Kn are modified Bessel functions of order n.
In the case of the phase-shifting device, S represents the total exchange surface of the particles over the system length x. In this case, the amplitude-dampening and phase-shifting coefficients h (W/K.m2) and k (W/K.m2) account for the serial link of (i) convective heat exchange between air and pipe; (ii) heat storage in the particles. They are given by: 2 2 0 2 0 s s k h k h h (Eq. 2.4a) 2 2 0 2 0 s s k h k h k (Eq. 2.4b) s s s s s S V c k (Eq. 2.4c)
In preceding equations h0 (W/K.m2) is the air-particle convective exchange coefficient,
Vs (m3), Ss (m2), cs (J/K.m3) and ρs (kg/m3) are the volume, exchange surface, specific
For the case of hourly meteorological data over an entire year, Fourier analysis allows to decompose the input temperature into a complete sum of harmonics (from yearly up to hourly frequency), so that the hourly system output temperature can be recomposed by applying preceding models to each one of the harmonics.
Finally, as a complement to these storage techniques (or to direct ventilation from outdoor), evaporative cooling is modelled by:
wet in
in T T
T
T
(Eq. 2.5)
In preceding equation Tin is the input temperature of the evaporative cooling device (given
by outdoor, buried pipe or phase-shifting), Twet is the associated wet-bulb temperature,
and η the evaporative cooling efficiency.
In the following, the results of these models will be used: (i) for determination of the climatic cooling potential of these techniques, independently of any building (section 2.3); (ii) as an input to building simulation, for determination of the effective savings in cooling demand (section 2.4).
2.2.3. System configuration
In the case of buried pipes, we will here adopt a configuration which consists of 12 cm diameter pipes with 50 cm inter-axial distance, for a specific airflow of 100 m3/h per pipe (2.5 m/s). According to the model, with such a configuration and a typical soil (1.9 W/K.m conductivity, 1.9 MJ/K.m3 heat capacity) a 10 m pipe reduces the day/night input amplitude to 41%, whereas a 20 m pipe reduces it to 17% (exponential damping), with a phase-shift which remains lower than an hour (figure 2.2b).
In the case of the thermal phase-shifting device, we will here adopt a configuration which consists of 16 mm diameter PVC tubes that are filled with water, piled up perpendicular
to the airflow, with 2 mm spacing between tubes. With a duct cross-section of 50 x 50 cm subject to a specific flow of 100 m3/h (0.39 m/s average interstitial velocity between tubes), the system enables an 8 h phase-shift within 1.6 m length, respectively a 12 h phase-shift within 2.4 m (linear phase-shifting), for a residual amplitude higher than 80% (figure 2.2c). Note that his system not only differs from the buried pipes in terms of thermal behavior, but also in storage volume, which is almost 10 times inferior.
As can be seen in figure 2.2 b and c, the outlet of the thermal storage systems is at times warmer than the ambient air, in particular at night. It hence becomes interesting to combine the use of the aforementioned storage systems with direct ventilation, taking at each moment the cooler of the two sources (however, such a setup requires a second ventilation fan, since the thermal storage needs to be regenerated at night). We hence will consider following passive cooling systems/configurations, as schematically depicted in figure 2.1:
• Direct: direct ventilation from outdoor
• Pipe10m: 10 m buried pipes, resulting in 41% residual amplitude of day/night oscillation
• Pipe20m: 20 m buried pipes, resulting in 17% residual amplitude of day/night oscillation
• Shift8h: 8h thermal phase-shifting device • Shift12h: 12h thermal phase-shifting device
• Pipe10m&Direct: combination of 10 m buried pipes with direct ventilation • Pipe20m&Direct: combination of 20 m buried pipes with direct ventilation • Shift8h&Direct: combination of 8 h phase-shifting with direct ventilation • Shift12h&Direct: combination of 12 h phase-shifting with direct ventilation
We finally consider direct evaporative cooling as an optional complement to the preceding techniques (dashed box in figure 2.1), which will be simulated with a constant efficiency of 50% (humidification up to 50% of the potential, as given by the difference between dry and wet bulb temperatures). As a result, we end up with 18 possible passive cooling systems (9 combinations of thermal storage and direct ventilation, with or without evaporative cooling). For a representative set of these systems, figure 2.2 shows the simulated temperature dynamic over a hot summer week, as simulated with meteorological data of Geneva.
2.2.4. Ventilation rate, control and system size
Like for direct night ventilation, in which the airflow may be increased at night to bring fresh air into the building, we can consider the preceding systems with a larger airflow rate than the strict minimum air-change value, as long as the system output temperature is lower than the one of the building. So as to maintain the same system performance (same output temperature), such increased ventilation strategies obviously imply proportional sizing of the evaporative cooling unit as well as of the storage device (buried pipe, phase shifter). Such increased ventilation strategies also imply electric overconsumption, which is to be kept as low as possible. While we will limit our study to the thermal contribution of such systems, we stress that the problem of electricity should eventually be studied carefully.
Figure 2.2. Simulated passive cooling systems on a hot summer week. External temperature and output temperatures for the different cooling systems: (a) evaporative cooling system (50% efficiency), (b) buried pipes system (20 m), with and without evaporative cooling, and (c) phase-shifter system (12 h), with and without evaporative cooling.
2.3. Climatic cooling potential and energy savings in buildings
While, for a given climate, the passive cooling systems can be simulated and characterized independently of any building, their effect on the cooling demand of a particular building must in principle be determined by way of integrated dynamic building´s simulation (with ventilation temperature given by the associated passive cooling system). As an alternative, we here develop a simplified method for assessing these energy savings from the knowledge of: i) the characteristic of the passive cooling system, in terms of a climatic cooling potential (CCP) which relates to the temperature of the cooling source and the associated airflow; ii) the characteristic of the building, merely and alone in terms of its cooling demand (Qcool) in absence of passive cooling. Comparison of both values on an appropriate time step leads to the useful cooling potential (UCP) of the passive cooling system for the specific building. The method, which is developed below, is schematically depicted on following flowchart (figure 2.3).
Figure 2.3. Schematic of UCP model
The first step, for a given passive cooling system and associated airflow, is to define its climatic hourly cooling potential (CCP), which expresses the cooling load that the system can bring to a building as compared with ventilation at standard reference flow rate from outdoor:
𝐶𝐶𝑃 = 𝑐𝑚(𝑇𝑠𝑒𝑡− 𝑇𝑣𝑛𝑡) − 𝑐𝑚𝑟𝑒𝑓(𝑇𝑠𝑒𝑡− 𝑇𝑒𝑥𝑡) 𝑚 = {𝑚𝑣𝑛𝑡 𝑖𝑓 𝑇𝑣𝑛𝑡 < 𝑇𝑏𝑙𝑑
𝑚𝑟𝑒𝑓 𝑖𝑓 𝑇𝑣𝑛𝑡 ≥ 𝑇𝑏𝑙𝑑
(Eq. 2.6)
In equation 2.6: CCP is the climatic cooling potential for a given hour, in kWh; c is the heat capacity of air in kWh/K.kg; m and mref are the rate of ventilation and the reference
rate of ventilation in absence of passive cooling, respectively, both in kg/h; Tset is the
building´s set point temperature in °C; Tvnt is the hourly average output temperature of a
given passive cooling system in a given hour, in °C; Text is the hourly average outdoor
temperature in a given hour, in °C; mvnt is rate of ventilation for a given passive cooling
system, in kg/h; Tbld is the building´s hourly average temperature in a given hour, in °C.
Note that the CCP is computed by using Tset (typically 26°C) instead of the effective
building temperature, of which there is no prior knowledge (see discussion further down). It is in this sense that CCP represents a climatic index (dependent on the climate under consideration, the passive cooling system and the flow rate, as well as the comfort set point), independently of any building´s characteristics.
As discussed before, the enhanced flow rate mvnt is reduced to the reference value mref
when its temperature exceeds that of the set point. In this regard, the CCP can also be expressed by:
𝐶𝐶𝑃 = 𝑐𝑚𝑟𝑒𝑓(𝑇𝑒𝑥𝑡− 𝑇𝑣𝑛𝑡) + 𝑐(𝑚𝑣𝑛𝑡− 𝑚𝑟𝑒𝑓)(𝑇𝑠𝑒𝑡− 𝑇𝑣𝑛𝑡)+ (Eq. 2.7)
In the latter expression, reduction of the airflow is taken into account by considering only the positive values of the second term. As compared to the reference case, the climatic cooling potential of the passive system hence divides in: i) a first term concerning the reference flow rate, which relates to the input – output temperature differential of the passive cooling system; ii) a second term concerning the additional flow rate, which relates to the set point – system temperature differential, and which is only active when