The term structure of credit spreads in
syndicated loans
A comparative analysis between Corporate Control, Capital Structure and Project Finance loans
Trabalho Final na modalidade de Dissertação apresentado à Universidade Católica Portuguesa
para obtenção do grau de mestre em finanças
por
José Pedro Ferreira Coelho
sob orientação de João Filipe Monteiro Pinto
Ricardo Miguel Martins da Costa Ribeiro
Católica Porto Business School, Setembro de 2016
Agradecimentos
Ao Professor Doutor João Filipe Monteiro Pinto e ao Professor Doutor Ricardo Miguel Martins da Costa Ribeiro, não só pela orientação, mas também pela completa disponibilidade que demonstraram na orientação, assim como todos os conselhos, comentários e toda outra ajuda que me forneceram ao longo do desenvolvimento da dissertação.
À minha família, mas um especial agradecimento aos meus pais pelo apoio incondicional e pelo espaço que me permitiu conseguir desenvolver toda a dissertação nas melhores condições possíveis.
Ao José Pedro Cardoso, pela contínua motivação e pelos momentos de descontração.
Resumo
O trabalho desenvolvido nesta tese foca-se na relação entre o ‘spread’ e a maturidade para três tipos de ‘syndicated loans’: ‘Project Finance loans’, ‘Capital Structure loans’ e ‘Corporate Control loans’. Procurou-se, inicialmente, estudar se a forma como o preço (‘spread’) dos diferentes tipos de empréstimos em análise é semelhante; ou seja, se existem diferenças estruturais na forma como o ‘spread’ de cada tipologia de empréstimo é determinado. Os resultados sugerem que os ‘syndicated loans’ estudados que têm como propósito financiar operações de ‘Project Finance’ têm diferenças estruturais em relação aos restantes tipos, a estrutura temporal encontrada para os empréstimos sobre o regime de ‘Project Finance’ é uma estrutura quadrática de concavidade virada para baixo, para os restantes tipos de empréstimos (‘Corporate Control’ e ‘Capital Structure’) a estrutura temporal encontrada é também quadrática, mas com concavidade voltada para cima. Testamos também potencial endogeneidade da variável maturidade em todos os tipos de ‘syndicated loans’, implementando uma regressão de variáveis instrumentais pelo método GMM para os syndicated loans afetados
Palavras-chave: estrutura temporal, spread, syndicated loans, project finance, endogeneidade, maturidade.
Abstract
This thesis focuses in the relationship of spread and maturity for three types of syndicated loans, Project Finance loans, Capital Structure loans and Corporate Control loans, we first look at the characteristics of the different types of loans in analysis and compare them to see if there are significant differences between them. We find PF loan type have different term structure of credit spreads, we suggest a negative hump-shaped term structure of credit spreads in project finance loans. Regarding Capital Structure and Corporate Control loans we find a positive hump-shaped term structure. We also test for potential endogeneity in all syndicated loans, and employ an instrumental variable regression using the GMM method to correct this problem for the type of syndicated loans affected.
Keywords: term structure, credit spreads, syndicated loans, project finance, endogeneity, maturity
Table of contents
A comparative analysis between Corporate Control, Capital Structure and
Project Finance loans ... i
Agradecimentos ... iii
Resumo ... v
Abstract ... vii
Table of contents ... ix
List of Ilustrations ... xii
List of tables ... xiv
1.Introduction ... 16
2. Literature Review ... 19
2.1. The Term Structure of credit spreads in corporate bonds. ... 19
2.1.1 Theoretical Background ... 19
2.1.2 Empirical Evidence ... 20
2.2 The Term Structure of credit spreads in syndicated loans ... 21
2.2.1 Syndicate size, information asymmetry and maturity choice ... 22
2.2.2 The term structure of credit spreads ... 23
2.2.3 The 2008 sub-prime crisis and the market for syndicated loans ... 27
2.3 Theoretical framework ... 27 3.Empirical work ... 30 3.1 Data Description ... 30 3.1.1 Sample Selection ... 30 3.1.2 Variable Description ... 34 3.2 Preliminary analysis ... 42
3.3 Hypothesis and Methodology: ... 44
3.3.1 Term structure of credit spreads in syndicated loans ... 44
3.3.2 Are syndicated loans priced in integrated markets? ... 45
3.3.3 How the 2008 crisis influence the term structure of syndicated loans? . 46 4. Results ... 47
4.1 Term structure by loan purpose ... 47
4.1.1 Project Finance Loans ... 49
4.1.3 Capital Structure loans ... 55
4.2 Robustness Checks ... 57
4.2.1 The syndicated spreads across Country Markets ... 57
4.2.2 The impact of the 2008 financial crisis in the term structure of credit spreads in syndicated loans ... 60
4.3 Additional sensitivity tests ... 65
5. Conclusions and limitations ... 66
Bibliography ... 68
List of Illustrations
Figure 1 Factors affecting Spread ... 29
Figure 2 Quadratic prediction of the term structure of credit spreads in PF loans ... 42
Figure 3 Quadratic prediction of the term structure of credit spreads in CC loans ... 43
Figure 4 Quadratic prediction of the term structure of credit spreads in CS loans ... 43
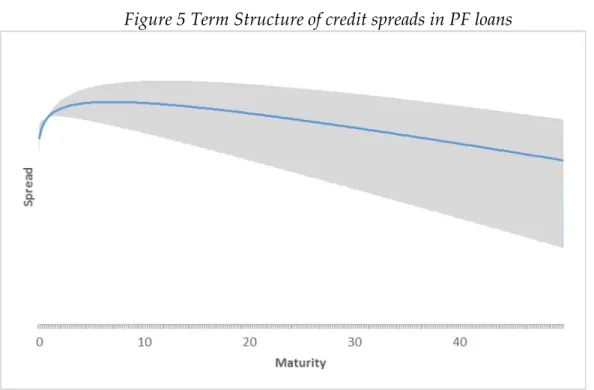
Figure 5 Term Structure of credit spreads in PF loans ... 52
Figure 6 The term structure of credit spreads in CC loans ... 53
Figure 7 The term structure of credit spreads in CS loans ... 56
Figure 8 The term structure of credit spreads in US PF loans ... 59
Figure 9 The term Structure of credit spreads in WE PF loans ... 60
Figure 10 Term structure of CC loans before the sub-prime crisis ... 63
Figure 11 Term structure of credit spreads of CC loans after the sub-prime crisis ... 64
List of tables
Table 1 Contractual Characteristics for the Full Sample ... 31 Table 2 Contractual Characteristics for the High-Information Sample ... 33 Table 4 OLS regression High-information sampleErro! Marcador não definido.
Table 5 OLS regression Project Finance Loans .. Erro! Marcador não definido. Table 6 OLS regression CC loans ... 75 Table 7 OLS regression CS loans ... 76 Table 8 Instrumental Variable regressions for CC and CS loans ... Erro!
Marcador não definido.
Table 9 Regression US vs WE ... 77 Table 10 Regressions Pre-crisis vs Post-crisis ... Erro! Marcador não definido. Table 11 Chow Test for differences in pricing Factors coefficients PF loans . 77 Table 12 Instruments significance test for CC loans ... 77 Table 13 Instruments significance test for CS loans ... 78
1. Introduction
Debt capital market has become one of the main sources for financing firms. In 2007 debt markets concentrated 94% of all public funds raised in European capital markets [Altunbas et. al (2007)]. The debt market is fragmented in corporate bonds and syndicated loans for large financing deals. In this work, we focus on syndicated loans, specifically in the following three types: Corporate Control loans (CC), Capital Structure loans (CS) and Project Finance loans (PF).
CC loans are loans with the purpose to finance mergers and acquisitions, leverage-buy-outs and management-buy outs. CS loans account all loans with the following purpose: debt repayment, restructuring, stock buyback, dividend recapitalization, commercial paper backups, exit financing, debtor in possession financing, IPO financing and other unspecified recapitalizations. Finally, PF loans are structurally different from the other types of syndicated loans, primarily because they are used, typically as non-recourse debt, to fund a new project established by a special purpose vehicle (SPV) or a vehicle company.
This thesis addresses the term structure of credit spreads in syndicated loan in three parts, the first one analyses the spread-maturity relationship for the three-aforementioned type of loans, and compares the term structure between them. The second part compares loans contracted in the US and European markets for each loan type, the last part looks for differences in the term structure for two different time periods, before September 15th 2008, the date
crisis, and after for the three types mentioned above. To do so we use Dealscan Database, provided by Thomson Reuters, and collected a sample of 43,162 loans closed between 2000 and 2014.
Theory on the term structure of credit spreads can be divided in two main streams. The first studies the term structure of bond spreads, in which the majority of the literature that study the determinants of bond credit spreads finds credit rating as the main explanatory variable of spread. Several authors [Jones, Mason, and Rosenfeld (1984), Sarig and Warga (1989), and Sorge and Gadanecz (2008)] argue that, on average, the term structure of credit spreads for investment grade bonds appears upward-sloping. However, the literature has been more controversial regarding the term structure of credit spreads for non-investment grade bonds: Fons (1987), Sarig and Warga (1989), and Helwege and Turner (1999) find downward-sloping term structures of credit spreads for non-investment grade bonds.
The second stream analyses the term structure of credit spreads in loans, however there are very few studies approaching this topic. Kleimeier and Megginson (2000) show a positive relationship for the majority of the syndicated loans, however for PF loans the spread-maturity relationship is negative, Sorge and Gadanecz (2008) go deeper in the analyses of the term structure of credit spreads in project finance and propose a hump-shaped term structure.This thesis contributes with an extent analyses to PF, CC and CS, such discussion is important since there is very little research on the term structure of syndicated loans, and the existent is too focused on PF loans. Building on previous loan pricing models proposed by Kleimeier and Megginson (2000) and Sorge and Gadanecz (2008), we extended the analyses to CC and CS loans. In line with previous empirical literature on the term structure of credit spreads, we find a hump-shaped relationship between spread and maturity for PF loans. Furthermore, we find evidence suggesting that CC loans and CS loans do not
have a positive linear term structure of credit spreads. Instead we find a convex relationship between spread and maturity for both CC and CS loans: loans with very short maturities have higher spreads than mid maturities and as maturity increases spread increases in a non-linear relationship. Our results are robust even when we create sub-samples considering the region where the borrower is located or whether the loan is closed in the pre-crisis vis-à-vis the crisis period.
Concerns on possible maturity endogeneity lead to employ instrumental variable regression using GMM method Baum (2003), in order to control for endogeneity problems and to allow clustering of the errors. We find evidence of maturity endogeneity in loans with the purpose of Corporate Control and Capital Structure.
This thesis is organized as follows. Section 2 reviews literature on the determinants of corporate bond and syndicated loan credit spreads, whit an emphasis on the relationship between spread and maturity. Section 3 describes the data. Provides a preliminary analysis on specific features of the different types of loan issues and introduces our model and the main research questions. Section 5 presents and discusses empirical results. Finally, section 6 concludes our study.
2. Literature Review
2.1. The Term Structure of credit spreads in corporate
bonds.
There is vast theoretical and empirical work on the pricing of credit risk spreads. Starting with Merton (1974) and several extensions provided by Longstaff and Schwartz (1995), Leland (1994) with structural models, Jarrow, Lando and Turnbull (1997) and Duffie and Singleton (1999) with reduced form models, researchers tried to predict the determinants of bond spreads. Despite findings that spreads are determined by other variables, like liquidity, volatility and interest rate, [Longstaff and Schwartz (1995) and Dufresne et al. (2001)] majority of the studies find credit rating the most important determinant of the spread.
2.1.1 Theoretical Background
Majority of the theoretical literature who addresses the risk structure of credit spreads and the relationship between spread and maturity claims that credit quality is the most important determinant of spread [Merton (1974), Longstaff and Schwartz (1995), Duffie and Singleton (1999) and Zhou (2001)]. However, the credit quality effect is approached in different ways: structural models define firms default process as function of the firm’s assets and liabilities; reduced form models treat the probability to default as exogenous and do not depend only on the firm’s assets. Besides differences in approaching credit quality both forms predict an upward slopping relationship between
spread and maturity for investment grade bonds and downward sloped relationship for speculative grade bonds.
2.1.2 Empirical Evidence
An important stream of the literature analyzes the term structure of credit spreads. In general, empirical studies find an upward-slopping term structure for investment-grade bonds [Sarig and Warga (1989), Fons (1994) and Sorge and Gadanecz (2008)], meaning bonds with larger maturities have higher spreads. However, there is no consensus on the term structure for speculative-grade bonds. On the one side, Fons (1994) collects 2,848 bonds from 1970 to 1993 and found an upward-slopping credit spread yield for investment-grade bonds and a downward-slopping spread yield for speculative grade bonds. Bonds probability of default and recovery rates are based on Moody’s default data by rating. Similar results were found in Sarig and Warga (1989). Authors found that the relationship between maturity and spreads on corporate pure discount bonds to variate according to the leverage of each firm. Highly leveraged firms have a downward slopping term structure on spreads, medium leveraged firms have a hump-shaped term structure and low leveraged firms have an upward slopping term structure of spreads. Helwege and Turner (1999) suggest that previous estimates may suffer from a sample selection bias. Until now we looked to credit quality as a measure of rating or leverage. However, they asked if firms with the same rating or the same leverage have the same risk? Helwege and Turner (1999) answer this question by examine multiple bonds issued by the same company where the only factor that differs is the maturity of the bond. They collected data for the 1977-1994 period and examined a total of 163 bonds. Results show an upward slopping spread yield, suggesting a possible sample bias where among the same rating, safer firms tend to issue bonds with longer
maturities. Nevertheless, other factors affect bond spreads. Dufresne and Goldstein (2001), using monthly quotes on corporate bonds between 1988 and 1997, found that changes in leverage have a positive effect on spread changes. Thus, the impact of interest rates on the spread is negative. Some studies find accounting transparency to be one factor that affects the spread-maturity relationship on bonds. Duffie and Lando (2000) show a hump-shaped relationship between spread and maturity under perfect information and a downward-slopping term structure as imperfect information problems start to become significant.
2.2 The Term Structure of credit spreads in syndicated
loans
Syndicated loans are the major substitute to corporate bonds in terms of financing decisions. In 2005, syndicated credit reached $2.3 trillion and in 2014 syndicated deals topped $3 trillion. The rapid growth of the syndicated loan market made these transactions a very large and important portion of all outstanding firms’ debt. Sufi (2000) claims syndicated lending represented 51% of the U.S. corporate financing in 2000. Acknowledging the importance of syndicated loans, is now important to answer the following question: what is a syndicated loan? A syndicated loan is a credit settled by at least two financial institutions (normally banks) to one borrower. Syndicated credits are hybrid instruments of relationship loans and transaction loans. To understand how syndicated loans works is important to understand the concepts of both instruments used: (i) relationship loans focus on specific information of the borrower available only for the lender; (ii) transaction loans focus on the use of capital market instruments to finance the borrower analogous to debt sold in the market [Dennis and Mullineaux (2000)].
In syndicated loans the relationship lender commonly referred as lead or arranger bank is responsible to screen and monitor the borrower and assemble a group of investors referred as participants, willing to underwrite separate claims of the borrower debt. Esty and Megginson (2003) refer to syndicated loans as a lending pyramid. The idea behind the analogy is based on the steps necessary to syndicate a loan: first, the lead arranger negotiate terms and conditions with the borrower and write a memorandum for the participants; second, the arranger invites other financial institutions to participate in the deal and the allocation of the loan shares is negotiated between the arranger and the participants.
2.2.1 Syndicate size, information asymmetry and maturity choice
Academic research on syndicated loans is not as extensive as the one regarding corporate bonds. However, literature on this topic is increasing and there are studies who find interesting features on the syndicated loan market. The majority of the studies aim to identify how specific variables affect the ability to syndicate or pricing the spreads for syndicated loans. A stream of the literature infers about the impact of informational asymmetry on the ability to syndicate a loan, following the argument that syndicated loans are more likely to happen when lead arrangers are trustworthy or the borrower characteristics are more transparent, which reduces severely agency problems [Sufi (2007), Dennis and Mullineaux (2000) Esty and Megginson (2003)]. Sufi (2007) explains the information asymmetry effect in two parts. The first part studies the relationship between information asymmetry and syndicate size; the second part analyzes how information asymmetry impacts the syndicate structure and also studies if the relationship among syndicate members affect the syndicate
structure. The author finds that increases in information asymmetry augment the share retained by the loan arranger, which is consistent with the theoretical hypothesis; i.e., Sufi (2007). Gupta Singh and Zebedee (2007) study the effect of liquidity on the pricing of syndicated loans, specifically if secondary market liquidity affects the pricing of the primary market loan. To access liquidity Gupta et al. (2007) employ a two-stage modeling process. The first stage consists in an instrumental variable model which predicts liquidity using bank reputation and borrower transparency as instruments. In the second stage the author employs an OLS model to price credit spread controlling for a large variety of microeconomic variables, in which they include expected liquidity. Gupta et al. (2007) find a negative relationship between liquidity and spread, and a negative relationship between maturity and spread for three specifications: the full sample of 7,912 loans and two sub-samples with available information on credit rating.
A stream of the literature is driven by the impact of asymmetric information and the economic characteristics of firms concerning their choice of debt maturity. When the information about the true quality of a firm’s assets is asymmetrically distributed between insiders and outsiders, financing decisions at large, and short-debt issues in particular, may be perceived by market participants as signaling firm asset quality as suggested in Flannery (1986) and Diamond (1991a, 1993).
2.2.2 The term structure of credit spreads
Kleimeier and Megginson (2000) study the differences in the pricing of spread for different syndicated loans. The main hypothesis raised is whether
project finance loans are more or less costly than other types of syndicated loans. Theory suggests that syndicated loans suffer heavily from agency problems and one main characteristic that mitigate this type of risk is borrower transparency. This implies that project finance should be more expensive when compared to other syndicated loans since the contractor of the loans is an SPV which has no historical information on loan repayments. Additionally, because project finance debt is typically non-recourse debt, lenders may expect significant losses in case of default, contrasting with other syndicated loans where the loan is backed by the borrower balance sheet. However, Kleimeier and Megginson (2000) argue that project finance structure overcomes this agency problem and in doing so project finance loans should not be more expensive when compared to other syndicated loans. To test this hypothesis, authors divide syndicated loans in Project finance and non-project finance loans, using a sample of 90 783 syndicated loans of more than 13 different industries and distributed all over the world. The model suggested is estimated by OLS regression, using spread over the LIBOR in basis points as dependent variable and maturity, size, third party guarantee, currency risk, country rank as proxy to country risk and collateralize assets as explanatory variables. They conclude that spread and loan size have a negative relationship for all non-project finance loans, but for non-project finance loans they find no relationship. The spread maturity relationship is positive for non-project finance loans and negative for project finance loans. The only argument presented for this finding is that PF loans have larger maturities and a positive relationship would lead to prohibitively expensive spreads. However, no other economic reason was presented to explain the results. The presence of third party guarantee and currency risk reduces spread for all syndicated loans. Finally, they find no evidence that country risk affects spread for any syndicated loan.
Sorge and Gadanecz (2008), using a sample of 31 521 loans (project finance and other syndicated loans) and bonds (corporate bonds) closed during the 1993-2001 period in emerging and developed countries, find a hump-shaped relationship between spread and maturity for project finance loans. They explain this relationship based on particular features of project finance transactions such as the time that a project needs to start generating revenues. In PF, projects usually start by generating revenues after a relatively long construction period. As loan repayment relies primarily on the project’s cash flows, obtaining credit for longer maturities might be critical to ensure a project’s financial viability. This short-term liquidity risk may explain why a standard upward-sloping relationship between maturity and credit spread does not apply to PF, as it does for CB. The model proposed has spread over the LIBOR as dependent variable for loans and spread at launch--the margin yielded by the security over the risk-free government security--for bonds, and maturity, size, risk mitigants such as collaterals or guarantees, and business sector as independent variables. For loans, they add size of the syndication and dummy variable to identify bilateral loans as microeconomic explanatory variables. Macroeconomic variables used in the study include real GDP growth, inflation, ratios of investment, credit and current account balance to GDP, debt service to exports, corruption index, slope of the US treasury yield curve, to correct the fact of spreads being measured over bases rates of different maturities and to control varying inflation expectations, and JP Morgan Emerging Market Sovereign Bond Index. Similarly, to the findings of Kleimeier and Megginson (2010), they find a linear positive relationship between spread and maturity and a negative relationship between size of the loan and spread for non-PF loans. As expected by the authors, the effect of third party guarantees reduce spreads. For the subsample of project finance the authors
find, contrary to Kleimeier and Megginson (2010), that both syndicate size and loan size reduce spreads.
The most interesting findings in Sorge and Gadanecz are the non-linear relationship between spread and maturity and the role of political risk on the pricing of PF loans. They find a hump-shaped relationship between spread and maturity and a sharp reduction of the spread when political risk guarantees are presented on the loan contract, especially in emerging countries--this results hold even when testing for endogeneity of maturity. Although for bond and non-project finance loans the robustness results on maturity confirm the presence of endogeneity--spread and maturity are determined simultaneously-- Sorge and Gadanecz (2008) do not find evidence of endogeneity in their project finance loans sample. However, PF loans are typical characterized by endogeneity concerns, since the main idea is funding a project with an SPV a large set of variables as to be determined simultaneously, with the purpose of minimizing the cost of funding [see Esty (2004), Corielli et al. (2010) and Pinto et al. (2015)]. The endogeneity problem is usually solved using instrumental variables regression - the problem with the instrumental variable approach is finding the right instruments to explain the endogenous variable. Pinto et al. (2015) presents evidence of endogeneity of maturity for loans with the purpose of Project Finance. The author follows the correction of estimations with an instrumental variable regression, using tranche size and number of tranches as instruments for maturity.
2.2.3 The 2008 sub-prime crisis and the market for syndicated
loans
Recent stream of the literature has emphasized the impact of the 2008 financial crisis in the syndicated loan market: shocks on the global economy strongly contribute to the sharp decrease on the syndicated loan market which leads to higher spreads [Santos (2011)]. Literature suggests that constraints on the demand and supply are the reasons for the downfall of syndicated lending. Regarding the supply side, Santos (2011) propose the hypothesis of a bank who incurred in larger losses would charge higher interest rates to borrowers--since banks become riskier, their cost of funding became more expensive leading them to put more pressure on borrowers. The author finds that loan spreads during the sub-prime crisis were higher and thus confirms the hypothesis that a firm who had very large losses charged higher spreads to borrowers. Alexandre et al. (2014) study the effect of bank relationship in spreads and maturity after the 2008 crisis. A previous bank relationship allows borrowers to obtain better lending conditions such as lower spreads and longer maturities. However, a crisis event has the opposite effect: loans after a crisis are usually more expensive and have shorter terms. The authors show that even during crisis banks lend to known borrowers at cheaper spreads and longer maturities.
2.3 Theoretical framework
The debt maturity-spread relationship is widely studied as discussed in section 1 and 2. We wish to test how maturity affects spread for three types of syndicated loans: PF loans, CC loans, and CS loans. Since different types of loans have different features and warranties that may translate into different term structures of credit spreads. To infer such relationship, one has to control for other variables that affect spread, such as loan size, syndicate structure,
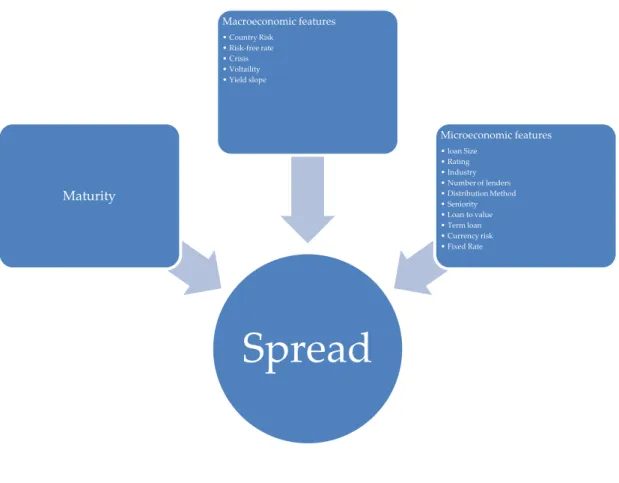
interest rates and other micro and macro pricing characteristics. Figure 1 shows a plan for pricing factors affecting spread. We argue that spreads are affected by microeconomic characteristics like loan size, rating and term loan; And macroeconomic features like risk-free rate, slope of the yield curve, and crisis. There are some specific characteristics that are particular of one country, year or industry, therefore we also control for some specific characteristics on the loans. Spread and maturity suffer from high agency costs, since borrowers wish to issue long term debt at the lowest spread possible and lenders wish to offer short-term loans at the higher spread possible.
There are two main theoretical explanations for the relationship between spread and maturity: (i) the trade-off hypothesis; and (ii) the credit-quality hypothesis.
The trade-off hypothesis or agency costs hypothesis implies a positive relation between spread and maturity, supporting the argument that lenders are willing to underwrite long-term loans to riskier borrowers at higher spreads. On the other hand, the credit-quality hypothesis or liquidity hypothesis states that lenders limit their exposure by forcing short-term loans to riskier borrowers and good borrowers will signal their credit quality by contracting short-term loans. Hence, such a relationship implies a negative slope between spread and maturity. Additionally, there are also the theory that the both can co-exist [Gottesman and Roberts (2004)].
Figure 1 Factors affecting Spread
Spread
Maturity Macroeconomic features • Country Risk • Risk-free rate • Crisis • Voltaility • Yield slope Microeconomic features • loan Size • Rating • Industry • Number of lenders • Distribution Method • Seniority • Loan to value • Term loan • Currency risk • Fixed Rate3.Empirical work
3.1 Data Description
3.1.1 Sample Selection
The sample used was withdrawn from Dealscan and Datastream databases, both provided by Thomson Reuters. Dealscan provided data on the micro characteristics of syndicated loans, such as deal size, maturity, facility amount, currency risk, borrower rating, borrower’s nationality, number of lenders, seniority, number of facilities, loan type (term loan versus credit line), loan to value ratio and industry. Each unit observation is defined by a single facility, meaning that a deal with one facility corresponds to one observation, while a deal with multiple facilities corresponds to multiple observations. Datastream provided data on macroeconomic variables such as interest rates, market volatility, country risk and yield curve slope. We also include one new dummy variable denominated crisis to identify loans contracted after September 15th
20081. The matching between the macro and microeconomic variables was
performed using the deals’s start date.
Although the merged database contains information on five types of syndicated loan: project finance, corporate control, capital structure, fixed asset base, and general purpose, this thesis focusses solely on the first three: PF, CC, and CS loans. PF refers to the usage of non-recourse debt and equity to finance a legally independent project company, usually an SPV [Esty (2003) and Pinto (2013)]. CC loans refer to loans with the purpose of M&A operations, such as
1 September 15th 2008 was the day that marked the bankruptcy of the Lehman Brothers investment bank,
acquisitions, takeovers, mergers and employee stock ownership, LBO’s and MBO’s. CS loans are loans with the purpose of funding recapitalizations, stock buybacks, debt repayments, securities purchase, and standby commercial paper facilities.
The resulting selected database was then subjected to a series of screens: (1) loans with no facility amount available were excluded; (2) the variables referent to the spread measure (all in drawn spread, as detailed below) and deal size were trimmed at the 1% bottom and top percentile to eliminate extreme values.
The above screens yielded a full sample of 40,463 deals closed between 2000 and 2014, with 6,121 (worth $ 2,136.81billions) classified as PF loans, 14,375 (worth $8,401.40 billions) as CC loans, and 19,967 (worth $8,275.99 billions) as CS loans.
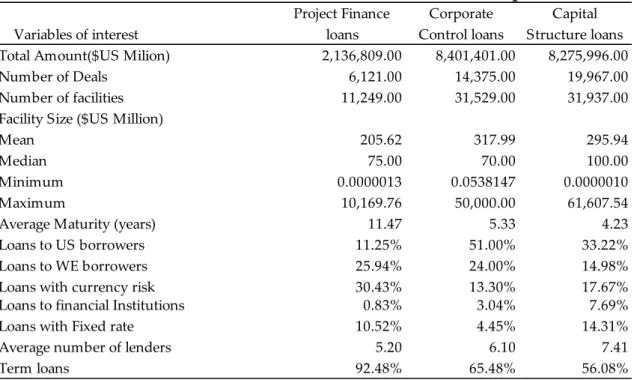
Table 1 Contractual Characteristics for the Full Sample
Table 1 presents contractual characteristics for the full sample of PF, CC, and CS loans, respectively. Total deal amount refers to the volume of all deals combined. A loan refers to a single tranche; a deal may have several tranches. Loans to US borrowers are loans contracted in the United States of America. Loans to WE borrowers are loans contracted in: Austria, Belgium, Denmark, Finland, France, Germany, Greece, Iceland, Ireland, Italy, Luxembourg, Netherlands, Norway, Portugal, Spain, Sweden, Switzerland and the United Kingdom. Loans with currency risk denominate loans where the currency from the loan is different from the borrower country Total Amount($US Milion) 2,136,809.00 8,401,401.00 8,275,996.00
Number of Deals 6,121.00 14,375.00 19,967.00
Number of facilities 11,249.00 31,529.00 31,937.00
Facility Size ($US Million)
Mean 205.62 317.99 295.94
Median 75.00 70.00 100.00
Minimum 0.0000013 0.0538147 0.0000010
Maximum 10,169.76 50,000.00 61,607.54
Average Maturity (years) 11.47 5.33 4.23
Loans to US borrowers 11.25% 51.00% 33.22%
Loans to WE borrowers 25.94% 24.00% 14.98%
Loans with currency risk 30.43% 13.30% 17.67%
Loans to financial Institutions 0.83% 3.04% 7.69%
Loans with Fixed rate 10.52% 4.45% 14.31%
Average number of lenders 5.20 6.10 7.41
Term loans 92.48% 65.48% 56.08% Variables of interest Project Finance loans Corporate Control loans Capital Structure loans
currency. Financial institutions denominate institutions with the Major Industry Group defined by DealScan as Financial Services. Lenders refer to financial institutions mainly banks. Term loans are loans with a specified repayment schedule.
Table 1 presents some contractual characteristics on the three types of syndicated loans separately, after screens. The total amount is the sum of all deals, deals with the purpose of CC have the highest total amount of deals contracted, from our sample we account for more than 8,401 billion dollars allocated to CC loans, CS loans have also a similar total volume, all CS deals account for 18,654.88 billion dollars, as for PF loans the total volume accounts for 2,136.81 billion dollars. Average (median) facility size for PF loans is $205.62 million ($75 million), $317.99 million ($70 million) for CC loans, and $295.94 million ($100 million) for CS loans.
The maturity of the deals ranges from an average of 4.23 years for CS loans and 11.5 years for PF loans. The average maturity for CC loans is 5.33 years. A first impression suggests there may be outliers since there are some observations with extreme values for maturity particularly in the PF loan and CS loan samples (not tabulated). One of the most remarkable features is how only a small amount of PF loans are extended to US borrowers: only 11.25% of the PF loans contrasting with 51.00% for CC loans and 33.22% for CS loans. European (WE) borrowers account for 14.98% of the CS loans, 24.00% of the CC loans, and 25.94% of the PF loans.
PF is undoubtedly the type of loan that suffers more from currency risk: 30.43% of all PF loans in our sample evidence currency risk, while for CC loans only 13.30% of the loans have currency risk and for CS loans the percentage goes to 17.67%. Very few loans are made to financial institutions, specifically PF loans are extremely rare, an expected result since PF loans are usually to finance large projects: only 0.83% of the PF loans are to financial institutions, 3.04% for CC loans and 7.69% for CS loans.
Loans with fixed rate are very small only 4.45% of all CC loans are fixed rate. For PF and CS loans the percentage increase slightly, 10.52% and 14.31% for PF and CS loans respectively. On average a PF loan is arranged by 5.20 lenders, a CS loan by 7.41 lenders, and a CC loan by 6.10 lenders.
This thesis aims to understand the relationship between spread and maturity in syndicated loans, specifically loans with the purpose of PF, CC and CS. For that purpose, all observations with incomplete data on spread on the full sample were excluded. We also exclude deals with maturity above 40 years since these observations were undoubtedly considered as outliers, given the distribution of the maturity variable in all loan types. This yields a high-information sample that accounts with 22,525 deals (worth $12.30 trillion), where 1,635 are PF loans (worth $682.568 billion), 9,897 are CC loans (worth $6,021.737 billion), and 11,146 are CS loans (worth $5,677.592 billion).
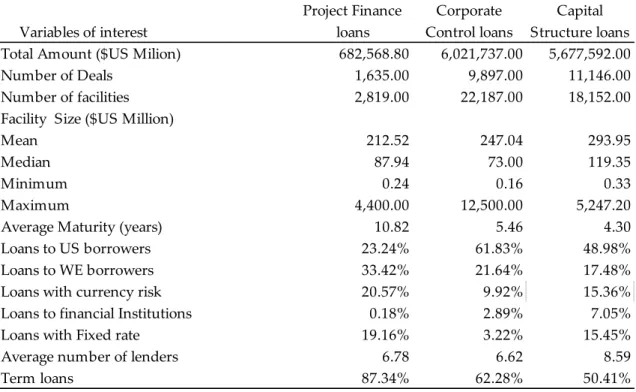
Table 2 Contractual Characteristics for the High-Information Sample
Table 2 presents contractual characteristics for the high-information sample of PF, CC, and CS loans, respectively. Total amount refers to the combined loan amount. A deal refers to the entire amount contracted, a deal may have several facilities. Loans to US borrowers are loans contracted in the United States of America. Loans to WE borrowers are loans contracted in: Total Amount ($US Milion) 682,568.80 6,021,737.00 5,677,592.00
Number of Deals 1,635.00 9,897.00 11,146.00
Number of facilities 2,819.00 22,187.00 18,152.00
Facility Size ($US Million)
Mean 212.52 247.04 293.95
Median 87.94 73.00 119.35
Minimum 0.24 0.16 0.33
Maximum 4,400.00 12,500.00 5,247.20
Average Maturity (years) 10.82 5.46 4.30
Loans to US borrowers 23.24% 61.83% 48.98%
Loans to WE borrowers 33.42% 21.64% 17.48%
Loans with currency risk 20.57% 9.92% 15.36%
Loans to financial Institutions 0.18% 2.89% 7.05%
Loans with Fixed rate 19.16% 3.22% 15.45%
Average number of lenders 6.78 6.62 8.59
Term loans 87.34% 62.28% 50.41% Variables of interest Project Finance loans Corporate Control loans Capital Structure loans
Austria, Belgium, Denmark, Finland, France, Germany, Greece, Iceland, Ireland, Italy, Luxembourg, Netherlands, Norway, Portugal, Spain, Sweden, Switzerland and the United Kingdom. Loans with currency risk denominate loans where the currency from the loan is different from the borrower country currency. Financial institutions denominate institutions with the Major Industry Group defined by DealScan as Financial Services. Lenders refer to financial institutions mainly banks. Term loans are loans with a specified repayment schedule.
Table 2 replicates the first table for the high-information sample, the main difference between the full sample and the high-information sample are the values related to facility size, the range between maximum and minimum values for facility size narrowed significantly, mean facility size for CC loans drops 70 bps after screens. Non-pricing factors do not change significantly with the screens implemented, such result is overwhelming because one is able to correct for outliers without completely changing the database, such outcome shows consistency which improves the beliefs in our final results.
3.1.2 Variable Description
Table 3 presents some descriptive statistics of the high information sample about the financial characteristics of loans for each loan type. In order to compare explained and explanatory variables across loan types, we performed Wilcoxon rank-sum tests for continuous variables and Chi-square tests for discrete variables.
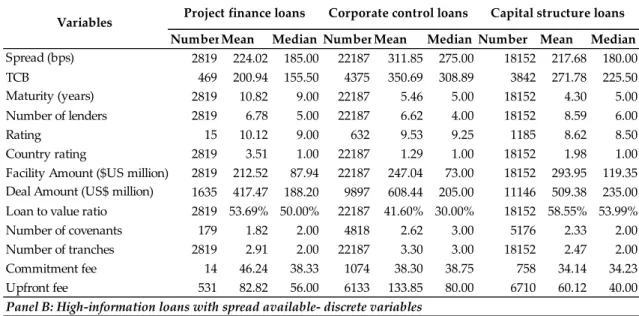
Table 3 Descriptive statistics for the high information sample
Table 3 Presents explained and explanatory variables for the high-information sample of PF, CC, and CS loans, respectively. Spread is defined as the All-In-Spread-Drawn (AISD) which is the amount paid by the borrower to the lender above the LIBOR plus facility fee. Number of lenders is the number of financial institutions participants, mainly banks. Rating and Country Rating are measured according to Moody’s and S&P rating classifiers. Commitment Fee is the fee paid by the borrower for unused loan commitments. Up-front fee is the fee paid by the borrower at the contract date. All-In-Spread-Undrawn (AISU) is the AISD plus commitment fee. The TCB is the sum of the AISD with the up-front fee divided by the maturity.
We measure spread by the amount paid by the borrower over the Libor, plus the loan facility fee. Dealscan names this measure All-In-Spread-Drawn (AISD). This measure does not represent the full economic cost of the loan, since, it does not account for other fees charged by lenders such as commitment fees, up-front fees, and annual fees. We could have used other measures for spread, that include other fees charged by the lenders, such as the Total Cost of Borrowing
Number Mean Median Number Mean Median Number Mean Median
2819 224.02 185.00 22187 311.85 275.00 18152 217.68 180.00 469 200.94 155.50 4375 350.69 308.89 3842 271.78 225.50 2819 10.82 9.00 22187 5.46 5.00 18152 4.30 5.00 Number of lenders 2819 6.78 5.00 22187 6.62 4.00 18152 8.59 6.00 Rating 15 10.12 9.00 632 9.53 9.25 1185 8.62 8.50 Country rating 2819 3.51 1.00 22187 1.29 1.00 18152 1.98 1.00
Facility Amount ($US million) 2819 212.52 87.94 22187 247.04 73.00 18152 293.95 119.35 1635 417.47 188.20 9897 608.44 205.00 11146 509.38 235.00
Loan to value ratio 2819 53.69% 50.00% 22187 41.60% 30.00% 18152 58.55% 53.99%
Number of covenants 179 1.82 2.00 4818 2.62 3.00 5176 2.33 2.00
Number of tranches 2819 2.91 2.00 22187 3.30 3.00 18152 2.47 2.00
Commitment fee 14 46.24 38.33 1074 38.30 38.75 758 34.14 34.23
Upfront fee 531 82.82 56.00 6133 133.85 80.00 6710 60.12 40.00
Panel B: High-information loans with spread available- discrete variables
Number %of totalNr D=1 Number %of totalNr D=1 Number %of totalNr D=1
2819 23.24% 655 22187 61.83% 13718 18152 48.98% 8890
2819 33.42% 942 22187 21.64% 4801 18152 17.48% 3173
Loans with fixed rate 2819 19.16% 540 22187 3.22% 714 18152 15.45% 2805
Loans with currency risk 2819 20.57% 580 22187 9.92% 2200 18152 15.36% 2788
Term loans 2819 87.34% 2462 22187 62.28% 13818 18152 50.41% 9151 Distribution Method 2819 70.27% 1981 22187 95.27% 21137 18152 91.79% 16662 Seniority 2819 99.29% 2799 22187 98.54% 21862 18152 99.25% 18015 crisis 2819 45.90% 1294 22187 26.40% 5857 18152 30.49% 5534 Loans to US borrowers Loans to WE borrowers Deal Amount (US$ million) Maturity (years)
Variables Project finance loans Corporate control loans Capital structure loans
Capital structure loans
Spread (bps)
Variables Project finance loans Corporate control loans
(TCB), proposed by Berg, Sanders and Steffen (2015). However, all of these alternative approaches would have reduced significantly our data (more than 50% of the observations have missing values and TCB). Therefore, we conduct our analysis using AISD as a measure of spread.
The average (median) spread for PF loans is 224.02 basis points2 (185 basis
points), for CC loans is 311.85 bps (275 bps), and for CS loans is 217.68 bps (180 bps). The Wilcoxon rank-sum tests reject the null hypothesis of no difference between the pairs. This implies that the spread is distributed differently across loan types. In particular, we find that (1) the average spread is statistically lower for PF loans when compared to CC loans, and (2) the average spread is statistically lower for CS loans when compared to PF loans.
The alternative measures of spread discussed above provide slight different rankings. If we look at the TCB measure PF loans have the lowest average (median) spreads, of 200.94 bps (155.5 bps), while CS loans have the second lowest average (median) spreads, of 271.78 bps (225.5 bps), and finally, CC loans have the highest average (median) spreads, of 350.69 bps (308.89 bps).
This latter result, although in contrast with the findings of Kleimeier and Megginson (2000), should not be interpreted as definitive, since this univariate
analysis does not allow us to control for other factors that are also important in explaining the pricing of syndicated loans.
The key explanatory variable of spread in this thesis is maturity. In our sample, we denote maturity by the length of the deal in years. Similar to prior studies, we find that PF loans have the highest maturities, with an average (median) of 10.82 years (9 years). In contrast, CC loans have an average (median) maturity of 5.46 years (5 years), while CS loans have an average
(median) maturity of 4.30 years (5 years). The main argument behind these results is presented in Sorge and Gadanecz (2004). PF loans rely primarily on project cash flows to repay debt. Since the project takes time to begin generating revenues, short term credits raise liquidity constraints problems to the project. In order to preserve projects liquidity, it is critical to ensure longer maturities for this type of loans.
The number of lenders denotes financial institutions who participate in the loan and it is commonly denominated as the syndicate size. The average number of lenders for all loans is 7.46 lenders. If we discriminate by loan type, we find that the average number of lenders in PF loans is 6.77, which is significantly higher than the average number of lenders in CC loans (6.62), but lower than the average number of lenders in CS loans (8.59).
Rating measures the borrower credibility and aptitude to repay his obligations to lenders. The classification goes from 1 to 22. The system is based on the S&P and Moody’s rating at the starting deal date time, where 1=AAA=Aaa, 2=AA+=Aa1 and so on to 22=D, following Sorge and Gadanecz (2008). PF loans are, in theory, the type of loans with riskier borrowers. The average rating of PF loans is 10.12, statistically higher than the average rating of CS loans: 8.62. We do not find any meaningful difference between PF loans and CC loans ratings. However, we find CC borrowers are significantly riskier (9.53) when compared to CS loan borrowers. Although these findings are in accordance to expectations, since PF loans are SPV’s with no historical credit history, we must note that only 15 observations have rating for PF loans, which limits us our understanding of how riskier are really the borrowers of this type of loans.
A particular measure that complements the interpretation of the above rating variable is country risk. Borrowers located in riskier countries tend to be riskier, given that part of the country risk is included in the spread paid by the
borrower. To measure country risk, we use Standard & Poor’s country credit rating at the deal start date. The variable takes the value 1 for the lowest risk countries (AAA) and scales to 22 for the riskiest countries (D). An alternative would have been to follow Kleimeier and Megginson (2000) and use the country risk ranking provided by Euromoney magazine, the International Country Risk Guide (ICRG) or the Institutional Investor (II), presented by Harvey et al. (1996). We opted for the Standard & Poor’s country credit rating since Harvey et al. (1996) report a strong correlation between the S&P and both II credit-risk (95%) and ICRG (90%). PF loans are located in riskier countries than CC or CS loans, average Country rating for a PF loan is 3.51, for CC loans average country rating is 1.29 and 1.98 for CS loans. This result was to be expected given the share of PF loans in the United States of America (US) and Western Europe (WE) markets: US borrowers only account for 23.24% of PF loans, while accounting 61.83% and 48.98% of CC and CS loans, respectively; WE borrowers, on the other hand, account for a higher percentage of PF loans (33.42%) than any other type of loans (and only account for 17.48% of CS loans and 21.64% of CC loans). In cumulative terms, US and WE borrowers account for 56.66% of PF loans, while accounting for 83.47% of the outstanding CC loans and 66.46% of CS loans. Loans to US borrowers are loans contracted in the United States of America. Loans to WE borrowers are loans contracted in: Austria, Belgium, Denmark, Finland, France, Germany, Greece, Iceland, Ireland, Italy, Luxembourg, Netherlands, Norway, Portugal, Spain, Sweden, Switzerland and the United Kingdom
Facility amount denotes the loan size. PF loans have statistically significant lower facility amounts than the remaining loan types, with an average of $212.52 million. In contrast, CC and CS loans have average facility amounts of $247.04 million and $293.95 million, respectively. CS loans are statistically the type of loan with higher facility amount.
However, when one analyzes facilities at a deal level (when the same contract has multiple loans the sum of all loans is the deal), CC loans have significantly higher deal amount (608.44 million) than CS and PF loans at a 5% level of significance, besides CS loans have higher average deal amounts compared to PF loans ($505 million to $417.47 million respectively).
Many of the differences exposed above are explained by looking at the loan to value ratio which is the facility over the deal amount ratio. CC loans have the lowest statistically significant loan to value ratio, with an average ratio of 41.60%, PF loans have the second lowest ratio, with an average ratio of 53.69%, and finally, CS loans have the highest ratio, with an average ratio of 58.55%.
PF loans have an average of 1.82 covenants, CC loans an average of 2.62 covenants, and CS loans an average of 2.33 covenants. However, from an analysis perspective, this constitutes a problematic variable, since it suffers heavily from a missing value problem. And, for those missing observations, we cannot distinguish deals that have no covenants from deals that have covenants, but the information is not available. For this reason, we do not include this co-variable in our econometric analysis below and just report deals with an agreement that imposes positive or negative covenants on the borrower.
The average number of facilities in CC loans is 3.30, while PF and CS loans have an average number of facilities of 2.91 and 2.47, respectively. In line with the results from the loan to value ratio and as expected, CC loans have more facilities per deal, therefore having a lower loan to value ratio.
Fees are a very important part of the cost of the loan. We describe two fee types: commitment fees and upfront fees. Commitment fees denote the fees that lenders require for unused loan commitments. Although commitment fees are more usual in credit lines, they can be used as guarantees for future loans. Commitment fees are statistically higher for CC loans (38.30 bps) when
compared to CS loans (34.14 bps). For PF loans the commitment fee is 46.24 bps, however we only have data for 16 observations, which limits our ability to extrapolate our findings. Upfront fees denote the fees paid to the lender before the start date of the loan. The upfront fee structure seems to follow the same distribution as commitment fees, since CC loans have the highest upfront fees (133.85 bps) compared with all other type of loans. However, PF loans have statistically higher upfront fees (82.82 bps) than CS loans (60.12 bps).
The risk-free rate (RF) is defined as the 3-month Treasury bill - by default we use the 3-month US treasury bills (RF US) to price spread, only in specific sub-samples for loans originated in Europe the risk-free rate used is the 3-month German treasury bill (RF WE). In addition, we include also a variable to capture the yield slope, which we proxy by the difference between the 5-year treasury bond and the 3-month treasury bill - again, we followed the same logic as for the risk-free rate: we price spreads with US risk free rate and yield, moreover we use the local risk free and yield to price US and WE sub-samples.
Volatility is proxied by VIX index, which is the implied volatility of the S&P 500 index options.
We also include a set of dummy variables that control for certain borrower and lender specific features.
Fixed rate denotes a dummy variable that takes the value 1 if the loan has a fixed rate and 0 if it has a floating rate. Only 3.22% of all CC loans in our sample have a fixed rate, while this percentage is more than 5 times higher for PF and CS loans, with a fixed rate percentage of 19.16% and 17.48%, respectively.
Currency risk is a dummy variable that takes the value 1 if the borrower’s home currency and the deal currency are different and 0 if both currencies are the same. PF loans seem to be associated to higher currency risk (32.18%) than CC or CS loans (9.92% and 15.36% respectively). The explanation for this pattern is very straightforward, since PF loans are located in riskier countries
and arrangers are much more disperse. As a consequence, it is only natural for this type of loans to have higher currency risk.
A term loan denotes a dummy variable that takes the value 1 if the deal is a term loan and 0 if the deal constitutes a line of credit. 87.34% of PF loans are term loans, while only 62.28% and 50.41% of CC and CS loans, respectively, are term loans.
Distribution method is a dummy variable that takes the value 1 if the facility is syndicated and 0 otherwise. Almost all loans are syndicated, nominally 70.27% of PF loans are syndicated, and for CS and CC loans the percentage is higher 91.79% and 95.27%. Seniority is a dummy variable that is equals to 1 if the facility is senior or senior subordinated in the company’s overall debt. Almost a 100% of the facilities are senior or senior subordinated: 99.29% of PF loans are senior, 98.54% of CC loans are senior and finally 99.25% of the CS loans are senior. Lenders demand a higher priority in the repayment of the debt in a syndicated loan. This is the case due to the relatively higher amount of a syndicated loans in comparison with traditional bank loans.Crisis is a dummy variable that takes the value 1 if the deal starts after September 15th 2008 and 0
otherwise. Interestingly, only 26.40% of all CC loans were contracted after the Lehman Brothers filed for bankruptcy. Regarding PF loans, almost half of the loans (45.90%) were contracted after the crisis, while regarding CS loans only 30.49% were contracted after September 15th 2008. Such results suggest the
sub-prime crisis affected substantially CC and CS loans. Finally, rated is a dummy variable that takes the value 1 if the company has rating and 0 otherwise,
3.2 Preliminary analysis
In order to examine the relationship between spreads and maturity, we performed a simple OLS regression of AISD on maturity for each loan type.
We begin by examining PF loans. Since prior research suggests that the relationship may not be linear, we consider a possible quadratic relationship. Figure 2 plots the predicted relationship (point estimates and 95% confidence intervals) from this estimation. It suggests a significant hump-shaped term structure, in line with the results presented by Sorge and Gadanecz (2008).
Figure 2 Quadratic prediction of the term structure of credit spreads in PF loans
Figure 2 plots the quadratic prediction of the term structure of PF loans in blue and the 95% confidence intervals in grey
We repeated this analysis for CC and CS loans. The results, depicted in figures 3 and 4, are similar. They suggest a significant hump-shaped term
structure for both loan types, in contrast with the linear relationship hinted by prior literature (Kleimeier and Megginson, 2000; Sorge and Gadanecz, 2008).
Figure 3 Quadratic prediction of the term structure of credit spreads in CC loans
Figure 3 plots the quadratic prediction of the term structure of CC loans in blue and the 95% confidence intervals in grey
Figure 4 Quadratic prediction of the term structure of credit spreads in CS loans
Figure 4 plots the quadratic prediction of the term structure of CS loans in blue and the 95% confidence intervals in grey.
3.3 Hypothesis and Methodology:
3.3.1 Term structure of credit spreads in syndicated loans
This thesis contributes to the literature on the term structure of credit spreads in syndicated loans. In particular, we examine the term structure of credit spreads for PF, CC and CS loans. We begin by testing whether those different types of syndicated loans are priced differently, i.e., if the same covariate has or not the same impact on spread for the three loan types. In order to do so, we use the high information sample to regress spreads on maturity and a set of controls for each loan type.
As discussed above, we expect a hump-shaped, relationship between spread and maturity for the three types of syndicated loans. In line with Sorge and Ganecz (2008), we add linear transformations of maturity to test the non-linearity hypothesis. To do so, we consider two models: model (1), that includes only a linear term for maturity; and model (2) that combines a linear term with a logarithmic term for maturity. The specifications of these two models are given by: 𝑆𝑝𝑟𝑒𝑎𝑑𝑖 = 𝛽0+ 𝛽1𝑀𝑎𝑡𝑢𝑟𝑖𝑡𝑦𝑖 + 𝛽2ln (𝐷𝑒𝑎𝑙 𝐴𝑚𝑜𝑢𝑛𝑡𝑖) + 𝛽3𝑁𝑢𝑚𝑏𝑒𝑟 𝑜𝑓 𝑙𝑒𝑛𝑑𝑒𝑟𝑠𝑖 + 𝛽4𝐷𝑖𝑠𝑡𝑟𝑖𝑏𝑢𝑡𝑖𝑜𝑛𝑀𝑒𝑡ℎ𝑜𝑑𝑖 + 𝛽5𝐿𝑜𝑎𝑛 𝑡𝑜 𝑣𝑎𝑙𝑢𝑒𝑖 + 𝛽6𝑆𝑒𝑛𝑖𝑜𝑟𝑖𝑡𝑦𝑖+ 𝛽7𝑇𝑒𝑟𝑚 𝑙𝑜𝑎𝑛𝑖 + 𝛽8𝐹𝑖𝑥𝑒𝑑 𝑟𝑎𝑡𝑒𝑖 + 𝛽9𝐶𝑢𝑟𝑟𝑒𝑛𝑐𝑦 𝑟𝑖𝑠𝑘𝑖 + 𝛽10𝑅𝑎𝑡𝑒𝑑𝑖 + 𝛽11𝑅𝑎𝑡𝑖𝑛𝑔 ∗ 𝑟𝑎𝑡𝑒𝑑𝑖+ 𝛽12𝐶𝑜𝑢𝑛𝑡𝑟𝑦 𝑟𝑖𝑠𝑘𝑖 + 𝛽13𝑉𝑜𝑙𝑎𝑡𝑖𝑙𝑖𝑡𝑦𝑖 + 𝛽14𝑅𝑖𝑠𝑘 𝑓𝑟𝑒𝑒 𝑟𝑎𝑡𝑒𝑖 + 𝛽15𝑦𝑖𝑒𝑙𝑑 𝑠𝑙𝑜𝑝𝑒𝑖 + 𝛽16𝑐𝑟𝑖𝑠𝑖𝑠𝑖+ 𝜀𝑖 (1)
𝑆𝑝𝑟𝑒𝑎𝑑𝑖 = 𝛽0+ 𝛽1𝑀𝑎𝑡𝑢𝑟𝑖𝑡𝑦𝑖 + β2ln (𝑀𝑎𝑡𝑢𝑟𝑖𝑡𝑦𝑖) + 𝛽3ln (𝐷𝑒𝑎𝑙 𝐴𝑚𝑜𝑢𝑛𝑡𝑖) + 𝛽4𝑁𝑢𝑚𝑏𝑒𝑟 𝑜𝑓 𝑙𝑒𝑛𝑑𝑒𝑟𝑠𝑖 + 𝛽5𝐷𝑖𝑠𝑡𝑟𝑖𝑏𝑢𝑡𝑖𝑜𝑛𝑀𝑒𝑡ℎ𝑜𝑑𝑖 + 𝛽6𝐿𝑜𝑎𝑛 𝑡𝑜 𝑣𝑎𝑙𝑢𝑒𝑖+ 𝛽7𝑆𝑒𝑛𝑖𝑜𝑟𝑖𝑡𝑦𝑖 + 𝛽8𝑇𝑒𝑟𝑚 𝑙𝑜𝑎𝑛𝑖 + 𝛽9𝐹𝑖𝑥𝑒𝑑 𝑟𝑎𝑡𝑒𝑖+ 𝛽10𝐶𝑢𝑟𝑟𝑒𝑛𝑐𝑦 𝑟𝑖𝑠𝑘𝑖 + 𝛽11𝑅𝑎𝑡𝑒𝑑𝑖 + 𝛽12𝑅𝑎𝑡𝑖𝑛𝑔 ∗ 𝑟𝑎𝑡𝑒𝑑𝑖 + 𝛽13𝐶𝑜𝑢𝑛𝑡𝑟𝑦 𝑟𝑖𝑠𝑘𝑖 + 𝛽14𝑉𝑜𝑙𝑎𝑡𝑖𝑙𝑖𝑡𝑦𝑖 + 𝛽15𝑅𝑖𝑠𝑘 𝑓𝑟𝑒𝑒 𝑟𝑎𝑡𝑒𝑖 + 𝛽16𝑦𝑖𝑒𝑙𝑑 𝑠𝑙𝑜𝑝𝑒𝑖 + 𝛽17𝑐𝑟𝑖𝑠𝑖𝑠𝑖 + 𝜀𝑖 (2)
We begin by employing OLS regression techniques and computing standard errors clustered by deal (since each observation corresponds to a single facility, one can expect standard errors from facilities belonging to the same deal to be correlated). In order to address an eventual endogeneity of maturity we also employ instrumental variables techniques. We then compare the coefficient estimates for the three loan types, to evaluate if the same covariate has or not the same impact on spread for the three loan types.
3.3.2 Are syndicated loans priced in integrated markets?
Carey and Nini (2007) suggest that syndicated loans are priced in segmented markets. Specifically, they find evidence that spreads are smaller for syndicated loans issued in Europe than for those issued in the US. Moreover, their findings suggest that these differences are related to a home bias. This implies that there may be structural differences in the pricing of syndicated loans in different markets.
We are interested in understanding if the relationship between spread and maturity is the same for a loan contracted in WE or in the US. The methodology to check this hypothesis is similar to the one applied to evaluate the difference in the pricing of three loan types. We use the high information sample to
regress spreads on maturity and a set of controls for each loan type and region (WE and US), and then we compare the coefficient estimates.
3.3.3 How the 2008 crisis influence the term structure of
syndicated loans?
A recent stream of literature has pointed out how impactful the 2008 crisis was on credit spreads. We wish to test if the term structure of credit spreads changed with the recent economic cycle. The literature has already hinted that spreads tend to increase when facing periods of financial turmoil, but there is poor evidence concerning the impact on the term structure of credit spreads in syndicated loans. In particular, we wish to evaluate the term structure of credit spreads before and after the crisis. Theory predicts shorter maturities and larger spreads (see Santos, 2011) during crisis periods. This result suggests the crisis may have had significant impact on the term structure of credit spreads in syndicated loans. In order to evaluate this question, we create two sub-samples, one for loans that started before September 15th 2008 and another for loans that
started after September 15th 2008. The methodology to check this hypothesis is
similar to the one used for the one applied to evaluate the previous two questions. We use the two high-information sub-samples to regress spreads on maturity, and a set of controls for each loan type and then we compare the coefficient estimates.
4. Results
4.1 Term structure by loan purpose
Table 3 OLS regression High-information sample
Table 4 Presents the results of OLS regressions for the high-information sample on all loans, analyzing the determinants of credit spreads from model 1 and model 2, we exclude observations without complete data on spread, yielding a total of 43,158 loan facilities. All
independent variables have reported the coefficient value and their standard errors in parenthesis. All estimations have robust standard errors clustered by deal. The symbols ***, **, * denote statistical significance at 1%, 5% and 10% respectively.
Table 4 present the result of OLS regressions of the two models discussed above for all loan types considered together and table 5, 6 and 7 for each of the three loan types: PF, CC, and CS respectively. All regressions include the microeconomic and macroeconomic controls discussed above.
As expected, the coefficients differ substantially among loan types. This result strongly suggests that we should study the term structure of credit spreads for each loan type separately.
However, prior literature argues that maturity may be an endogenous variable, since spread and maturity are often simultaneously determined (Sorge and Gadanecz, 2004; Esty, 2004; Corielli et al., 2010). We argue spread is a function of maturity but we cannot rule out the opposite. In order to evaluate if maturity is, in fact, endogenous, we follow Wu (1973) and Davidson and MacKinnon (2004). To do so, we focus on model (1). We begin by regressing maturity, the endogenous variable, on the set of all exogenous variables and a set of instruments (to be discussed below). We then compute the corresponding residuals and include them as an additional explanatory variable in the original spread equation. The results do not reject the null hypothesis of no endogeneity for PF loans, but reject it for CC and CS loans. As a consequence, we re-estimate the latter using instrumental variable techniques. In particular, we use the generalized method of moments (GMM) approach as in Alock et al. (2012) and report the results in table 8 and 9.
The challenge is of course finding instruments that can explain maturity and are exogenous to spread. We propose the following two instruments. The first instrument is facility amount, which accounts for the amount of a single facility. This choice is based on Esty (2002), that finds a significant impact of facility
amount (or as they denominate, tranche size) in maturity and no correlation between facility amount and loan spread. The main argument is that larger facilities would constitute a larger share of the lenders’ portfolio, therefore to mitigate the risk such loans would be short-term [see Pinto et al. (2015)]. Moreover, since we study spreads at a deal level, facility amount would not change spread, therefore we do not expect a serious correlation between the instruments and the error term. The second instrument is the number of facilities. We expect single facility deal to be shorter than multi facility deal, since Maskara (2010) finds evidence that shorter maturities are less likely to be tranched. This suggests a correlation between tranching and maturity. One could question the correlation between spread and the number of facilities as Maskara (2010) suggests. Such correlation is understandable if one is explaining facility spreads: obviously non-tranched loans would imply larger spreads. However, since we examine the spread-maturity relationship at a deal level there is no reason to believe that a tranched deal would have lower spreads than a non tranched deal.
For estimation of model 2 we add the logarithm of the facility amount as instrument, such instrument has proven to increase substantially the relevance of our estimates.
In order to evaluate the quality of the above instruments, we examine the overall F-statistic of the instruments in the first-stage equation (so to assess the correlation between the endogenous variable and the instruments) and Hensen’s (1982) J statistic (so to assess if the instruments are uncorrelated with the error of the second-stage equation).
We now discuss the results for each loan type.
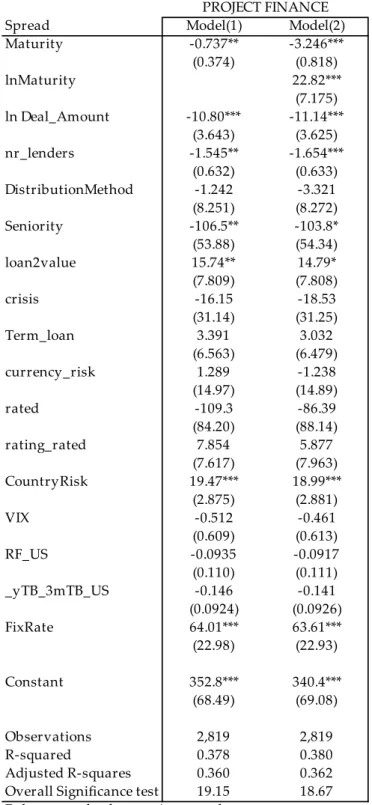
Table 4 OLS regression Project Finance Loans
Table 5 Presents the results of OLS regressions analyzing the determinants of credit spreads from model 1 and model 2, we exclude observations without complete data on spread and yields a total of 2819 PF loan facilities. All independent variables have reported the coefficient
Spread Model(1) Model(2)
Maturity -0.737** -3.246*** (0.374) (0.818) lnMaturity 22.82*** (7.175) ln Deal_Amount -10.80*** -11.14*** (3.643) (3.625) nr_lenders -1.545** -1.654*** (0.632) (0.633) DistributionMethod -1.242 -3.321 (8.251) (8.272) Seniority -106.5** -103.8* (53.88) (54.34) loan2value 15.74** 14.79* (7.809) (7.808) crisis -16.15 -18.53 (31.14) (31.25) Term_loan 3.391 3.032 (6.563) (6.479) currency_risk 1.289 -1.238 (14.97) (14.89) rated -109.3 -86.39 (84.20) (88.14) rating_rated 7.854 5.877 (7.617) (7.963) CountryRisk 19.47*** 18.99*** (2.875) (2.881) VIX -0.512 -0.461 (0.609) (0.613) RF_US -0.0935 -0.0917 (0.110) (0.111) _yTB_3mTB_US -0.146 -0.141 (0.0924) (0.0926) FixRate 64.01*** 63.61*** (22.98) (22.93) Constant 352.8*** 340.4*** (68.49) (69.08) Observations 2,819 2,819 R-squared 0.378 0.380 Adjusted R-squares 0.360 0.362 Overall Significance test 19.15 18.67 Robust standard errors in parentheses
*** p<0.01, ** p<0.05, * p<0.1