This article was published in Biofouling, 32(2), 179-190, 2016
http://dx.doi.org/10.1080/08927014.2015.1131821
Discrimination of bacteriophage infected cells using locked nucleic
acid fluorescent in situ hybridization (LNA-FISH)
Diana Vilas Boasa, Carina Almeidaa,b, Sanna Sillankorvaa, Ana Nicolaua, Joana Azeredoa and Nuno F. Azevedob
aLiBRo –Laboratório de investigação em Biofilmes Rosário oliveira, Centre of Biological Engineering, university of Minho, Braga, Portugal;
bLaboratory for Process, Environment, Biotechnology and Energy Engineering (LEPABE), Department of Chemical Engineering, faculty of Engineering, university of Porto, Porto, Portugal
ABSTRACT
Bacteriophage–host interaction studies in biofilm structures are still challenging due to the technical limitations of traditional methods. The aim of this study was to provide a direct fluorescence in situ hybridization (FISH) method based on locked nucleic acid (LNA) probes, which targets the phage replication phase, allowing the study of population dynamics during infection. Bacteriophages specific for two biofilm-forming bacteria, Pseudomonas
aeruginosa and Acinetobacter, were selected. Four LNA probes were designed and optimized
for phage-specific detection and for bacterial counterstaining. To validate the method, LNA-FISH counts were compared with the traditional plaque forming unit (PFU) technique. To visualize the progression of phage infection within a biofilm, colony-biofilms were formed and infected with bacteriophages. A good correlation (r = 0.707) was observed between LNA-FISH and PFU techniques. In biofilm structures, LNA-FISH provided a good discrimination of the infected cells and also allowed the assessment of the spatial distribution of infected and non-infected populations.
Introduction
Plaque counts (or plaque forming units; PFU) on agar plates, originally developed by d’Herelle (1917), have been used as the gold standard to enumerate phage particles. While this method has been extensively implemented in laboratories worldwide, it also presents important drawbacks, such as: (1) poor reproducibility (between experiments and between laboratories); (2) long incubation periods (usually 18 to 24 h); (3) inability to perform multiplex experiments (eg inability to detect/enumerate different phages within the same sample); and (4) inability to assess the spatial distribution of phages or to visualize cell–phage interactions (Doolittle et al. 1996; Allen et al. 2011; Yoon et al. 2011; Pankaj 2013).
Some authors have attempted to develop culture-independent techniques that might avoid at least some of the limitations of PFU. Doolittle et al. (1996), for instance, used different dyes to stain cells and phages in biofilm structures – differentiated communities of sessile microorganisms surrounded by a complex matrix (Doolittle et al. 1996; Costerton 1999; Cerqueira et al. 2013).
However, the staining used was not strain-specific, and does not allow phage replication to be monitored. Recently, Allers et al. (2013) introduced phageFISH, a methodology that allows direct detection and visualization of intra- and extracellular phage DNA. This method combines DNA probes with enzyme-conjugated antibodies that will amplify the fluorescent signal. In addition to being complex and time-consuming, this method uses large conjugates which are typically unable to diffuse through complex matrices such as those found in biofilms. Hence, it becomes clear that a direct FISH technique would be a more appropriate method to address this problem.
Because enzymatic conjugates are important to ensure the amplification of the fluorescent signal, the maximization of the signal intensity in direct FISH becomes of crucial importance. This maximization can be achieved by: (1) targeting the phage replication/expression phase, to obtain a natural amplification of the fluorescent signal; (2) ensuring efficient hybridization of the probe; and (3) improving the diffusion through the biofilm matrix to increase the number of target–probe duplexes.
When a phage replicates inside its host, multiple copies of viral DNA and mRNA are produced to guarantee the correct assembly of the phage progeny. A T4-infected bacterium, for instance, needs to produce ~300 viral DNA copies and 1,000 copies of the major capsid protein to assemble 300 phage heads (Miller et al. 2003). This requires an intensive replication/expression step, which ensures a number of copies far above the detection limits reported for FISH detection (Hoshino et al. 2008). Using a conserved region of the phage genome highly expressed during the transcription phase, the signal can be amplified easily by targeting both the viral DNA copies and mRNA transcripts.
Regarding the hybridization efficiency, new synthetic molecules that mimic nucleic acids have been incorporated into FISH techniques and have improved the performance of the method and substantially shortened the procedure (Stender et al. 2002; Priya et al. 2012). Locked nucleic acid (LNA) is one of these mimics. LNA is a synthetic RNA analog with the ribose ring locked to a C3′ endo-conformation (Wengel et al. 1999). Due to its chemical and thermodynamic properties, LNA probes can be shorter than their DNA counterparts, present higher affinity and specificity, and higher thermal stability and resistance to degradation (Thomsen et al. 2005; Cerqueira et al. 2008). LNA nucleotides can also be combined with DNA and RNA residues, allowing thorough control of the temperature of hybridization and thermodynamic parameters (Koshkin et al. 1998; McTigue et al. 2004; Kubota et al. 2006; Fontenete et al. 2015a).
In this study, a LNA-FISH method for the direct visualization and discrimination of phage infected and non-infected bacterial populations was designed, evaluated and validated. As a case study, two bacteria with high ability to form biofilms, Pseudomonas and Acinetobacter, and two species-specific phages were selected.
Materials and methods
Bacteria, bacteriophages and culture conditions
The bacterial strains used in the biofilm assays were Pseudomonas aeruginosa PAO1 (reference strain DSM 22644 obtained from the DSMZ collection) and Acinetobacter spp. Aba1 belonging to the A. bauman- nii–A. calcoaceticus (ABC) complex (clinical isolate provided by the Hospital de Braga, Braga, Portugal). An additional 14 strains of Pseudomonas and Acinetobacter species were used for the LNA probe specificity tests (see strains list in Table S1 of the Supplementary material). The strains were grown at 37°C in tryptic soy broth (TSB) (Merck, Darmstadt, Germany)
or in tryptic soy agar (TSA, Merck). The phages used in this study were phiIBB-PAA2 (Pires et al. 2011) for P. aeruginosa and vB_AbaP_CEB1, subsequently called CEB1, for Acinetobacter. The viral strains belong to the internal private collection of the Bacteriophage Biotechnology Group (BBiG), from the University of Minho.
Phage production
The phages were produced as previously described (Pires et al. 2011). For the titration of the phage stock solution, PFU counting was performed according to the small drop technique (Mazzocco et al. 2009).
Design and evaluation of the LNA probes
Design and theoretical evaluation of the phage probes
Program CoreGenes3.0 (Mahadevan et al. 2009) was used to identify conserved genes among the phage genomes. As conserved regions were not detected among the different phage genomes (see Table S3), which compromised the design of broader markers, major capsid protein-coding sequences from phages phiIBB-PAA2 (YP_008857863), and CEB1 (KT192571) were obtained and used as targets. Probes were designed for the mRNA encoding for the major capsid protein of the phages. Several useful regions were analyzed by nucleotide blast (Blastn) (Altschul et al. 1990) to evaluate specificity.
Theoretical evaluation of bacterial probes
To better evaluate the hybridization of the phage probes, a specific counterstaining of the bacterial cells was per- formed. As such, two species-specific LNA probes were also considered. Using the database probeBase (Loy et al. 2007), the probes described for Acinetobacter and P.
aeruginosa were identified. To determine the sensitivity and specificity of the probes, Probe
Match (Cole et al. 2005) and ProbeCheck (Loy et al. 2008) programs were used for probes targeting the rRNA 16S and 23S, respectively. Specificity was calculated as nTs / (TnT) × 100, in which nTs represents the number of non-target sequences that does not react with probe and TnT is the total non-target sequences present in the database. Sensitivity was calculated as Ts / (TTs) × 100, where Ts is the number of target sequences detected by probe and TTs is the total number of target sequences present in the database (Almeida et al. 2010).
Theoretical adaptation for LNA probes
The probes for bacteria and their respective phages were adapted for LNA/2-O-methyl probes, as described previously (Søe et al. 2011). Using the RNA Chemistry Laboratory program (http://rnachemlab.ibch.poznan. pl/calculator2.php) the theoretical melting temperatures (Tm) and the other thermodynamic parameters were calculated for the different sequences. Sequences with similar melting temperatures and free energy (ΔG) values (Igloi 1998) were selected.
LNA probe synthesis and purification
The LNA/O-methyl probes were synthesized as previously described (Fontenete et al. 2013). Apart from the P. aeruginosa probe (RiboTask, Langeskov, Denmark), the other three probes were synthesized at the Nucleic Acid Center (University of Southern Denmark, Denmark).
fluorescein (FAM), respectively; and the phages probes (PGAciLO and PGAciLO) were attached to Cyanine 5 (CY5).
LNA-FISH optimization for the bacterial probes
The hybridization was performed as described previously (Almeida et al. 2009) with some modifications. Smears of each strain were prepared and immersed in 4% (wt/vol) paraformaldehyde (Sigma-Aldrich, St Louis, MO, USA) followed by 50% (vol/vol) ethanol for 10 min each and allowed to air dry. The smears were then covered with ~20 μl of hybridization solution containing 900 mM NaCl (Panreac, Barcelona, Spain), 30% (vol/vol) formamide (Sigma), 20 mM Tris-HCl (pH 7.2; Sigma), 0.01% (wt/ vol) sodium dodecyl sulfate (Bio-Rad, Berkeley, CA, USA) and 200 mM LNA probe. The samples were then covered with coverslips and incubated for 90 min at 63°C. Then the coverslips were removed and the slides were placed in a preheated (63°C) washing solution containing 20 mM Tris Base (pH 7.2, Sigma), 900 mM NaCl (Sigma) and 0.01% (vol/vol) sodium dodecyl sulfate. Washing was performed for 30 min at 63°C, and the slides were allowed to air dry and mounted with one drop of mounting oil (Merck). Different hybridization temperatures, between 53°C and 63°C, were tested. All experiments were performed in triplicate and for each experiment a negative control (same hybridization conditions, but without a probe in the hybridization solution) was included.
LNA-FISH optimization for the phage probes
Since standard epifluorescence microscopes do not have adequate resolution for individual viral particles, to simplify the optimization of the FISH protocol, the different conditions were tested in infected bacterial cells. Briefly, bacteria (P. aeruginosa PAO1 and Acinetobacter Aba1) were incubated in TSB and allowed to grow at 37°C until the exponential phase. Then, phages (phiIBB-PAA2 and CEB1) were added to the respective host at a multiplicity of infection (MOI) of 0.1, and incubated for 5 min. After this, the culture was centrifuged at 10,000 × g for 5 min at room temperature (Micro STAR 17, VWR, Carnaxide, Portugal), the pellet was resuspended in 500 μl of 4% (wt/ vol) paraformaldehyde for 60 min at room temperature and centrifuged again at 10,000 × g for 5 min at room temperature. The paraformaldehyde fixed cells were resus- pended in 500 μl of 50% (vol/vol) ethanol, incubated at –20°C for 30 min and centrifuged at 10,000 × g for 5 min at room temperature. Afterwards, samples were hybridized in suspension. One hundred μl of hybridization solution were added and samples were incubated at different temperatures (between 53°C and 63°C) for 90 min. Then, samples were centrifuged to remove the hybridization solution, and 500 μl of wash solution were added. After incubation for 30 min at the same temperature as used for hybridization, the wash solution was removed by centrifugation and the pellet was resuspended in 500 μl of ultrapure water. After this, 20 μl of each sample were placed on microscopic slides and then evaluated by confocal laser scanning microscopy (CLSM). Experiments were performed in triplicate and negative controls were included for each condition.
Experimental assessment of LNA probe specificity and sensitivity
After optimizing the hybridization conditions, the sensitivity and specificity of the probes were confirmed by testing a sig- nificant number of target and closely related strains. Probes were tested against three representative Pseudomonas strains and nine representative Acinetobacter strains, as listed in Table S1. For the specificity test of the phage probes, each probe was tested against cells infected with target and non-target phages, as listed in Table S2. Non-infected cells were also used as controls. The
samples were hybridized and then evaluated by microscopy. All experiments were performed in triplicate in identical conditions.
One-step growth curve
One-step growth curves were performed as previously described (Pajunen et al. 2000), with some modifications. Briefly, 10 ml of a mid-exponential-phase culture (Aba1) were harvested by centrifugation (7,000 × g for 5 min) at 4°C (3–16 K, Sigma) and resuspended in 5 ml of fresh TSB medium. Five ml of phage solution were added to the previous suspension in order to have a MOI of 0.001. Phages were allowed to adsorb for 5 min at 37°C (120 rpm, ES-20/60, BioSan, Riga, Latvia). The mixture was then centrifuged at 7,000 × g, for 5 min at 4°C, and the pellet was resuspended in 10 ml of fresh TSB medium. Two samples were taken every 5 min over a period of 30 min to estimate the number of phages.
LNA-FISH validation in infected cells
To further validate the ability of LNA-FISH to estimate the number of infected cells, an infections center assay was followed (Luo et al. 2012). The two phage-specific probes were used in the validation assay. Two different multiplicities of infection (MOI) (0.1 and 0.01) were used for each phage, and two different infection periods (5 and 10 min) were also evaluated. The two hosts were grown overnight in TSB medium at 37°C and 120 rpm. The cellular suspensions were then diluted with TSB medium in order to reach a final concentration of ~ 5 × 10⁸ CFU ml−1. Phages were added to the respective hosts in order to obtain the desired MOI. At 5 and 10 min of infection, the suspensions were centrifuged at 7,000 × g for 5 min at 4°C for further analysis by FISH and PFU counts. The samples for PFU counts were immediately diluted in SM buffer and plated in TSA. The plates were incubated overnight at 37°C. Samples for FISH were fixed, hybridized in suspension (as described above) and visualized by epifluorescence microscopy. For each sample the concentration of phage-infected cells was determined by counting a total of 20 fields (magnification of 100×) with an area of 64 × 10−6 cm2. The average was used to calculate the total cells cm−2. All experiments were performed in triplicate in identical conditions.
Biofilm assays
For biofilm formation, the colony biofilm procedure with slight modifications was used (Merritt et al. 2011). A black polycarbonate sterile membrane filter (Whatman, Maidstone, UK) (diameter, 47 mm; pore size, 0.2 μm) was placed on a TSA plate with the shiny side of the membrane facing up. The membranes were inoculated with 10 μl of Acinetobacter or P. aeruginosa stationary-phase cultures diluted to a final concentration of ~ 1 × 10⁸ CFU ml−1. Biofilms were allowed to form for 48 h at 37°C. Membranes were transferred to fresh TSA plates every 24 h. After biofilm formation for 48 h, 5 μl of phage solution containing 1 × 10⁸ PFU ml−1 were added. The plates were then incubated for 5 and 10 min to allow biofilm infection. The membranes were fixed in 4% (wt/vol) paraformaldehyde and stored at 4°C for 24 h until histological processing. Membranes were then dehydrated, paraffin wax-embedded, cut into 4 μm-thick sections (HM 325, Microm, Walldorf, Germany) and placed on microscope slides (Histobond, Raymond A Lamb, Eastbourne, UK). Before hybridization, sections were dewaxed and hydrated according to Cerqueira et al. (2011), with minor modifications. Sections were immersed in xylol (Fisher Chemical, Loughborough, UK), ethanol (Panreac) and water, allowed to air dry and subjected to the hybridization process as described above, with the exception of the
fixation step.
Microscope visualization
FISH results were analyzed using an epifluorescence microscope (Olympus BX51) coupled with a DP71 digi- tal camera and three sets of filters (DAPI – 365-370/421; FITC – 470-490/516; and TRITC – 530-550/591) (OlympusPortugal SA, Porto, Portugal). All images were acquired using the Olympus Cell-B software. Since the BX51 microscope used does not include adequate filters to allow the discrimination of the Cy3/Cy5 combination (PGAciLO/ACA), samples with this particular combina- tion were analyzed using a CLSM (Olympus BX61, Model FluoView 1000). Phage-infected P. aeruginosa cells were also visualized by CLSM to observe infection details within the cells. The laser DM 405/488/559/635 and the emission filters BA 505–540 (green channel), BA 575–620 (orange channel) and BA 655–755 (red channel) were used, and images were acquired with the program FV10-ASW 4.2 (Olympus). The settings for samples hybridized with the PGAciLO probe (attached to Cy3) corresponded to the properties of Cy3, that has a maximum emission lying in the orange region, but images were colored as green to facilitate the discrimination of phage infection from Acinetobacter cells that were red.
Results and discussion
Probe design and theoretical evaluation
Design and theoretical evaluation of the phage probes
While rRNA genes are reported as good phylogenetic markers for the detection of bacteria, for viruses, which have highly variable genomic regions (Oliveira et al. 2013), no appropriate targets are described. As such, the first goal of this work was to identify a stable genomic region within the phage genomes, preferably conserved for a particular group of phages and under the control of a strong promoter. Two different phages (both from the Podoviridae family) for different hosts, phiIBB-PAA2 (specific for Pseudomonas) and CEB1 (specific for Acinetobacter) were selected to ensure that the results were not phage/strain dependent.
As major capsid protein coding-sequences are described as very conserved (Hambly et al. 2001; Xu et al. 2004), the present authors focused on those regions. Major capsid proteins sequences of phages CEB1 (Acinetobacter) (accession number: KT192572) and phiIBB-PAA2 (Pseudomonas) (accession number: YP_008857863), were individually subjected to a Blast analysis to identify analogous regions within other Pseudomonas and Acinetobacter phages. For instance, phages LUZ24 (accession number: NC_010325) and PaP3 (accession number: AY078382), also specific for Pseudomonas, presented a high similarity to the phiIBB-PAA2 major capsid protein. The three genes were aligned using ClustalW and conserved sequences with 15 base pairs (bp) were selected. A new Blastn analysis found that the sequence 5′-AACAACGAGAAGTCC-3′was able to detect seven major capsid protein-coding sequences from Pseudomonas phages. This sequence was then selected for the design of the probe, and designated PGPseLO.
For the Acinetobacter phage (CEB1) only one similar sequence was identified, vB_AbaP CEB2 (KT192572), belonging to the BBiG internal collection. Six conserved regions between both phages were selected. Comparing the thermodynamic parameters of the six potential sequences (see Table S4) with those of the PGPseLO probe, the sequence 5′-ATACGTTCTCAGCGT-3′ was selected.
The probe was subsequently designated as PGAciLO. Both probes were tested for specificity using Blastn and showed no relevant cross-hybridization.
Theoretical evaluation of bacterial probes
LNA probes for bacteria were designed by adapting the already existing DNA or PNA probes. Three probes were selected from the ProbeBase for P. aeruginosa, two of which are DNA (for 16S and 23S regions) and the other is a PNA for the 16S region. For Acinetobacter only one DNA probe was identified, which targeted the 16S rRNA (see Table S5). The sequence of the 16S probes was evaluated against a total of 200,062 sequences (RDPII database). The 23S probe was evaluated against a total of 28,681 sequences with more than 1,900 bp (LSU, Silva ARB). The theoretical evaluation of the probe specificity and sensitivity has shown that only two probes, ACA and Psaer, presented acceptable levels of specificity and sensitivity for Acinetobacter and P. aeruginosa, respectively (see Table S5). Thus, these two probes were selected for the following steps.
Theoretical adaptation for LNA probes
Before synthesis of probes, the sequences were adapted to the selected nucleic acid mimic. These probes, consisting of LNA + 2′-O-methyl in a 1:2 ratio, are known to allow a superior performance in terms of sensitivity and signal to noise ratio, compared with probes solely composed of LNA (Fontenete et al. 2015a) and therefore were selected for this study.
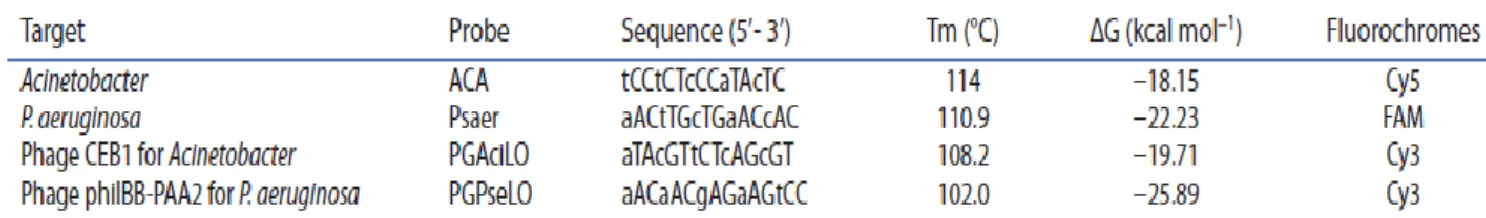
One of the most important physico-chemical and thermodynamic parameters of a probe is its affinity, usually assessed by the Gibbs free energy (ΔG) (Yilmaz & Noguera 2004). Another parameter is the melting temperature (Tm), which can be an indicator of the hybridization temperature (Fontenete et al. 2015b). The higher the Tm, the greater the thermal stability and affinity of the probe. Since this work was based on a multiplex study, similar melting temperatures (Tm) and affinities were essential. These two values were determined and it was found that the ACA probe presented a much higher Tm value than the other probes. To address this difference in Tm, the original length of the ACA probe (18 nucleotides) was reduced to 15 nucleotides (Table 1). The sensitivity and specificity values were recalculated and no significant changes were observed after size reduction. At the end of this analysis, the selected sequences were synthesized, and attached to stable fluorochromes (Gu et al. 2006) with emission spectra on different channels, having no or with minimum spectral overlap (Table 1).
Optimization of the probe hybridization
Before proceeding with the optimization of the phage probes, it was important to ensure a specific counter- staining of the host cells. Smears of each bacterium were prepared and subjected to different hybridization and washing conditions. The salt, pH and formamide conditions were fixed and the hybridization temperatures tested between 55°C and 63°C. Microscope analysis revealed a strong signal to noise ratio at 63°C, for hybridizations performed on slides or in suspension (Figure 1). Further tests were performed on representative strains, and, for both bacterial probes, a strong signal was obtained, with no cross hybridization observed (see Table S1). Additional tests on mixed samples, containing the two species, were performed and an efficient discrimination of the two populations was observed (see examples in Figure S1). These results support the theoretical predictions.
infected with phages phiIBB-PAA2 and CEB1, respectively. After fixation, samples were hybridized with the probes targeting the respective phage and bacteria and subjected to different hybridization temperatures. Temperatures between 60°C and 63°C were tested for the phage probes. CLSM analysis revealed a strong signal to noise ratio at 63°C for the two phage probes, and this temperature was used for all subsequent assays.
To evaluate the specificity of PGPseLO, the probe was added to the samples containing: phiIBB-PAA2 infected P. aeruginosa (positive control); non-infected P. aeruginosa cells (negative control); P. aeruginosa cells infected with the non-target phage – CEB1; and Acinetobacter cells infected with the target phage. The same was performed for the PGAciLO probe. The corresponding bacterial probes were always added for counterstaining. As expected, hybridization was observed only when the specific phage was added to the corresponding host species (Figure 2). Also, different stages of infection were observed, which are consistent with the replication and burst of the phage particles (Figure 3).
LNA-FISH validation in infected cells
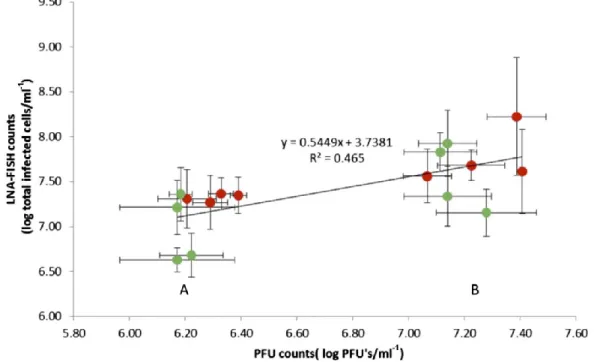
For establishing the limit of the phage LNA-FISH method for a quantitative assessment of infected cells, linear regres- sion and Pearson correlation analysis were performed to compare the classical metrics (PFU counts) against LNA- FISH counts (Figure 4). Two different MOI (0.1 and 0.01) were used for each phage to ensure that the correlation was not dependent on the phage/host species or on the scale of infection. Infection times of 5 and 10 min were used to ensure that the first burst had not yet occurred since this takes place after 15 min for both phages (Figure 3). This infectious center assay guarantees that the PFU observed are formed from infected cells and are not the result of released phages (Figure 4).
On average, for a phage belonging to the Podoviridae family, 80–300 progeny phages are released upon lysis of an infected bacterium (Shin et al. 2014). Also, to assemble each particle, more than 1,000 copies of major capsid proteins need to be produced (Miller et al. 2003). As such, robust and strong FISH signals can be easily obtained due to the viral RNA transcription step. The detection limit for conventional FISH techniques was found to be 370 ± 45 molecules per cell for Escherichia
coli hybridized on microscope slides (Hoshino et al. 2008), which is easily surpassed by targeting the
phage replication phase.
The comparison between PFU and LNA-FISH counts for both phages has shown a good correlation coefficient of 0.707 (r2 = 0.5) (Taylor 1990). The reproducibility was also good for both methods, with the average coefficient of variance between individual replicates being 0.95 for LNA-FISH and 0.26 for PFU.
It is important to observe that the number of infected cells determined by LNA-FISH counts is usually higher (0.5 to 1 log) than those obtained by PFU. These differences in counts might be due to technical differences between the two procedures or a phage inability to properly replicate in the agar plate, which would hinder plaque formation/visualization. It is well known that some of the phage-infected cells will not culminate with the productive liberation of the phage progeny and cell lysis (Anderson et al. 2011). It has been shown previously that changes in the composition of the medium can result in variations in the viable titer (obtained by PFU) by more than 1,000-fold. Also, if tested against different bacterial host strains, the same phage will often yield a different titer (Anderson et al. 2011). These phenomena can explain the difference in the PFU counts compared with the LNA counts. So, for the proper interpretation of PFU vs LNA it is necessary to take into account the limitations of the PFU technique (Pankaj 2013). In terms of technical value, it
should be noted that LNA-FISH allowed the discrimination of phage-specific infection (which would allow the use of different phages simultaneously). On average, such an approach takes ~3 h, instead of the one-day period typical of the PFU technique. The combination with flow cytometry would simplify even more the quantification step but such validation was not performed within this study.
Biofilm assays
Biofilm samples were analyzed to evaluate the ability of this technique to distinguish the phage-infected population within complex structures (Figure 5). Biofilms were formed on polycarbonate membranes (Merritt et al. 2011) and infected with specific phages for 5 to 10 min. Biofilms were fixed, embedded in paraffin and cut into transverse sections. As expected, the transverse images show thick biofilm layers for both bacteria (Figure 5) that ranged from ~ 20 μm to 30 μm. Well-developed biofilm architecture was observed after biofilm formation for 48 h. Some dark areas, typically < 5 μm in diameter, are visible in the biofilm cuts, which, due to their spatial arrangement, might be consistent with the description of biofilm water channels (De Beer et al. 1994; Lacroix-Gueu et al. 2005). These structures might provide bacteria in the bottom layers of the biofilm with access to oxygen and nutrients. Further multiplex experiments with phage and bacteria-specific probes clearly discriminate between infected and non-infected bacterial populations (Figure 5). The strong signal of the phage probes allowed the detection of phages replicating within the bacteria (red signal for Pseudomonas biofilm and green signal for Acinetobacter biofilm), and also showed that infected cells were predominantly located at the external layer of the biofilm (Figure 5 A3 and B3). While phage diffusion through the biofilm matrix has been a matter of concern in several biofilm studies (Sillankorva et al. 2008), in these specific biofilm samples no particular diffusion barriers to the phage particles seem to be present, as phage infection was able to reach the bottom of the biofilm (Figure 5 A2 and B2). This phenomenon may be mediated by the biofilm channels, which might deliver the phage particles that are then able to spread by diffusion and/or convection (Azeredo & Sutherland 2008). The production and subsequent release of phage particles allows successive phage infection, spreading the infection over the biofilm (Azeredo & Sutherland 2008). Images from a later stage of infection showed no active infection. However, a red smear (for
Pseudomonas biofilms) (Figure 5 A2 and A3) or a green smear (for Acinetobacter biofilms)
(Figure 5 B2 and B3) was visible, which is indicative of phage particles released into the biofilm matrix.
Concluding remarks
Viruses are among the most abundant entities in nature and are fundamental to ecosystem dynamics (Azeredo & Sutherland 2008). However, the well-documented biases in traditional viral plaque assays (Sillankorva et al. 2011) and the scarcity of robust methods that allow the direct visualization of virus infections in complex environments, are some of the major bottlenecks in the field of virology. Methods based on new molecular biology approaches are emerging, which might finally contribute to a filling of these gaps (Doolittle et al. 1996; Allen et al. 2011; Yoon et al. 2011). FISH has proven to be a reliable molecular method for identification, visualization, and quantification of specific microorganisms (Almeida et al. 2010; Cerqueira et al. 2013). Here, a simple method, based on nucleic acid mimics, was established which is amenable to multiplexing and can be used to study population dynamics during phage infection, allowing the visualization, location and quantification of the infection.
The LNA-FISH probes here described have provided a specific hybridization and have shown robust signals for both infected and non-infected bacteria. Furthermore, a good correlation was observed for the LNA-FISH quantification of phage-infected bacteria when compared with the traditional PFU technique.
The fact that this technique relies on direct hybridization of the target RNA, without the need for extra molecules for further amplification steps, enables LNA- FISH to give a good performance in complex samples. This will contribute to the better understanding of phage properties, the dynamics in biofilm populations, and the advantages and limitations of phage therapy applications.
Acknowledgements
The authors would like to thank Prof. Jesper Wengel and Silvia Fontenete (University of Southern Denmark) for advice on the design of the probes and for the synthesis of some of the probes used in this study, and Lucília Goreti Pinto (University of Minho) for processing and sectioning the tissue samples. The authors also acknowledge the Cost Action FA 1202 for supporting meetings that foster scientific discussion in this research area.
Disclosure statement
The authors declare no conflict of interests.
Funding
This work was financially supported by the FCT/MEC with national funds and when applicable co-funded by FEDER in the scope of the P2020 Partnership Agreement [Projects UID/EQU/00511/2013-LEPABE and UID/BIO/04469/2013] and FEDER funds through the Operational Programme for Competitiveness Factors – COMPETE [POCI-01-0145-FED- ER-006684]. Work was also supported by FCT Projects [PIC/ IC/82815/2007] and [RECI/BBB-EBI/0179/2012 (FCOMP-01- 0124-FEDER-027462)]; and IF fellowship [IF/01413/2013].
References
Allen LZ, Ishoey T, Novotny MA, McLean JS, Lasken RS, Williamson SJ. 2011. Single virus genomics: a new tool for virus discovery. PLoS one. 6:e17722. doi: 10.1371/journal. pone.0017722
Allers E, Moraru C, Duhaime MB, Beneze E, Solonenko N, Barrero-Canosa J, Amann R, Sullivan MB. 2013. Single- cell and population level viral infection dynamics revealed by phageFISH, a method to visualize intracellular and free viruses. Environ Microbiol. 15:2306–2318. doi 10.1111/ emi.2013.15.issue-8
Almeida C, Azevedo NF, Iversen C, Fanning S, Keevil CW, Vieira MJ. 2009. Development and application of a novel peptide nucleic acid probe for the specific detection of Cronobacter genomospecies (Enterobacter sakazakii) in powdered infant formula. Appl Environ Microbiol. 75:2925–2930. doi: 10.1128/AEM.02470-08
Almeida C, Azevedo NF, Fernandes RM, Keevil CW, Vieira MJ. 2010. Fluorescence in situ hybridization method using a peptide nucleic acid probe for identification of Salmonella
spp. in a broad spectrum of samples. Appl Environ Microbiol. 76:4476–4485. doi: 10.1128/AEM.01678-09
Altschul SF, Gish W, Miller W, Myers EW, Lipman DJ. 1990. Basic local alignment search tool. J Mol Biol. 215:403–410. doi: 10.1016/S0022-2836(05)80360-2
Anderson B, Rashid MH, Carter C, Pasternack G, Rajanna C, Revazishvili T, Dean T, Senecal A, Sulakvelidze A. 2011. Enumeration of bacteriophage particles: comparative analysis of the traditional plaque assay and real-time QPCR- and nanosight-based assays. Bacteriophage. 1:86–93. doi: 10.4161/bact.1.2.15456
Azeredo J, Sutherland IW. 2008. The Use of phages for the removal of infectious biofilms. Curr Pharm Biotechnol. 9:261–266. doi: 10.2174/138920108785161604
Cerqueira L, Azevedo NF, Almeida C, Jardim T, Keevil CW, Vieira MJ. 2008. DNA mimics for the rapid identification of microorganisms by fluorescence in situ hybridization (FISH). Int J Mol Sci. 9:1944–1960. doi: 10.3390/ijms9101944
Cerqueira L, Fernandes RM, Ferreira RM, Carneiro F, Dinis- Ribeiro M, Figueiredo C, Keevil CW, Azevedo NF, Vieira MJ. 2011. PNA-FISH as a new diagnostic method for the determination of clarithromycin resistance of Helicobacter pylori. BMC Microbiol. 11:101. doi: 10.1186/1471-2180-11-101
Cerqueira L, Oliveira JA, Nicolau A, Azevedo NF, Vieira MJ. 2013. Biofilm formation with mixed cultures of Pseudomonas aeruginosa/Escherichia coli on silicone using artificial urine to mimic urinary catheters. Biofouling. 29:829–840. doi: 10.1080/08927014.2013.807913 Cole JR, Chai B, Farris RJ, Wang Q, Kulam SA, McGarrell DM, Garrity GM, Tiedje JM. 2005. The
ribosomal database project (RDP-II): sequences and tools for high-throughput rrna analysis. Nucleic Acids Res. 33:294–296.
Costerton JW. 1999. Bacterial biofilms: a common cause of persistent infections. Science. 284:1318–1322. doi: 10.1126/ science.284.5418.1318
De Beer D, Stoodley P, Lewandowski Z. 1994. Liquid flow in heterogeneous biofilms. Biotechnol Bioeng. 44:636–641. doi 10.1002/(ISSN)1097-0290
Doolittle MM, Cooney JJ, Caldwell DE. 1996. Tracing the interaction of bacteriophage with bacterial biofilms using fluorescent and chromogenic probes. J Ind Microbiol. 16:331–341. doi: 10.1007/BF01570111
Fontenete S, Guimarães N, Leite M, Figueiredo C, Wengel J, Filipe Azevedo N. 2013. Hybridization-based detection of Helicobacter pylori at human body temperature using advanced locked nucleic acid (LNA) probes. PLoS one. 8: e81230. doi: 10.1371/journal.pone.0081230
Fontenete S, Silvia F, Barros J, Joana B, Madureira P, Pedro M, Figueiredo C, Céu F, Wengel J, Jesper W, et al. 2015a. Mismatch discrimination in fluorescent in situ hybridization using different types of nucleic acids. Appl Microbiol Biotechnol. 99:3961–3969.
Fontenete S, Guimarães N, Wengel J, Azevedo NF. 2015b. Prediction of melting temperatures in fluorescence in situ hybridization (FISH) procedures using thermodynamic models. Crit Rev Biotechnol. 14:1–12. doi: 10.3109/07388551.2014.993589
Gu Q, Sivanandam TM, Kim CA. 2006. Signal stability of Cy3 and Cy5 on antibody microarrays. Proteome Sci. 4:21. doi: 10.1186/1477-5956-4-21
Hambly E, Tétart F, Desplats C, Wilson WH, Krisch HM, Mann NH. 2001. A conserved genetic module that encodes the major virion components in both the coliphage T4 and the marine cyanophage S-PM2. Proc Natl Acad Sci U S A. 98:11411–11416. doi: 10.1073/pnas.191174498 d’Herelle F. 1917. Sur un microbe invisible antagoniste des bacilles dysentkriques. Acad Sci.
165:373–375.
Hoshino T, Yilmaz LS, Noguera DR, Daims H, Wagner M. 2008. Quantification of target molecules needed to detect microorganisms by fluorescence in situ hybridization (fish) and catalyzed reporter deposition-fish. Appl Environ Microbiol. 74:5068–5077. doi: 10.1128/AEM.00208-08 Igloi GL. 1998. Variability in the stability of DNA-peptide nucleic acid (PNA) single-base mismatched duplexes: real- time hybridization during affinity electrophoresis in PNA- containing gels. Proc Natl Acad Sci USA. 95:8562–8567. doi 10.1073/pnas.95.15.8562 Koshkin AA, Nielsen P, Meldgaard M, Rajwanshi VK, Singh SK, Wengel J. 1998. LNA (locked nucleic
acid): an RNA mimic forming exceedingly stable LNA:LNA duplexes. J Am Chem Soc. 120:13252–13253. doi: 10.1021/ja9822862
Kubota K, Ohashi A, Imachi H, Harada H. 2006. Improved in situ hybridization efficiency with locked-nucleic-acid- incorporated dna probes. Appl Environ Microbiol. 72:5311– 5317. doi: 10.1128/AEM.03039-05
Lacroix-Gueu P, Briandet R, Lévêque-Fort S, Bellon-Fontaine MN, Fontaine-Aupart MP. 2005. In
situ measurementsofviral particles diffusion inside mucoid biofilms. Comptes Rendus - Biol.
328:1065–1072. doi 10.1016/j.crvi.2005.09.010
Loy A, Maixner F, Wagner M, Horn M. 2007. ProbeBase—an online resource for rRNA-targeted oligonucleotide probes: new features 2007. Nucleic Acids Res. 35:D800–D804. doi: 10.1093/nar/gkl856
Loy A, Arnold R, Tischler P, Rattei T, Wagner M, Horn M. 2008. ProbeCheck – a central resource for evaluating oligonucleotide probe coverage and specificity. Environ Microbiol. 10:2894– 2898. doi: 10.1111/j.1462-2920.2008.01706.x
Luo C-H, Chiou P-Y, Yang C-Y, Lin N-T. 2012. Genome, integration, and transduction of a novel temperate phage of Helicobacter pylori. J Virol. 86:8781–8792. doi: 10.1128/ JVI.00446-12 Mahadevan P, King JF, Seto D. 2009. Data mining pathogen genomes using GeneOrder and CoreGenes and CGUG: gene order, synteny and in silico proteomes. Int J Comput Biol Drug Des. 2:100–114. doi: 10.1504/IJCBDD.2009.027586
Mazzocco A, Waddell TE, Lingohr E, Johnson RP. 2009. Enumeration of bacteriophages using the small drop plaque assay system. Methods Mol Biol. 501:81–85. doi: 10.1007/978-1-60327-164-6
McTigue PM, Peterson RJ, Kahn JD. 2004. Sequence-dependent thermodynamic parameters for locked nucleic acid (LNA)- DNA duplex formation. Biochemistry. 43:5388–5405. doi: 10.1021/bi035976d
Merritt JH, Kadouri DE, O’Toole GA. 2011. Growing and analyzing static biofilm. Curr Protoc Microbiol. 22:1–18.
Miller ES, Kutter E, Mosig G, Arisaka F, Kunisawa T, Rüger W. 2003. Bacteriophage T4 genome. Microbiol Mol Biol Rev. 67:86–156. doi: 10.1128/MMBR.67.1.86-156.2003
Oliveira H, Melo LDR, Santos SB, Nóbrega FL, Ferreira EC, Cerca N, Azeredo J, Kluskens LD. 2013. Molecular aspects and comparative genomics of bacteriophage endolysins. J Virol. 87:4558– 4570. doi: 10.1128/JVI.03277-12
Pajunen M, Kiljunen S, Skurnik M. 2000. Bacteriophage φYeO3-12, specific for Yersinia
enterocolitica serotype O:3, is related to coliphages T3 and T7. J Bacteriol. 182:5114–5120. doi:
10.1128/JB.182.18.5114-5120.2000
Pankaj K. 2013. Methods for rapid virus identification and quantification. Mater Methods. 3:207. Pires D, Sillankorva S, Faustino A, Azeredo J. 2011. Use of newly isolated phages for control of
Pseudomonas aeruginosa PAO1 and ATCC 10145 biofilms. Res Microbiol. 162:798– 806. doi:
10.1016/j.resmic.2011.06.010
PriyaNG,PandeyN,RajagopalR.2012.LNAprobessubstantially improve the detection of bacterial endosymbionts in whole mount of insects by fluorescent in-situ hybridization. BMC Microbiol. 12:81. doi: 10.1186/1471-2180-12-81
Shin HH, Hwang BH, Seo JH, Cha HJ. 2014. Specific discrimination of three pathogenic Salmonella
enterica subsp. enterica serotypes by carB-based oligonucleotide microarray. Appl Environ
Microbiol. 80:366–373. doi: 10.1128/AEM.02978-13
Sillankorva S, Neubauer P, Azeredo J. 2008. Pseudomonas fluorescens biofilms subjected to phage phiIBB-PF7A. BMC Biotechnol. 8:79. doi: 10.1186/1472-6750-8-79
Sillankorva S, Oliveira D, Moura A, Henriques M, Faustino A, Nicolau A, Azeredo J. 2011. Efficacy of a broad host range lytic bacteriophage against E. coli adhered to urothelium. Curr Microbiol. 62:1128–1132. doi: 10.1007/s00284-010- 9834-8
Søe MJ, Møller T, Dufva M, Holmstrøm K. 2011. A sensitive alternative for microrna in situ hybridizations using probes of 2'-O-methyl RNA + LNA. J Histochem Cytochem. 59:661–672. doi: 10.1369/0022155411409411
Stender H, Fiandaca M, Hyldig-Nielsen JJ, Coull J. 2002. PNA for rapid microbiology. J Microbiol Methods. 48:1–17. doi: 10.1016/S0167-7012(01)00340-2
Taylor R. 1990. Interpretation of the correlation coefficient: a basic review. J Diagnostic Med Sonogr. 6:35–39. doi: 10.1177/875647939000600106
Thomsen R, Nielsen PS, Jensen TH. 2005. Dramatically improved RNA in situ hybridization signals using LNA- modified probes. RNA. 11:1745–1748. doi: 10.1261/ rna.2139705
Wengel J, Koshkin A, Singh SK, Nielsen P, Meldgaard M, Rajwanshi VK, Kumar R, Skouv J, Nielsen CB, Jacobsen JP, et al. 1999. LNA (locked nucleic acid). Nucleosides and Nucleotides. 18:1365–1370. doi: 10.1080/07328319908044718
Xu J, Hendrix RW, Duda RL. 2004. Conserved translational frameshift in dsDNA bacteriophage tail assembly genes. Mol Cell. 16:11–21. doi: 10.1016/j.molcel.2004.09.006
Yilmaz LS, Noguera DR. 2004. Mechanistic approach to the problem of hybridization efficiency in fluorescent in situ hybridization. Appl Environ Microbiol. 70:7126–7139. doi: 10.1128/AEM.70.12.7126-7139.2004
Yoon HS, Price DC, Stepanauskas R, Rajah VD, Sieracki ME, Wilson WH, Yang EC, Duffy S, Bhattacharya D. 2011. Single-cell genomics reveals organismal interactions in uncultivated marine protists. Science. 332:714–717. doi: 10.1126/science.1203163
Figure 1. Epifluorescence images of P. aeruginosa PAo1 and Acinetobacter Aba1 hybridized with ACA, Psaer, PgAciloand PgPselo probes. Columns correspond to different microscope filters (fiTC on the left and TRiTC on the right) and lines correspond to the combination of species/probes used. Red-fluorescent cells represent Acinetobacter stained with the ACA probe and green-Red-fluorescent cells represent P. aeruginosa stained with the Psaer probe. no cross-hybridization was observed when phage probes were applied.
Figure 2. ClSM images showing active phage infection in P. aeruginosa PAo1 and Acinetobacter Aba1 cells. Phages phiiBB-PAA2 and CEB1 were used to infect P. aeruginosa PAo1 and Acinetobacter Aba1 cells, respectively. The top images show the bacterial staining (using the bacterial probes, Psaer and ACA); the central images show the phage staining (using the phage probes, PgPselo and PgAcilo) and the bottom images present the overlap of the two channels discriminating the infected and non-infected cells. Arrows indicate non-infected cells that can easily be visualized on the overlap channel.
Figure 3. one-step growth curve of phage CEB1 in the Acinetobacter Aba1 strain and representative images of the infection cycle. Microscope images do not refer to the same infected cell since this fiSH procedure is destructive, not allowing real-time monitoring. The phage growth parameters, eclipse period (E) and the burst size (B), are indicated in the figure. The error bars represent the SD.
Figure 4. linear regression between lnA-fiSH counts and Pfu counts for Acinetobacter and P.
aeruginosa phage-infected cells. The correlation includes data from two different phages,
phiiBB-PAA2 for P. aeruginosa (green markers) and CEB1 for Acinetobacter (red markers), with two different Moi (0.1 and 0.01) and different infection periods (5 and 10 min). The two clusters, A and B, correspond to Moi of 0.01 and 0.1, respectively. Each point corresponds to an independent assay of a specific condition, which represents the average of 20 microscope fields for lnA-fiSH counts and three replicates for Pfu counts, for a particular phage at a specific Moi/infection time. The error bars represent the SD. linear regression analysis yielded a correlation coefficient of 0.707 (r2 = 0.5).
Figure 5. Microscope images of P. aeruginosa PAo1 (A) and Acinetobacter Aba1 (B) phage-infected biofilms. forty-eight-hour phage- phage-infected biofilms were analyzed after exposure to the page for 5 min (A2 and B2) and 10 min (A3 and B3). The overlapping of the green and red channels is provided: for P. aeruginosa samples the green fluorescence corresponds to P. aeruginosa cells and the red fluorescence corresponds to phage-infected cells; for Acinetobacter samples the red fluorescence corresponds to Acinetobacter cells and the green fluorescence corresponds to phage-infected cells. The xy-axis on image A1 indicates the biofilm orientation.