A Work Project, presented as part of the requirements for the Award of a Master’s Degree in
Management from the NOVA – School of Business and Economics.
Country-of-origin, Consumer Ethnocentrism and National Identification: An
empirical investigation of Portuguese consumers' home-country bias
FRANCISCA MOREIRA DOS SANTOS
Nº 33303
Work project carried out under the supervision of:
Carlos Santos
1 Country-of-origin, Consumer Ethnocentrism and National Identification: An empirical
investigation of Portuguese consumers' home-country bias
Abstract
This dissertation aims to investigate Portuguese consumers’ home-country bias, which is a poorly understood phenomenon. This research project was based on a review of the relevant
literature and on the collection of empirical data through an online questionnaire. The findings
underline that Portuguese consumers show a positive bias towards domestic products, but this
is not paired with a negative distortion in the perception of foreign products. Additionally, it is
shown that consumer ethnocentrism has a weak or no impact on the country-of-origin effect.
The main conclusion is that the nationalist sentiment helps to understand Portuguese
consumers’ home-country bias.
Keywords: country-of-origin effect; consumer ethnocentrism; national identification;
home-country bias.
This work used infrastructure and resources funded by Fundação para a Ciência e a Tecnologia
(UID/ECO/00124/2013, UID/ECO/00124/2019 and Social Sciences DataLab, Project 22209),
POR Lisboa (LISBOA-01-0145-FEDER-007722 and Social Sciences DataLab, Project 22209)
2 Table of Contents
1. Introduction ... 3
2. Literature Review ... 6
2.1 Country Image (cognitive and affective components) and Product Image ... 6
2.2 Preference for domestic products, CE and NI ... 7
2.3 Portugal’s image ... 8
3. Conceptual Model and Hypotheses ... 9
3.1 Conceptual Model... 9
3.2 Hypotheses... 10
4. Research Methodology ... 11
4.1 Study Design and Measures ... 11
4.2 Data Collection ... 13
4.3 Sample ... 13
5. Results ... 14
5.1 Preliminary analysis ... 14
5.2 Hypothesis testing and discussion of the results ... 15
6. Conclusion ... 21
6.1 Research objectives: summary of findings and conclusions ... 21
6.2 Implications, Limitations and Recommendations for Future Research ... 22
7. Reference List ... 23
Appendix A: Questionnaire ... 27
Appendix B: Demographic profile of participants ... 39
Appendix C: Descriptive Statistics ... 40
Appendix D: Hypothesis testing ... 42
3 1. Introduction
In the new global economy with the lowering of trade barriers and more fierce competition,
country-of-origin (COO) has become a central issue in international marketing research. The
COO effect can be defined as the impact, either positive or negative, that the country of
production has on consumers’ choice behavior, through their perception and evaluation of
products (Iacob, 2014). It has been argued that COO is a complex phenomenon composed of
cognitive, affective and normative aspects. This means that COO is not only an extrinsic cue
used to infer product quality, but might also be associated with “status, identity, national pride
and past experiences”, as well as with consumer’s perception of a country’s policies and
practices (Verlegh and Steenkamp, 1999, 537). Thus, companies might use the COO of their products and services as a competitive differentiator (Dinnie, 2004).
Previous studies have suggested that consumers show a positive home-country bias, i.e.,
they tend to perceive and evaluate domestic products more favorably. Additionally, they might
show a negative distortion in the perception and evaluation of foreign products. (Verlegh,
2001). As argued by Verlegh (2001) there are two main reasons that explain home-country bias:
consumer ethnocentrism (CE) and national identification (NI). CE is defined by Shimp and
Sharma (1987) as the consumers’ beliefs about the appropriateness of buying foreign products,
while NI reflects the desire for national identity. The latter is related to national pride and to the
ties that one feels with one’s own country (Verlegh, 2001).
In a time when trade agreements do not usually allow the implementation of protectionist
barriers home-country bias can be used as a protectionist measure. Indeed, not only have
countries sponsored “Buy National” campaigns but also companies have associated themselves with their COO (Verlegh, 2001; Silva, 2014). An example is the campaign “Portugal Sou Eu”
4
(“Portugal Sou Eu”, 2019). Nevertheless, some studies have shown that home-country bias is not as strong as it would be expected and that consumers are aware of the weaknesses of
domestic production (Papadopoulos, Heslop, and Bamossy, 1990).
It has been found that perceptions of countries may vary across different product categories.
Roth and Romeo (1992) concluded that consumers’ willingness to buy a country’s product will be higher when the country image matches a relevant feature of the product category.
Furthermore, studies have shown that consumers might buy products of a specific category
produced in a specific country because of their superior reputation. This might be the case of
French wine or Italian shoes (Diamantopoulos, Schlegelmilch, and Palihawadana, 2011).
Despite a large number of studies on this topic, Dinnie (2004) and Iacob (2016) argue that
further research on the COO effect in consumer behavior is needed, due to the controversy
around its effect on attitudes and to the complexity of the phenomenon. Iacob (2016) also argues
that more studies are needed to clarify the link between the COO effect and CE.
The present study adopts the multidimensional perspective of the COO construct presented
by Wang, Barnes, and Ahn (2012). The COO’s dimensions considered are the cognitive and
the affective components of country image and product image. Being the cognitive component
related to the beliefs that people have about a country, the considered dimensions of this
component are: economic development, living standards, industrialization, technological
advancement, environmental concern and characteristics of the country workforce (Wang et al.,
2012; Allred, Chakraborty, and Miller, 2000; Verlegh, 2001). The affective component is
composed of positive and negative feelings towards a country (Verlegh, 2001). As for the
product image, it refers to consumer’s beliefs of a specific product made in a particular country.
For instance, one’s beliefs that Portugal’s workforce is highly efficient would be included in
5
part of the affective component. Also, the belief that Portuguese wine is very tasty and of great
quality would be part of the product image that a consumer has about the wine produced in
Portugal. CE and NI are considered as antecedent variables since, as shown in previous studies,
they help to understand the relationship between COO, country image and product image.
The present dissertation focuses on the Portuguese market, as the Portuguese perception of
their country might have improved due to tourism awards, to important events that took place
in the national territory, such as the Web Summit, to the economic stability that has attracted
more companies and capital and to the nomination of Portuguese personalities to important
international positions (Valente, 2018). Furthermore, few studies have focused on the
Portuguese market and Portugal’s COO effect is barely known and understood.
The product categories chosen to develop this study are beer, clothes and fruits. This choice
is mainly justified by the fact that Portuguese consumers are familiar with these products, that
they are both imported and produced domestically and that they show different levels of
popularity among Portuguese consumers. It is assumed that if a product is more popular,
consumers will have a more positive product image. Thus, if the present study only included
popular Portuguese products, such as olive oil, wine, and pastel de nata, the results obtained
could be biased and could have a low level of generalization.
In line with the above discussion, the overall aim of this research is to understand
Portuguese consumers’ home-country bias. Two main research tools will be used to facilitate
this study: a review of relevant literature and the collection and analysis of empirical data, which
were collected using an online questionnaire. Specifically, within the context of COO, the
objectives of this research are to a) explore if Portuguese consumers have a more positive image
of Portugal than the one they have of foreign countries; b) identify in which product categories
6
c) investigate if the constructs CE and NI are antecedents of country image and product image.
All in all, from a theoretical perspective, the present study contributes to the COO literature
by exploring the COO phenomenon in Portugal, which has not been deeply explored and
investigated. Additionally, this study intends to deepen the knowledge about the COO effect on
the perception and evaluation of domestic products. From a managerial perspective,
understanding that for some product categories Portuguese consumers evaluate domestic
productsmore positively than foreign products may affect the way companies promote, place
and price their products. Also, exploring the constructs CE and NI contributes to a better
capacity in segmentation and positioning.
This dissertation first provides a brief theoretical background, which leads to the
development of the proposed conceptual model and of some key hypotheses. Then, the method
is outlined, followed by the presentation of the results. The last section concludes with a
reflection on the theoretical and managerial implications of the findings, the limitations of this
study and the provision of recommendations for further research.
2. Literature Review
2.1 Country Image (cognitive and affective components) and Product Image
The analysis of country image is of extreme importance in the context of COO since it
might explain why consumers prefer the products produced in one country over the ones
produced in another country. Despite a large number of studies on this matter, no convergence
has been attained. Some authors define country image as being composed only of cognitive
factors but a few studies make reference to the affective component (Roth and Diamantopoulos,
2009). The distinction between the cognitive and affective component of country image is
important since emotions can have a much stronger effect on consumers’ reactions than
7
perceptions and affective evaluations of a particular country (Wang et al., 2012).
The multidimensionality of the country image construct is considered in the present
study as both the cognitive and affective components of a country’s image are explored. In this
study cognitive country image refers to consumer’s beliefs of a country and the following
dimensions are considered: economic development, living standards, industrialization,
technological advancement, environmental concern and characteristics of the country’s
workforce (Allred, Chakraborty, and Miller, 2000; Verlegh, 2001; Wang et al., 2012). The
affective component is composed of positive and negative feelings towards a country (Verlegh,
2001).
Several studies have shown that attitudes towards a country’s products vary by product
category (Bilkey and Nes, 1982). Thus, one can have a positive image of Portuguese beer while
having a negative image of smartphones made in Portugal. The differences in the COO effect
across different product categories create the necessity of introducing the product image
construct. In the present paper, product image refers to consumer’s beliefs of a specific product
made in a particular country.
2.2 Preference for domestic products, CE and NI
Several studies have shown that consumers tend to prefer domestic over foreign
products (Verlegh, 2001; Balabanis and Diamantopolous, 2004). This home-country bias can
be seen as ingroup bias. Verlegh (2001) argues that consumers perceive their own country as
ingroup and this perception makes them evaluate their own country and its products more
positively. This author proposes two motives for home-country bias: CE and NI.
The concept of CE was introduced by Shimp and Sharma (1987, 280) and it is defined
8
foreign-made products.” The authors defended that ethnocentric consumers believe that
purchasing domestic products is good for the domestic economy and protects jobs and that
buying foreign products might have a negative effect on the domestic economy and cause the
loss of jobs. Thus, CE can be interpreted as the economic motive of home-country bias
(Verlegh, 2001), and it has been shown that it may vary in magnitude according to the product
categories (Balabanis and Diamantopolous, 2004).
On the other hand, NI might be defined as the social-psychological motive for
home-country bias, as people tend to identify themselves with their own home-country and display a positive
ingroup bias. NI reflects the desire for a positive national identity, which is created by the need
for a positive evaluation of private and social selves. And a more positive evaluation of
domestic products is a way of enhancing group- and self-esteem (Verlegh, 2001; Lantz and
Loeb, 1996).
Nevertheless, other characteristics, such as quality and price, might overcome the
home-country bias effect (Verlegh, 2001; Iacob, 2014). For instance, if a Portuguese consumer
believes that Japanese smartphones are better than the Portuguese, even though he/she identifies
with Portugal and believes that it is good to buy domestic products because that improves the
national economy, he/she might prefer to buy Japanese smartphones.
2.3 Portugal’s image
There is a relatively small body of literature concerned with the COO effect of Portugal.
Filipe (2010) states that Portuguese products tend to be penalized due to their COO, i.e.,
Portugal and its products have a negative image. Nevertheless, the COO effect is proven to be
dynamic over time and the image of Portugal might have been improved over the last few years,
9
The literature found tends to focus on categories that Portugal is famous for, such as
olive oil, footwear and wine (Silva, 2017; Silva, 2014; Silva and Saraiva, 2016) and none of the
studies analyzed investigated the impact of national identification on the Portuguese COO
effect. The present study tries to overcome this gap in the literature by analyzing product
categories that show different levels of popularity among Portuguese consumers and by
investigating how the bond with the nation affects their evaluation of domestic and foreign
countries.
Having contextualized this study and introduced and defined the concepts on its basis,
it is now possible to present the conceptual model and the hypotheses tested in this dissertation.
3. Conceptual Model and Hypotheses 3.1 Conceptual Model
The conceptual model presented in Figure 1 is
based on the frameworks proposed by Verlegh (2001) and
Wang et al. (2012) and it was developed to meet the aim of
the present dissertation, which is to reach an understanding
of Portuguese consumers’ home-country bias.
The present study intends to explore if Portuguese consumers have a more positive
image of Portugal than the one they have of foreign countries and investigate in which product
categories Portuguese have a better image of domestic products over foreign ones. In order to access consumers’ perceptions about the countries and their products, the cognitive and
affective components of country image and product image are examined, as shown in Figure 1.
These three constructs compose the COO effect as defined in this paper. Additionally, it focuses
on two antecedents of the COO effect identified in the literature as being two of the motives of
home-country bias: NI and CE. The goal is to understand the influence of Portuguese
10
consumers’ level of NI and CE on their evaluation of their own country and of domestic products and on the evaluation of foreign countries and their products. The influence of NI on
the COO effect has been little investigated, though.
By testing the formulated hypotheses, it is expected to deepen the understanding of
consumers’ home-country bias.
3.2 Hypotheses
H1: Portuguese consumers have a more positive image of their own country and of Portuguese
products than the image they have of foreign countries and of their products.
Several studies have shown that consumers tend to have a better image of their own
country and of domestic products. This might be paired with a negative distortion in the
evaluation of foreign countries and their products. Therefore, it is expected that Portuguese
consumers evaluate their own country and domestic products more positively than foreign
countries and their products (Verlegh, 2001; Balabanis and Diamantopolous, 2004).
H2a) More Ethnocentric Portuguese consumers evaluate Portugal and its products more
positively.
H2b) More Ethnocentric Portuguese consumers evaluate foreign countries and their products
less positively.
As stated in the literature review, previous studies claim that ethnocentric consumers
tend to have more favorable attitudes towards the products produced in their own country and
that CE leads to an overestimation of the quality of domestic products and to an underestimation
of the quality of those produced in foreign countries (Balabanis and Diamantopolous, 2004;
Shimp and Sharma, 1987). Consequently, it is expected that more ethnocentric consumers will
11
regarding the ones produced in a foreign country.
Sharma, Shimp, and Shin (1995) argued that CE is related to the love and concern that
one feels towards one’s own country. Therefore, it is also expected that more ethnocentric
consumers have a better image of their own country and a worse perception of foreign countries.
H3a) Portuguese consumers with higher levels of NI evaluate Portugal and its products more
positively.
H3b) Portuguese consumers with higher levels of NI evaluate foreign countries and their
products less positively.
As stated previously, in order to enhance the esteem of their group and their own
self-esteem, consumers tend to see their country as ingroup and to better evaluate it. It has been
proved that the strength of this ingroup bias is directly related to the level of one’s identification
with the nation (Duckitt and Mphuthing, 1998). Additionally, consumers tend to evaluate
domestic products more positively since that is seen as enhancing their own country. This
positive bias in the perception of one’s own country and of domestic products might be paired
with a negative distortion in the perception of foreign countries and products (Verlegh, 2001).
Therefore, it is expected that the higher the level of consumer’s NI, the more positive the consumer’s perception of his/her own country and of Portuguese products will be and the less positive consumer’s perception of foreign countries and products will.
The hypotheses presented in this section will be tested for each one of the product
categories chosen.
4. Research Methodology 4.1 Study Design and Measures
12
research strategy chosen is survey-based with the use of an online questionnaire. This method
allows the collection of data from a large number of respondents, as well as a diverse sample
and the guarantee of the anonymity of the respondents which is crucial to ensure the authenticity
of the answers. Additionally, questionnaires have been widely used in COO research. The scales
used in this research are quantitative, as quantitative methods allow a more rigorous statistical
treatment and they are less subjective than qualitative ones.
The set of COOs taken into consideration is composed of Portugal and Spain. These
countries were chosen to guarantee a certain degree of familiarity of Portuguese consumers
with the products produced in the selected countries. Also, less developed countries were not
considered because consumers tend to perceive their products as having lower quality (Verlegh
and Steenkamp, 1999). As discussed earlier, this investigation focuses on beer, clothes and
fruits.
This study measures are based on scales used and validated in the reviewed literature,
which were adapted to its purpose and translated to Portuguese. Table 1 shows the number of
items of each scale used to measure the studied variables and their sources.
For all the presented measures, respondents had to indicate their agreement with each
one of the statements that composed the scales on a 5-point Likert scale, ranging from 1,
“strongly disagree”, to 5, “strongly agree”. This scale has been widely used in COO studies and, as it has a neutral point (3– “neither agree nor disagree”), respondents are not forced to
take a stand (Leung, 2011). The 5-point Likert scale was used instead of the 7-point Likert scale
in order to diminish the possible boredom of participants. All the measures were tested for
reliability. The Cronbach’s alpha of each measure (Table 1) shows satisfactory levels of internal consistency since all the alphas obtained are above 0.7 (Hair et al., 2014). All the scales used
13 Table 1. Measures sources and Cronbach’s alpha.
4.2 Data Collection
Data collection was made through a self-administered questionnaire posted on social
networks. Two versions of the questionnaire were developed, being version 1 about Portugal
and version 2 about Spain. Each of the two versions is divided into three parts. The first part
concerns the image that Portuguese consumers have of the country addressed in their version.
The next part asks participants about their beliefs regarding beer, clothes and fruits produced in
the examined country. Finally, they are confronted with questions regarding CE and NI and
demographic variables (age, income, gender, educational level and place of residence).
Questions regarding CE and NI were placed in the last part of the questionnaire since exposing
participants to ethnocentric and nationalist statements makes them more sensitive to their own
bias (Drozdenko and Jensen, 2009). Both versions are presented in Appendix A.
A pretest of the two versions of the questionnaire was performed with 20 individuals in
order to identify possible errors and interpretation difficulties. After the pretest, some questions
were reformulated with the intention of being more clear.
After the collection, all the data was uploaded and analyzed in the software IBM SPSS
Statistics 24.
4.3 Sample
Variable Nº of items Sources Cronbach’s
alpha Cognitive Component
of Country image 10
Personal elaboration adapted from Allred, Chakraborty, and Miller (2000), Wang et al. (2012), and Verlegh (2001, chap. 4)
0.706
Affective Component
of Country image 6
Scale for positive and negative feelings employed by
Verlegh (2001, chap.4) 0.779
Product Image: beer
6 Personal elaboration adapted from Chryssochoidis,
Krystallis, and Perreas (2007) 0.882
Product Image: clothes
6 Personal elaboration adapted from Kumar, Kim, and
Pelton (2009) and Swinker and Hines (2006) 0.785
Product Image: fruits 6 Personal elaboration adapted Verlegh (2001, chap.4) 0.817
CE
10 10-item version of the CETSCALE developed by
Shimp and Sharma (1987) 0.911
14
A total of 648 participants completed the web-based questionnaire. Version 1 of the
questionnaire was completed by 356 participants and version 2 by 292 participants. Most of the
participants are female (70.5%) and the majority of them belong to the age groups 31-40
(29.2%) and 41-50 (30.1%). Regarding the participants’ educational level, most of the
participants (58.3%) have at least a Bachelor’s Degree, however the category that registered the
highest percentage of responses was High School (39.2%). The majority of the participants
(59.7%) have a monthly household net income lower than 2000€. Additionally, 497 respondents
(76.7%) live in Portugal while 151 (23.2%) live in a foreign country. More details regarding
the demographic profile of the respondents are presented in Appendix B.
5. Results
5.1 Preliminary analysis
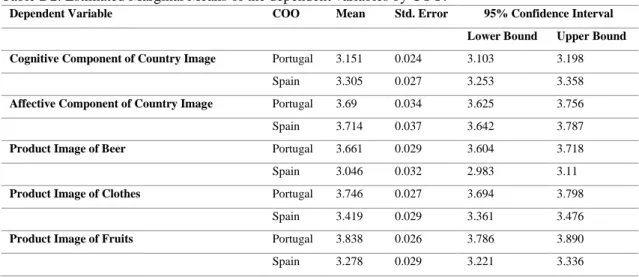
Descriptive statistics for the studied variables were obtained. Interestingly, on average,
respondents evaluated Spain (3.306) (SD=0.430) more positively than Portugal (3.151)
(SD=0.475). Apart from the workforce dimension, Spain was better evaluated than Portugal in
all the dimensions studied. Furthermore, the estimated mean value of the affective component
of country image 1is lower for Portugal (3.690) (SD=0.642) than for Spain (3.714) (SD=0.621).
Respondents have more positive feelings for Portugal, but they also have more negative feelings
for it. Regarding product image, all the Portuguese products (beer, clothes, fruits) were
evaluated more favorably when compared with the Spanish ones. Additionally, data collected
lead to the estimation of a mean CE at 2.972 (SD=0.809), revealing a non-ethnocentric sample
of consumers. Regarding NI, the estimated mean has a value of 4.203 (SD=0.581), meaning
1 The statements regarding negative feelings were recoded so that a higher value of the affective component of
15
that the sample obtained shows high levels of NI. More detailed information is presented in
Appendix C.
In order to further analyze the obtained data, it is first necessary to verify the distribution
of the dependent variables. Histograms were built for each one of the variables of this study
and Kolmogorov-Smirnov tests 2were performed (p<0.05) and it was possible to conclude that
the distribution of the variables is not normal. Nevertheless, due to a large number of
observations collected (n=648), it is possible to use the Central Limit Theorem, which allows
us to make inference when the underlying data is not normal.
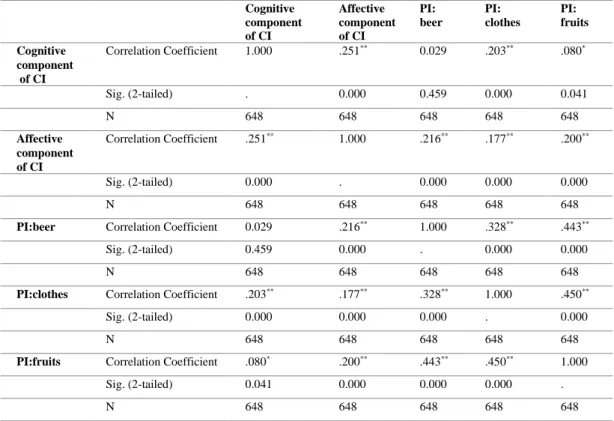
In order to determine how strongly the dependent variables are related, a Spearman’s
correlation matrix was obtained. Its analysis allows concluding that there is a positive weak
relationship between the components of country image. Additionally, the correlation between
the components of country image and product image of the different products studied is
positive, yet weak or very weak. On the other hand, there is a positive linear weak to moderate
relationship between the product image of the different products selected, meaning that when
the product image of one of the products is more positive, the product image of the other
products is also more positive. Another correlation matrix was obtained to analyze the
relationship between CE and NI, and it was concluded there is a very weak positive linear
relationship between them. Both of the correlation matrixes are presented in Appendix C.
5.2 Hypothesis testing and discussion of the results
In order to test the formulated hypotheses using ANOVAs, which are presented in
Appendix D, the variables CE and NI were transformed into binary variables using the median
2 In the present dissertation, all the tests were performed using a significance level of 0.05 corresponding to a
16
split method. The values lower than the median were coded as 0, “Low level”, and the values higher than the median were coded as 1, “High level”, for each one of the two variables. For all
the obtained ANOVAs, Levene tests were performed in order to check if the homoscedasticity
assumption was verified. When it was not verified, the results obtained were interpreted more
cautiously. In those cases, a significance level of 0.01 was considered.
H1: Portuguese consumers have a more positive image of their own country and of Portuguese
products than the image they have of foreign countries and of their products.
A one-way ANOVA was performed and the null hypothesis “The mean is the same for
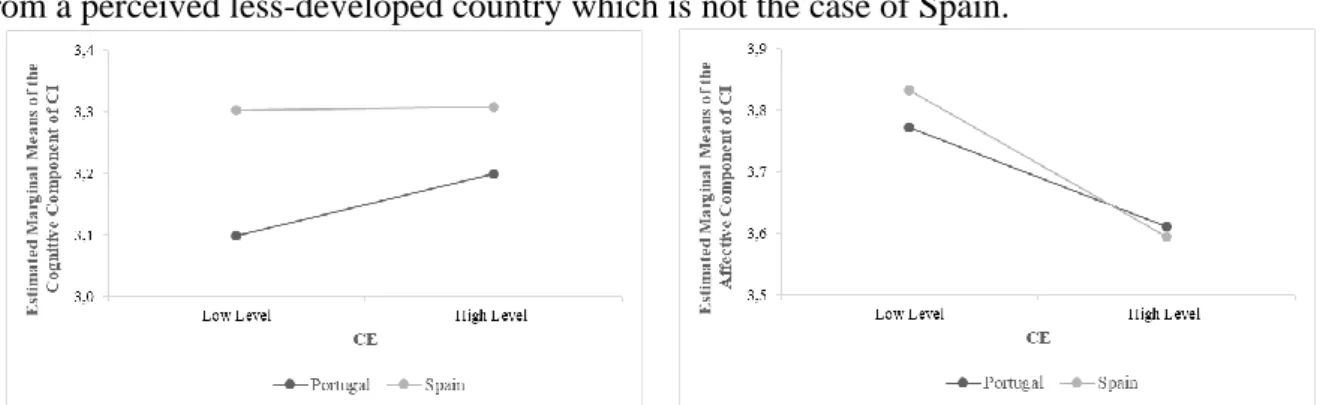
the two groups” was rejected for all the dependent variables (p<0.05), except for the affective component of country image (p>0.05) (Figure 2). Therefore, the findings suggest that
Portuguese consumers have a better cognitive image of Spain than the cognitive image they
have of their own country (Figure 3). These results are interesting, since, as stated in the
literature review, consumers tend to see their own country as ingroup and to evaluate it more
positively in order to endear it. Nevertheless, this might be explained by the fact that the
Portuguese consumers might not see Spain as a competitor and by the fact that European
consumers tend to show a European identity (Fligstein, Polyakova, and Sandholtz, 2012;
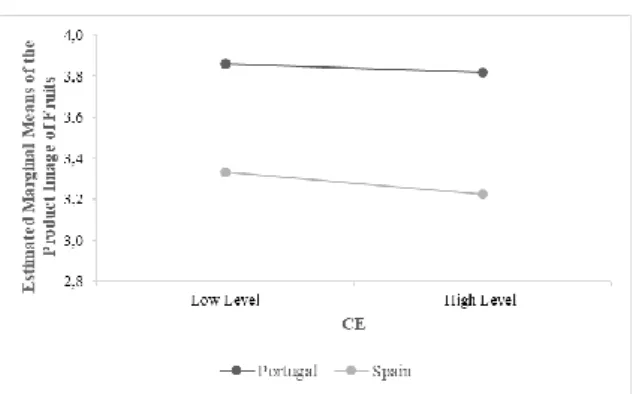
Verlegh, 2001). Regarding product image, the findings suggest that Portuguese consumers have
a more positive image of the products produced in Portugal than the products produced in Spain
(Figures 4 to 6). These findings are consistent with the conclusion reached by Samiee (1994)
in his review of the literature which stated that consumers tend to perceive domestic products
17
H2a): More Ethnocentric Portuguese consumers evaluate Portugal and its products more
positively.
H2b) More Ethnocentric Portuguese consumers evaluate foreign countries and their products
less positively.
Two-way ANOVAs that examined the effect of COO and CE on country image and
product image and post hoc tests were conducted. The interaction between the effects of COO
Figure 2. Line Chart (effect of COO on the Affective Component of Country Image). More detailed information on Tables D1 and D2 of Appendix D.
Figure 3. Line Chart (effect of COO on the Cognitive Component of Country Image). More detailed information on Tables D1 and D2 of Appendix D.
Figure 4. Line Chart (effect of COO on the Product Image of Beer). More detailed information on Tables D1 and D2 of Appendix D.
Figure 5. Line Chart (effect of COO on the Product Image of Clothes). More detailed information on Tables D1 and D2 of Appendix D.
Figure 6. Line Chart (effect of COO on the Product Image of Fruits). More detailed information on Tables D1 and D2 of Appendix D.
18
and CE on all the dependent variables was found not to be statistically significant (p>0.05). The
post hoc tests revealed that Portuguese consumers that hold high levels of CE have a more
positive cognitive image of Portugal (Figure 7) and hold less positive feelings for both Portugal
and Spain (Figure 8). Regarding product image, the findings suggest that Portuguese consumers
who have a higher level of CE have a better image of the clothes produced in Portugal (Figure
10). As shown by Figures 9,10 and 11, these results further support the idea that the impact of
CE on the COO effect may vary in magnitude across different product categories (Balabanis
and Diamantopolous, 2004). Therefore, H2a) and H2b) are not fully supported by the results
obtained, which seem to be consistent with previous studies that showed that CE has a weak or
no effect on consumer’s perceptions of a country and on the evaluation of imported products (
Sharma, 2011; Yagci, 2001). Additionally, Yagci (2001) concluded that CE only becomes a
significant predictor of consumers’ attitudes towards a product when the product is originated
from a perceived less-developed country which is not the case of Spain.
Figure 7. Line Chart (effect of COO and CE on the Cognitive Component of Country Image). More detailed information on Tables D3, D4 and D5 of Appendix D.
Figure 8. Line Chart (effect of COO and CE on the Affective Component of Country Image). More detailed information on Tables D3, D4 and D5 of Appendix D.
Figure 9. Line Chart (effect of COO and CE on the Product Image of Beer). More detailed information on Tables D3, D4 and D5 of Appendix D.
Figure 10. Line Chart (effect of COO and CE on the Product Image of Clothes). More detailed information on Tables D3, D4 and D5 of Appendix D.
19
H3a) Portuguese consumers with higher levels of NI evaluate Portugal and its products more
positively.
H3b) Portuguese consumers with higher levels of NI evaluate foreign countries and their
products less positively
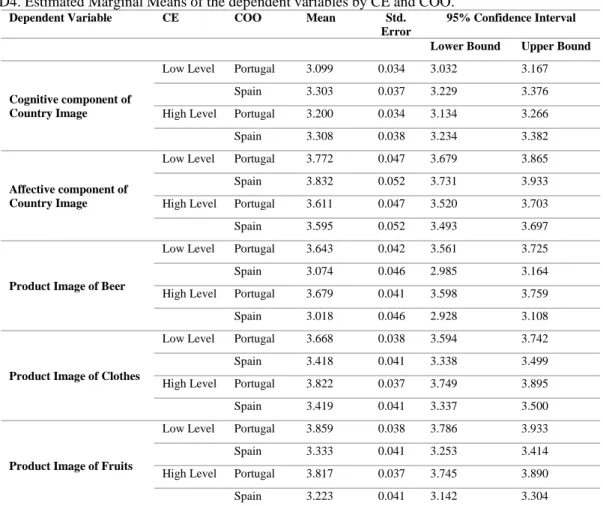
Two-way ANOVAs that examined the effect of COO and NI on country image and
product image and post hoc tests were conducted. There was a statistically significant
interaction between the effects of COO and NI on all the dependent variables (p<0.05). As
expected, the results of the post hoc tests suggest that Portuguese consumers with high levels
of NI not only have a better image of their own country but also evaluate domestic products
more positively (Figures 12 to 16). These results are in agreement with those obtained by
Verlegh (2001). Therefore, the hypothesis H3a) is supported by the results obtained.
Nevertheless, the results suggest that Portuguese consumers with high levels of NI do not have
a less positive image of Spain and its products. Therefore, the hypothesis H3b) is not supported
by the findings. These results are aligned with previous studies that showed that consumers’
desire to enhance their own group is better demonstrated by a positive distortion in the
perception of their own group rather than by a negative distortion in the perception of other
groups (Verlegh, 2001). Moreover, Brewer (1999, 442) concluded that “ingroup love is not a
necessary precursor of outgroup hate”. Another possible explanation is that Portuguese
Figure 11. Line Chart (effect of COO and CE on the Product Image of Fruits). More detailed information on Tables D3, D4 and D5 of Appendix D.
20
consumers might not perceive Spain as an outgroup due to the proximity of the two countries.
To verify the robustness of the results obtained regarding the relationship between CE
and NI and the dependent variables examined, the variables CE and NI were transformed into
categorical variables with three categories, the cut-off points were the percentiles 33 and 66.
After this, one-way ANOVAs were performed, as each COO was analyzed separately.
Additionally, a linear regression analysis was executed using the variables CE and NI as
continuous variables. Most of the results discussed above are also verified when these two
different methods are applied. The most relevant differences were observed in the relationship
between the variables NI and product image of clothes produced in Portugal and between the
variables CE and cognitive image of Portugal being none of these relationships significant. A
table summarizing and comparing the results obtained using these methods is presented in
Appendix E.
Figure 13. Line Chart (effect of COO and NI on the Affective Component of Country Image). More detailed information on Tables D6, D7 and D8 of Appendix D.
Figure 12. Line Chart (effect of COO and NI on the Cognitive Component of Country Image). More detailed information on Tables D6, D7 and D8 of Appendix D.
Figure 14. Line Chart (effect of COO and NI on the Product Image of Beer). More detailed information on Tables D6, D7 and D8 of Appendix D.
Figure 15. Line Chart (effect of COO and NI on the Product Image of Fruits). More detailed information on Tables D6, D7 and D8 of Appendix D.
21 6. Conclusion
6.1 Research objectives: summary of findings and conclusions
The overall aim of the present dissertation was to understand Portuguese consumers’
home-country bias. Within the context of COO, the specific research objectives were:1) to
explore if Portuguese consumers have a more positive image of Portugal than the one they have
of foreign countries; 2) to identify in which product categories Portuguese consumers have a
more positive image of domestic products over foreign ones; and, 3) to investigate if the
constructs CE and NI are antecedents of country image and product image. The literature review
and the statistical analysis of the data collected through an online questionnaire allowed to
achieve these objectives.
Regarding the first specific objective, it was shown that Portuguese consumers do not
have a more positive image of Portugal than the one they have of Spain. In fact, it was shown
that Portuguese consumers evaluate Spain more positively than Portugal and it was not possible
to state that the affective image that they hold of Portugal is different from the one they hold of
Spain.
Concerning the second objective, it was possible to verify that Portuguese consumers
evaluate domestic products more positively than foreign ones. This was proven for all the
product categories (beer, clothes, and fruits) studied.
Figure 16. Line Chart (effect of COO and NI on the Product Image of Clothes). More detailed information on Tables D6, D7 and D8 of Appendix D.
22
As regards the last specific objective, in the case of Portuguese consumers’ perceptions
of Portugal and its products, it was proven that NI is an antecedent of both country image and
product image. Nevertheless, it was not proven that CE is an antecedent of the COO effect. The
only significant relationship found was between CE and the product image of clothes, which is
positive. In the case of Portuguese consumers’ perceptions of Spain and its products neither of
these constructs seems to be an antecedent of country image and product image.
The results of this study have proven that Portuguese consumers show a positive bias in
the evaluation of domestic products and that favorable consumers’ perceptions of their own
country and its products are positively impacted by the nationalist sentiment. So, NI helps to
understand why Portuguese consumers perceive domestic products as being better than foreign
ones. Thus, the overall aim of this research was met.
6.2 Implications, Limitations and Recommendations for Future Research
From a theoretical perspective, this study contributes to a better understanding of
consumers’ home-country bias. Firstly, it shows that Portuguese consumers do perceive domestic products as being better than foreign products. Secondly, it proves that NI has a
positive effect on the home-country image and on its products image and, consequently, it helps
to explain what the origin of consumers’ preference for domestic products is. Finally, it
demonstrates that CE has a weak or no impact at all on the COO effect. In a practical
perspective, this dissertation confirmed that consumers with a stronger bond with their nation
evaluate domestic products more positively so NI may be a useful construct for targeting
segments that are receptive to nationalist appeals and its strength should be enhanced at the
point of purchase by marketing actions (Verlegh, 2001). As the link between CE and product
image was not proven, marketers should focus more on the nationalist sentiment rather than on
23
The present dissertation is not exempt from limitations: firstly, it was used a
convenience sample of the Portuguese population, rather than a truly random sample, in which
there is a demographic concentration that can lead to biased study results. Thus, the use of a
more representative sample of the Portuguese population is suggested. Secondly, a limited
number of countries and product categories was considered. As it has been proven in previous
studies the COO effect is country- and product-specific, so in future researches more countries
and product categories should be analyzed in order to examine the generability of the results
obtained. Also, the constructs CE and NI were considered as antecedents of the COO effect and
as the link between CE and the COO effect was not proven to be significant it would be relevant
to test other variables as antecedents. The inclusion of the cosmopolitanism construct is
suggested since, as shown by Lee et al. (2014) cosmopolitan consumers possess a low
preference for domestic products. Finally, another possible limitation of this study is the usage
of country image and product image as dependent variables. It would be interesting if future
research could examine actual purchases and work backwards in order to better understand
consumers’ decision-making process and further understand consumers’ home country bias.
7. Reference List
Allred, Anthony, Goutam Chakraborty, and Stephen J. Miller. 2000. “Measuring Images
of Developing Countries: A Scale Development Study.” Journal of Euromarketing, 8 (3): 29–
49.
Balabanis, George, and Adamantios Diamantopolous. 2004. “Domestic Country Bias,
Country- of-Origin Effects, and Consumer Ethnocentrism: A Multidimensional Unfolding
Approach.” Journal of the Academy of Marketing Science, 32 (1): 80–95.
Bilkey, Warren J., and Erik Nes. 1982. “Country-of-Origin Effects on Product Evaluations.”
24 Brewer, Marilynn B. 1999. “The Psychology of Prejudice: Ingroup Love or Outgroup Hate?”
Journal of Social Issues, 55 (3): 429–44.
Diamantopoulos, Adamantios, Bodo Schlegelmilch, and Dayananda Palihawadana. 2011.
“The Relationship between Country-of-Origin Image and Brand Image as Drivers of Purchase Intentions: A Test of Alternative Perspectives.” International Marketing Review, 28 (5): 508–
24.
Dinnie, Keith. 2004. “Country-of-Origin 1965-2004: A Literature Review.” Journal of
Customer Behaviour, 3 (2): 165–213.
Drozdenko, Ronald, and Marlene Jensen. 2009. “Pricing Strategy & Practice: Translating
Country-of-Origin Effects into Prices.” Journal of Product and Brand Management, 18 (5):
371–78.
Duckitt, J., and T. Mphuthing. 1998. “Group Identification and Intergroup Attitudes: A
Longitudinal Analysis in South Africa.” Journal of Personality and Social Psychology, 74 (1): 80–85.
Filipe, Sara Brito. 2010. “O Estado Da Arte Da Marca Portugal.” GESTIN: Revista Da Escola
Superior de Gestão, May. https://repositorio.ipcb.pt/handle/10400.11/515.
Fligstein, Neil, Alina Polyakova, and Wayne Sandholtz. 2012. “European Integration,
Nationalism and European Identity.” Journal of Common Market Studies, 50 (1): 106–22.
Hair, Joseph F., William C. Black, Barry J. Babin, and Rolph E. Anderson. 2014.
Multivariate Data Analysis. 7th ed. Harlow: Pearson Education Limited.
Iacob, Andreaa Ioana. 2014. “Country-of-Origin Effect and Consumer Brand Perception.”.
25 Lantz, Garold, and Sandra Loeb. 1996. “Country of Origin and Ethnocentrism: An Analysis
of Canadian and American Preferences Using Social Identity Theory.” NA - Advances in
Consumer Research, 23: 374–78.
Lee, Kyung Tae, You Il Lee, and Richard Lee. 2014. “Economic Nationalism and
Cosmopolitanism: A Study of Interpersonal Antecedents and Differential Outcomes.”
European Journal of Marketing, 48 (5–6): 1133–58.
Leung, Shing On. 2011. “A Comparison of Psychometric Properties and Normality in 4-, 5-,
6-, and 11-Point Likert Scales.” Journal of Social Service Research, 37 (4): 412–21.
Papadopoulos, Nicolas, Louise A. Heslop, and Gary Bamossy. 1990. “A Comparative Image
Analysis of Domestic versus Imported Products.” International Journal of Research in Marketing, 7 (4): 283–94.
Portugal Sou Eu. 2019. Portugal Sou Eu. https://portugalsoueu.pt/. (accessed October 29, 2019).
Roth, Katharina P., and Adamantios Diamantopoulos. 2009. “Advancing the Country
Image Construct.” Journal of Business Research, 62 (7): 726–40.
Samiee, Saeed. 1994. “Customer Evaluation of products in a global market.” Journal of
International Business Studies, 25: 579–604.
Sharma, Piyush. 2011. “Country of Origin Effects in Developed and Emerging Markets:
Exploring the Contrasting Roles of Materialism and Value Consciousness.” Journal of
International Business Studies, 42 (2): 285–306.
Sharma, Subhash, Terence A. Shimp, and Jeongshin Shin. 1995. “Consumer
Ethnocentrism: A Test of Antecedents and Moderators.” Journal of the Academy of Marketing Science, 503 (1): 26–37.
26 Shimp, Terence A., and Subhash Sharma. 1987. “Consumer Ethnocentrism: Construction
and Validation of the CETSCALE.” Journal of Marketing Research, 24 (3): 280–89.
Silva, Carlos. 2014. “Do Efeito País de Origem Ao Uso Da Origem Portugal Como Estratégia
de Marca : Contributo Das Atitudes Dos Consumidores Portugueses Relativamente Ao Tomate
Processado e Ao Azeite Nacionais.” PhD diss. Universidade Aberta.
Silva, Guilherme. 2017. “Imagem Do País de Origem : Antecedentes e Consequentes Para o
Calçado Português e Italiano.” Master’s diss. Universidade de Coimbra.
Silva, Susana, and Lucénio Saraiva. 2016. “Understanding Changes on the Country-of-Origin
Effect of Portugal.” Studia Universitatis Babe-Bolyai Oeconomica, 61 (3): 3–19.
Valente, Ana Rita. 2018. “O Valor Da Marca «made In» Portugal.”Master’s diss. Escola
Superior Do Porto.
Verlegh, Peeter W. J., and Jan-Benedict E.M. Steenkamp. 1999. “A Review and
Meta-Analysis of Country-of-Origin Research.” Journal of Economic Psycology, 20: 521–46.
Verlegh, Peeter W J. 2001. Country-of-Origin Effects on Consumer Product Evaluations.
Wageningen: Wageningen Universiteit.
Wang, Cheng Lu, Dongjin Li, Bradley R. Barnes, and Jongseok Ahn. 2012. “Country
Image, Product Image and Consumer Purchase Intention: Evidence from an Emerging
Economy.” International Business Review, 21 (6): 1041–51.
Yagci, Mehmet I. 2001. “Evaluating the Effects of Country-of-Origin and Consumer
Ethnocentrism: A Case of a Transplant Product.” Journal of International Consumer Marketing, 13 (3): 63–83.
27 Appendix A: Questionnaire
Questionnaire – Version 1
My name is Francisca dos Santos and I am developing my dissertation of the master’s in
management at Nova School of Business and Economics. This aims to understand the effect of
country-of-origin on Portuguese consumers’ evaluation of different products.
Since the focus of this dissertation is Portuguese consumers, this questionnaire is directed to
everyone with Portuguese nationality.
This questionnaire is anonymous and there are no right or wrong answers, the goal is for you
to respond honestly. If you have not had previous experience with the products mentioned in
the present questionnaire, please, answer based on your perception.
For any clarification, you can contact me through the following email address:
33303@novasbe.pt.
Thank you for your collaboration!
1. Please indicate how much you agree or disagree with each of the following statements:
Totally Disagree Disagree Neither Agree nor Disagree Agree Totally Agree
1. Portugal is an affluent country. 2. Portugal is a developed country.
3. Portugal has advanced technology.
4. Portugal has high living standards.
5. In Portugal, people have a good standard of life. 6. Portugal is very concerned about the environment. 7. Portugal has hardworking workers.
28 8. Portugal has efficient workers.
9. Portugal has meticulous workers.
10. Portugal has creative workers.
2. Please indicate how much you agree or disagree with each of the following statements:
Totally Disagree Disagree Neither Agree nor Disagree Agree Totally Agree
1. I have positive feelings for Portugal.
2. I have pleasant feelings for Portugal.
3. I feel enthusiasm about Portugal.
4. I am distrustful about Portugal. (recoded)
5. I feel irritated about Portugal. (recoded)
6. I have hostile feelings for Portugal. (recoded)
3. Please indicate how much you agree or disagree with each of the following statements
regarding Portuguese beer.
Totally Disagree Disagree Neither Agree nor Disagree Agree Totally Agree 1. It is tasty.
2. It contains natural ingredients.
3. It smells good.
4. It has a pleasant texture.
29 6. It is good value for money.
7. In shops, it stands out from beer produced in other countries.
4. Please indicate how much you agree or disagree with each of the following statements
regarding clothes produced in Portugal.
Totally Disagree Disagree Neither Agree nor Disagree Agree Totally Agree
j1. They are trendy.
2. They have a good design.
3. They are long-lasting.
4. They have a pleasant texture.
5. They have good quality.
6. They are good value for money.
7. In shops, they stand out from clothes produced in other countries.
5. Please indicate how much you agree or disagree with each of the following statements
regarding Portuguese fruits.
Totally Disagree Disagree Neither Agree nor Disagree Agree Totally Agree
30 2. They do not contain additives.
3. They are nutritive.
4. They look good.
5. They have good quality.
6.They are good value for money.
7. In shops, they stand out from fruits grown in other countries.
6. Please indicate how much you agree or disagree with each of the following statements:
Totally Disagree Disagree Neither Agree nor Disagree Agree Totally Agree
1. Only those products that are unavailable in Portugal should be imported.
2. Portuguese products, first, last and foremost.
3. Purchasing foreign-made products is unpatriotic.
4. It is not right to purchase foreign products, because it puts Portuguese people out of jobs.
5. A true Portuguese should always buy Portugal-made products.
6. We should purchase products manufactured in Portugal instead of letting other countries getting rich at our expense.
7. The Portuguese should not buy foreign products, because this is bad for the Portuguese business and causes unemployment.
31 8. It may cost me in the long run, but I
prefer to support Portuguese products.
9. We should buy from foreign countries only those products that we cannot obtain within our own country.
10. Portuguese consumers who purchase products made in other countries are responsible for putting their fellow Portuguese out of work.
7. Please indicate how much you agree or disagree with each of the following statements:
Totally Disagree Disagree Neither Agree nor Disagree Agree Totally Agree 1. I am proud to be Portuguese. 2. Being Portuguese is not important to me. (recoded) 3. I don’t like it when someone has a negative opinion about Portugal. 4. I don’t feel any ties with Portugal. (recoded)
5. Being Portuguese means a lot to me. 8.Gender 9.Age <18 18-30 31-40 41-50 51-60 >60 Female Male
32
10.Educational level
Lower than High School High School
Bachelor’s Degree Postgraduate Degree Master’s Degree Doctorate
11. Monthly household net income
<1000€ 1001€-2000€ 2001€-3000€ >3000€ 12.Residence Portugal Foreign Country Questionnaire – Version 2
My name is Francisca dos Santos and I am developing my dissertation of the master’s in
management at Nova School of Business and Economics. This aims to understand the effect of
country-of-origin on Portuguese consumers’ evaluation of different products.
Since the focus of this dissertation is Portuguese consumers, this questionnaire is directed to
everyone with Portuguese nationality.
This questionnaire is anonymous and there are no right or wrong answers, the goal is for you
to respond honestly. If you have not had previous experience with the products mentioned in
33
For any clarification, you can contact me through the following email address:
33303@novasbe.pt.
Thank you for your collaboration!
1.Please indicate how much you agree or disagree with each of the following statements:
Totally Disagree Disagree Neither Agree nor Disagree Agree Totally Agree
1. Spain is an affluent country. 2. Spain is a developed country. 3. Spain has advanced
technology.
4. Spain has high living standards.
5. In Spain, people have a good standard of life.
6. Spain is very concerned about the environment.
7. Spain has hardworking workers.
8. Spain has efficient workers. 9. Spain has meticulous workers. 10. Spain has creative workers.
2. Please indicate how much you agree or disagree with each of the following statements:
Totally Disagree Disagree Neither Agree nor Disagree Agree Totally Agree
1. I have positive feelings for Spain.
2. I have pleasant feelings for Spain.
3. I feel enthusiasm about Spain. 4. I am distrustful about Spain. (recoded)
5. I feel irritated about Spain. (recoded)
34 6. I have hostile feelings for
Spain. (recoded)
3. Please indicate how much you agree or disagree with each of the following statements
regarding Spanish beer.
Totally Disagree Disagree Neither Agree nor Disagree Agree Totally Agree 1. It is tasty.
2. It contains natural ingredients.
3. It smells good.
4. It has a pleasant texture.
5. It has good quality.
6. It is good value for money.
7. In shops, it stands out from beer produced in other countries.
4. Please indicate how much you agree or disagree with each of the following statements regarding clothes produced in Spain.
Totally Disagree Disagree Neither Agree nor Disagree Agree Totally Agree
1. They are trendy.
2. They have a good design.
35 4. They have a pleasant texture.
5. They have good quality.
6. They are good value for money.
7. In shops, they stand out from clothes produced in other countries.
5. Please indicate how much you agree or disagree with each of the following statements regarding Spanish fruits.
Totally Disagree Disagree Neither Agree nor Disagree Agree Totally Agree
1. They are tasty.
2. They do not contain additives.
3. They are nutritive.
4. They look good.
5. They have good quality.
6. They are good value for money. 7. In shops, they stand out from fruits grown in other countries.
6. Please indicate how much you agree or disagree with each of the following statements:
Totally Disagree Disagree Neither Agree nor Disagree Agree Totally Agree
36 1. Only those products that are
unavailable in Portugal should be imported.
2. Portuguese products, first, last and foremost.
3. Purchasing foreign-made products is unpatriotic.
4. It is not right to purchase foreign products, because it puts Portuguese people out of jobs.
5. A true Portuguese should always buy Portugal-made products.
6. We should purchase products manufactured in Portugal instead of letting other countries getting rich at our expense.
7. The Portuguese should not buy foreign products, because this hurts the Portuguese business and causes unemployment.
8. It may cost me in the long run, but I prefer to support Portuguese products.
9. We should buy from foreign countries only those products that we cannot obtain within our own country. 10. Portuguese consumers who purchase products made in other countries are responsible for putting their fellow Portuguese out of work.
7. Please indicate how much you agree or disagree with each of the following statements:
Totally Disagree Disagree Neither Agree nor Disagree Agree Totally Agree 1. I am proud to be Portuguese. 2. Being Portuguese is not important to me. (recoded) 3. I don’t like it when someone has a negative opinion about Portugal.
37 4. I don’t feel any ties with
Portugal. (recoded)
5. Being Portuguese means a lot to me. 8.Gender 9.Age <18 18-30 31-40 41-50 51-60 >60 10.Educational level
Lower than High School High School
Bachelor’s Degree Postgraduate Degree Master’s Degree Doctorate
11. Monthly household net income
<1000€ 1001€-2000€ 2001€-3000€ >3000€ Female Male
38
12.Residence
Portugal Foreign Country
39 Appendix B: Demographic profile of participants
Table B1. Demographic profile of participants (n=648).
Frequency Percent Gender Female 457 70.5% Male 191 29.5% Age < 18 14 2.2% 18-30 163 25.2% 31-40 189 29.2% 41-50 195 30.1% >50 87 13.4%
Educational level Lower than High School 16 2.5%
High School 254 39.2%
Bachelor's Degree 235 36.3%
Postgraduate Degree 32 4.9%
Master's Degree 87 13.4%
Doctorate 24 3.7%
Monthly household net income <1000€ 121 18.7%
1001€-2000€ 266 41.0% 2001€-3000€ 135 20.8% >3000€ 126 19.4% Residence Portugal 497 76.7% Foreign country 151 23.3% Total 648 100.0%
40 Appendix C: Descriptive Statistics
Table C1. Descriptive Statistics of the dependent variables (n=648).
Country Cognitive component
of CI
Affective component of CI
PI: beer PI: clothes PI: fruits
Portugal Mean1 3.151 3.690 3.661 3.746 3.838 Std. Deviation 0.475 0.642 0.583 0.521 0.491 Spain Mean1 3.306 3.714 3.047 3.419 3.278 Std. Deviation 0.430 0.621 0.512 0.476 0.506
Note 1:1=strongly disagree; 2=disagree; 3=neither agree nor disagree; 4=agree; 5=strongly agree.
Figure C2. Line Chart (means of the items that measure the Affective Component of Country Image for Portugal and Spain).
Figure C1. Line Chart (means of the items that measure the Cognitive Component of Country Image for Portugal and Spain). In this figure, the values of the items used to measure the affective component of country image are not recoded.
41 Table C2. Descriptive Statistics of CE and NI (n=648).
Mean1 Median1 Std. Deviation
CE 2.972 3.000 0.809
NI 4.203 4.200 0.581
Note 1:1=strongly disagree; 2=disagree; 3=neither agree nor disagree; 4=agree; 5=strongly agree.
Table C3. Spearman’s correlation matrix for the dependent variables.
Cognitive component of CI Affective component of CI PI: beer PI: clothes PI: fruits Cognitive component of CI Correlation Coefficient 1.000 .251** 0.029 .203** .080* Sig. (2-tailed) . 0.000 0.459 0.000 0.041 N 648 648 648 648 648 Affective component of CI Correlation Coefficient .251** 1.000 .216** .177** .200** Sig. (2-tailed) 0.000 . 0.000 0.000 0.000 N 648 648 648 648 648
PI:beer Correlation Coefficient 0.029 .216** 1.000 .328** .443**
Sig. (2-tailed) 0.459 0.000 . 0.000 0.000
N 648 648 648 648 648
PI:clothes Correlation Coefficient .203** .177** .328** 1.000 .450**
Sig. (2-tailed) 0.000 0.000 0.000 . 0.000
N 648 648 648 648 648
PI:fruits Correlation Coefficient .080* .200** .443** .450** 1.000
Sig. (2-tailed) 0.041 0.000 0.000 0.000 .
N 648 648 648 648 648
Note: ** Correlation is significant at the 0.01 level (2-tailed); * Correlation is significant at the 0.05 level (2-tailed).
Table C4. Spearman’s correlation matrix for CE and NI.
CE NI CE Correlation Coefficient 1 .181** Sig. (2-tailed) . 0 N 648 648 NI Correlation Coefficient .181** 1 Sig. (2-tailed) 0 . N 648 648
42 Appendix D: Hypothesis testing
Table D1. One-way ANOVA table investigating the impact of COO on Country Image and Product Image.
Sum of Squares df Mean Square F Sig.
Cognitive component of CI Between Groups 3.850 1 3.850 18.582 0.000 Within Groups 133.841 646 0.207 Total 137.691 647 Affective component of CI Between Groups 0.093 1 0.093 0.231 0.631 Within Groups 258.638 646 0.400 Total 258.731 647 PI:beera Between Groups 60.643 1 60.643 199.126 0.000 Within Groups 196.738 646 0.305 Total 257.381 647 PI:clothes Between Groups 17.208 1 17.208 68.497 0.000 Within Groups 162.292 646 0.251 Total 179.500 647 PI:fruits Between Groups 50.222 1 50.222 202.876 0.000 Within Groups 159.918 646 0.248 Total 210.140 647
a The homoscedasticity assumption was not verified for this variable.
Table D2. Estimated Marginal Means of the dependent variables by COO.
Dependent Variable COO Mean Std. Error 95% Confidence Interval
Lower Bound Upper Bound
Cognitive Component of Country Image Portugal 3.151 0.024 3.103 3.198
Spain 3.305 0.027 3.253 3.358
Affective Component of Country Image Portugal 3.69 0.034 3.625 3.756
Spain 3.714 0.037 3.642 3.787
Product Image of Beer Portugal 3.661 0.029 3.604 3.718
Spain 3.046 0.032 2.983 3.11
Product Image of Clothes Portugal 3.746 0.027 3.694 3.798
Spain 3.419 0.029 3.361 3.476
Product Image of Fruits Portugal 3.838 0.026 3.786 3.890
Spain 3.278 0.029 3.221 3.336
Table D3. Two-way ANOVA table investigating the effect of COO and CE on Country Image and Product Image.
Source Dependent Variable Type III
Sum of Squares
df Mean Square F Sig.
Corrected Model Cognitive component
of Country Image
4.752a 3 1.584 7.674 0.000
Affective component of Country Image
6.490b 3 2.163 5.523 0.001
Product Image of Beer 60.991c 3 20.33 66.668 0.000
Product Image of Clothes 19.323d 3 6.441 25.896 0.000
Product Image of Fruits 51.272e 3 17.091 69.28 0.000
Intercept Cognitive component
of Country Image
43
Affective component of Country Image
8795.952 1 8795.952 22457.08 0.000
Product Image of Beer 7214.637 1 7214.637 23658.21 0.000
Product Image of Clothes 8230.754 1 8230.754 33092.16 0.000
Product Image of Fruits 8122.797 1 8122.797 32927.12 0.000
CE Cognitive component of Country Image 0.452 1 0.452 2.188 0.140 Affective component of Country Image 6.343 1 6.343 16.194 0.000
Product Image of Beer 0.018 1 0.018 0.06 0.807
Product Image of Clothes 0.958 1 0.958 3.851 0.050
Product Image of Fruits 0.934 1 0.934 3.785 0.052
COO Cognitive component of Country Image
3.893 1 3.893 18.857 0.000
Affective component of Country Image
0.077 1 0.077 0.196 0.658
Product Image of Beer 60.613 1 60.613 198.763 0.000
Product Image of Clothes 17.069 1 17.069 68.628 0.000
Product Image of Fruits 50.346 1 50.346 204.087 0.000
CE * COO Cognitive component
of Country Image
0.362 1 0.362 1.754 0.186
Affective component of Country Image
0.232 1 0.232 0.592 0.442
Product Image of Beer 0.342 1 0.342 1.122 0.290
Product Image of Clothes 0.948 1 0.948 3.812 0.051
Product Image of Fruits 0.188 1 0.188 0.764 0.382
Error Cognitive component
of Country Image
132.939 644 0.206
Affective component of Country Image
252.241 644 0.392
Product Image of Beer 196.39 644 0.305
Product Image of Clothes 160.177 644 0.249
Product Image of Fruits 158.868 644 0.247
Total Cognitive component
of Country Image
6857.96 648
Affective component of Country Image
9135.698 648
Product Image of Beer 7677.843 648
Product Image of Clothes 8570.885 648
Product Image of Fruits 8542.183 648
Corrected Total Cognitive component
of Country Image
137.691 647
Affective component of Country Image
258.731 647
Product Image of Beer 257.381 647
Product Image of Clothes 179.5 647
Product Image of Fruits 210.14 647 a R Squared = .035 (Adjusted R Squared = .030)
b R Squared = .025 (Adjusted R Squared = .021) c R Squared = .237 (Adjusted R Squared = .233) d R Squared = .108 (Adjusted R Squared = .103) e R Squared = .244 (Adjusted R Squared = .240)