Validation and application of sand pile modeling of
multiseeded HTS bulk superconductors
João Murta-Pina,
Member, IEEE,
Pedro Pereira, José Maria Ceballos, Alfredo Álvarez, Nuno Amaro, Anabela
Pronto, Jorge Silva and Pedro Arsénio
Abstract—Sand pile and Bean models have already been applied to describe single grain HTS bulks. An extension to that approach was used to model multiseed bulks, needed for several practical applications as electric motors or flywheels with superconducting bearings. The use of genetic algorithms was then proposed in order to determine intra- and intergrain current densities, and application to two and three seeds samples using trapped flux experimental measurements was exemplified. However, this model assumed some simplifications, as equal properties in grain boundaries between neighboring grains. In this paper an extension to this methodology is proposed and evaluated by analyzing measurements performed in plans at different distances from surfaces of samples with three seeds. Discussion of its influence on a practical application is also explored.
Index Terms— Genetic algorithms, multiseeded superconductors, sand pile model, trapped flux.
I. INTRODUCTION
HE ADVENT OF MOTORS or other power devices employing trapped flux superconducting bulk materials relies on the ability to model these materials properly in the design stage [1]-[3]. This is particularly relevant in ironless devices, as magnetic flux lines are spread in surrounding medium. In a previous work, the force developed by an all superconducting linear motor was derived by averaging magnetic flux density of two trapped flux magnets over the volume of superconducting coils in the armature of the motor [4]. This flux density was calculated by means of sand pile model [5], where persistent currents are assumed to flow in concentric loops parallel to sample edges. Biot-Savart law is then used for straightforward calculation of flux density components in any point in space. Originally, only single grain materials were considered, and an extension of these models to multiseeded materials was proposed in [6], by combining intra- and intergrain current densities, as shown in Fig. 1. Determination of current densities from measurements of trapped flux was then carried out by genetic algorithms (GA), a class of
This work was supported by national funds through FCT Fundação para a Ciência e a Tecnologia, under project PEst-OE/EEI/UI0066/2011.
J. Murta-Pina, P. Pereira, N. Amaro, A. Pronto and P. Arsénio are with the Centre of Technology and Systems, Faculdade de Ciências e Tecnologia, Quinta da Torre, 2829-516 Caparica, Portugal, e-mail: jmmp@fct.unl.pt.
J. M. Ceballos and A. Álvarez are with the Electrical Engineering Department, University of Extremadura, 06071 Badajoz, Spain, e-mail: aalvarez@unex.es.
J. Silva is with Faculdade de Ciências e Tecnologia, Quinta da Torre, 2829-516 Caparica, Portugal.
computational models inspired in natural evolution that perform parallel search [7]. It was assumed that grain boundaries shared the same properties, thus a single intergrain current was considered. This limitation is now addressed in the present work by considering loops between adjacent grains, for a three seeds sample.
Fig. 1. Sand pile modeling of multiseeded samples consisting on the superposition of intragrain (top) and intergrain (bottom) current loops. Illustration for a three seeds sample.
The paper is organized as follows: methods are reviewed in the next section and the proposed extension of sand pile modeling is also presented. In section III, the new methodology is evaluated and discussed by analysis of experimental measurements of trapped flux at different heights. Conclusions are drawn in the last section of the paper.
II. METHODS
A. Sand pile modeling of one single grain
Each grain (conceptually consisting on a set of intra- or intergrain current loops that share the same current density, as already represented in Fig. 1) generates a field B at any point P in space which can be derived by Biot-Savart law. Simple
expressions for B components are derived in [5] or [7]. Bean
model [8] is considered, meaning that current flowing in each loop is determined by constant critical current density of the sample, JC.
B. Modeling of three seeds samples
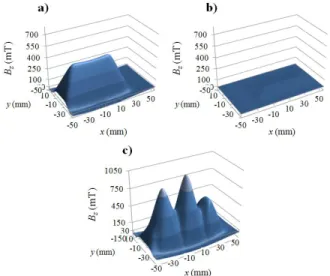
Using the concept represented in Fig. 1, the field of a three seeds sample at a distance Z0 from surface corresponds to the
superposition of four fields [3], each originated by its critical current density, JC1 to JC4, as exemplified in Fig. 2.
Fig. 2. Normal component of flux density of an artificial three seeds sample determined by sand pile modeling [3]. It consists on the superposition of the effects of intragrain (JC1 to JC3) and intergrain (JC4) current loops. Values considered for this example are (a) JC1 = 120 A/mm2, (b) JC2 = 150 A/mm2, (c) JC3 = 130 A/mm2, and (d) JC4 = 50 A/mm2, where (e) is the superposition of all flux densities. Measurement height is Z0 = 3 mm and the size of each grain is 28 × 39 × 13 mm3 resulting in a bulk of 84 × 39 × 13 mm3.
C. Genetic algorithms
The purpose of using GA is to determine current densities
of a sample, * * * * *
1 2 3 4
C C C C
J J J J
J , from real measurements of
normal component of trapped flux in a plan located at z = Z0,
*
0
, , ,
z
B J x y Z . Each individual, corresponding to a possible
solution of this problem, is built by the concatenation of intragrain current densities followed by intergrain current density, i.e. JJC1 JC2 JC3 JC4. Flux density corresponding
to J is defined as Bˆz
J, , ,x y Z0
. GA applies a fitness function,
J , to evaluate each solution and in this work the normalized root mean square deviation (NRMSD) between these distributions over the considered domain is used,
2 *
max min
, , , ,
100% Bz x y Bz x y
B B
N
J J J (1)
where N is the number of points evaluated and Bmax and Bmin
are the maximum and minimum values of Bz in the domain, respectively. The only considered restriction is
4 0
Cm C
J J ,m1,2,3, meaning that intergrain current is
always smaller than intragrain currents.
By applying GA with the previous model to the sample with
trapped flux shown in Fig. 3.a) (sample #1), current densities
88.20 103.90 87.51 81.07
J A/mm2 were found as the best
solution (see details in [3]), with ε = 18.8%. The modeled sample is represented in Fig. 3.b).
Fig. 3. (a) Trapped flux in sample #1 (three seeds), with measurement height 0.5 mm, sample dimensions 67 × 34 × 15 mm3, width of grains assumed 20, 24 and 23 mm, after inspection of isolines of flux density. Measurement region is 70 × 40 mm2. Corresponding sand pile modeling with
J = 88.20|103.90|87.51|81.07 A/mm2 is represented in (b).
This approach is adequate for practical applications in which samples show fairly good balance between peaks and/or valleys in flux density profiles. This is not the case, however, of sample #2 in Fig. 4.a), where valleys are clearly distinct. In
this case, the best solution,
83.48 59.21 69.55 46.98
J A/mm2, leads to ε = 19.8%, and
modeling results are shown in Fig. 4.b). The distinction between the valleys is lost.
Fig. 4. (a) Trapped flux in sample #2 (three seeds), with measurement height 2 mm, sample dimensions 78 × 39 × 13 mm3, width of grains assumed 30, 19 and 29 mm, after inspection of isolines of flux density. Measurement region is 56 × 28 mm2. Corresponding sand pile modeling with
J = 83.48|59.21|69.55|46.98 A/mm2) is represented in (b).
D. Modeling extension of three seeds samples
In order to mitigate the previous limitation, an extension to the modeling of three seeds samples is proposed, based on considering two distinct intergrain currents, as represented in Fig. 5. Each solution of GA is now represented as
1 2 3 4 5
C C C C C
J J J J J
J and restrictions are defined as
0
Cm Ck
J J , m = 1, 2, 3 and k = 4, 5.
The field of a three seeds sample at a height Z0 from surface
Fig. 5. Sand pile modeling extension of three seeds samples consisting on the superposition of intragrain (JC1 to JC3) and intergrain (JC4 and JC5) current loops.
Fig. 6. Normal component of flux density of an artificial three seeds sample determined by extended sand pile modeling. It consists on the superposition of the effects of intragrain (JC1 to JC3) and intergrain (JC4 and JC5) current loops. Values considered for this example are again JC1 = 120 A/mm2, JC2 = 150 A/mm2 and JC3 = 130 A/mm2, while (a) JC4 = 80 A/mm2 and (b) JC5 = 5 A/mm2. The superposition of all flux densities is shown in (c). Measurement height is Z0 = 3 mm and the size of each grain is 28 × 39 × 13 mm3.
III. EVALUATION OF THE PROPOSED METHODOLOGY In order to validate the modeling approach, trapped flux profiles at different heights (2, 4 and 10 mm) were analyzed for sample #2. Flux density contours at the different heights are represented in Fig. 7. Field profiles at y = 0 are compared
in Fig. 8.
A. Current densities determination using different height measurements
Using the proposed methodology, current densities were determined for each of the heights, as well as their averages. Numerical values are shown in Table I and comparisons between these are represented in Fig. 9. Ideally, each JCm,
1 5
m would be independent of the measurement height
used for its determination.
Fig. 7. Contour lines of sample #2 trapped flux, measured at heights 2, 4 and 10 mm.
Fig. 8. Trapped flux density profiles at y = 0 mm in sample #2. TABLEI
CURRENT DENSITIES DETERMINED BY EXTENDED METHODOLOGY FOR EACH HEIGHT USED
Current density
(A/mm2) Z0 = 2 mm Z0 = 4 mm Z0 = 10 mm
Average value (A/mm2)
JC1 103.30 71.40 69.95 81.55
JC2 80.82 58.85 50.54 63.40
JC3 89.01 78.68 71.00 79.56
JC4 16.87 23.77 15.82 18.82
JC5 31.96 25.88 34.62 30.82
In order to assess the quality of the modeled flux density distributions with extracted current densities, NRMSD values were calculated for all heights. These are plotted in Fig. 10, where it is clear that ε is much higher when currents evaluated at Z0 = 2 mm are used (except for ε calculated for this height).
This figure shows that JC’s inferred at 2 mm lead to poor
results if these are used to predict fields distributions at other heights, when compared with JC’s inferred at 4 or 10 mm. On
the other hand, if JC’s are averaged, this effect is attenuated.
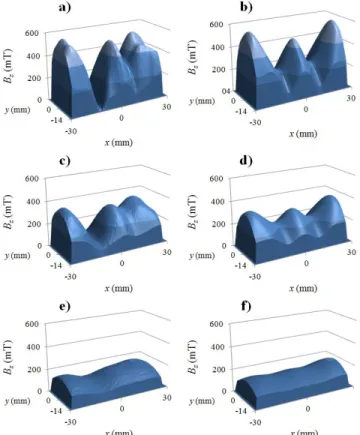
A comparison of real and modeled trapped flux distributions is shown in Fig. 11 for best NRMSD values in each height.
B. Influence of differences of extracted currents on practical applications
In spite of the differences in determined currents at different heights, particularly at Z0 = 2 mm, its influence on predicting
Fig. 9. Comparison of values of currents determined by the extended methodology applied at measurements at 2, 4 and 10 mm height. Average value is also shown.
Fig. 10. Comparison of NRMSD, ε, for values of currents determined by the extended methodology applied at measurements at 2, 4 and 10 mm height. NRMSD calculated with average current values is also shown.
Fig. 11. Measured vs. modeled distributions of trapped flux, namely (a) and (b) at Z0 = 2 mm, (c) and (d) at Z0 = 4 mm and (e) and (f) at Z0 = 10 mm. Models are built with current densities that lead to lower NRMSD, which correspond to the ones derived at the corresponding height of measurement.
In that work, flux density due to trapped flux magnets is averaged over the height of the armature coils (made of BSCCO tapes), and then over its width. This is now performed for z corresponding to the three heights and for y covering the
whole measurement width (28 mm). The average flux density obtained with real measurements is compared with the average obtained with currents evaluated at different heights and with mean currents. This comparison is performed by means of the calculation of the NRMSD between average profiles. Results are plotted in Fig. 12, where, as expected, using currents determined for measurements at Z0 = 2 mm leads to relative
differences comparing to other heights.
Fig. 12. Comparison of NRMSD between average flux profiles calculated with currents evaluated at different heights and average flux profile obtained from real measurements.
IV. CONCLUSIONS
In this paper, a methodology for modeling multiseeded bulk superconducting samples is proposed, as an extension to previous work were some simplifications were made, namely assuming equal grain boundary characteristics. By measuring trapped flux distribution in samples it is possible to use this methodology in designing devices employing these materials. A linear motor described elsewhere is used as application, but other devices are envisaged, as e.g. flywheels with superconducting bearings. Special care has to be taken when using single plan measurements, as is demonstrated when
Z0 = 2 mm. Differences observed may be due to incorrect
height measurement (owing to materials contraction), but this is masked by averaging current densities evaluated at distinct heights. If currents inferred only at this height were used to derive field values at other height (as in the case of the linear motor previously mentioned), then considerable errors would be expected when deriving e.g. developed forces. On the other hand, using averaged values compensates these errors. One limitation of the current work is related with correct definition of grain sizes. These will be automatically determined in future work, integrating this issue in the optimization problem solved by the genetic algorithms.
ACKNOWLEDGMENT
REFERENCES
[1] Z. Huang, M. Zhang, W. Wang, and T. A. Coombs, “Trial Test of a Bulk-Type Fully HTS Synchronous Motor,” IEEE Transactions on Applied Superconductivity, vol. 24, no. 3, pp. 1-5, June 2014.
[2] Z. Deng, M. Miki, K. Tsuzuki, B. Felder, R. Taguchi, N. Shinohara, and M. Izumi, “Pulsed Field Magnetization Properties of Bulk RE-Ba-Cu-O as Pole-Field Magnets for HTS Rotating Machines,” IEEE Transactions on Applied Superconductivity, vol. 21, no. 3, pp. 1180-1184, June 2011. [3] Y. Terao, M. Sekino, and H. Ohsaki, “Design study of linear
synchronous motors using superconducting coils and bulks,” in
International Power Electronics Conference (IPEC), Sapporo, Japan, 2010.
[4] J. M. Pina, M. Ventim Neves, A. Álvarez, and A. L. Rodrigues, “Numerical Design Methodology for an All Superconducting Linear Synchronous Motor,” em Technological Innovation for Sustainability, vol. 349, L. Camarinha-Matos, Ed., Springer Boston, 2011, pp. 553-62. [5] H. Fukai, M. Tomita, M. Murakami, and T. Nagatomo, "The effect of
geometry on the trapped magnetic field in bulk superconductors," Superconductor Science and Technology, vol. 15, no. 7, pp. 1054-1057, July 2002.
[6] J. M. Pina, P. Pereira, D. Valadas, J. M. Ceballos, and A. Álvarez, "Sand pile modeling of multiseeded HTS bulk superconductors: current densities identification by genetic algorithms," IEEE Transactions on Applied Superconductivity, vol. 23, no. 3, June 2013, Art. No. 8000804. [7] A. Aydıner, and E. Yanmaz, "Numerical calculation of trapped magnetic
field for square and cylindrical superconductors," Superconductor Science and Technology, Vols. 18, no. 7, pp. 1010-1015, July 2005. [8] C. P. Bean, “Magnetization of High-Field Superconductors,” Review of

![Fig. 2. Normal component of flux density of an artificial three seeds sample determined by sand pile modeling [3]](https://thumb-eu.123doks.com/thumbv2/123dok_br/16700044.743979/2.918.95.420.77.508/normal-component-density-artificial-seeds-sample-determined-modeling.webp)