Sara Maria Francisco da Costa
Licenciada em Biologia
Towards modification of
Medicago truncatula
epigenome: genome editing with engineered nucleases
Dissertação para obtenção do Grau de Mestre em Genética Molecular e Biomedicina
Orientador: Pedro Fevereiro, Professor Doutor, Faculdade de
Ciências da Universidade de Lisboa/ Instituto de Tecnologia Química e
Biológica
Co-orientador: Catarina Pimentel, Doutora, Instituto de
Tecnologia Química e Biológica
Júri:
Presidente: Professora Doutora Ilda Maria Barros dos Santos Gomes Sanches Orientador: Professor Doutor Manuel Pedro Salema Fevereiro
Arguente: Doutora Ana Sofia Roldão Lopes Amaral Duque
Faculdade de Ciências e Tecnologia
Universidade Nova de Lisboa
Sara Maria Francisco da Costa
Licencidada em Biologia
Towards modification of
Medicago truncatula
epigenome: genome editing with engineered
nucleases
Dissertação para obtenção do Grau de Mestre em Genética Molecular e Biomedicina
Orientador: Pedro Fevereiro, Professor Doutor, Faculdade de
Ciências da Universidade de Lisboa/ Instituto de Tecnologia Química e
Biológica
Co-orientador: Catarina Pimentel, Doutora, Instituto de Tecnologia
Química e Biológica
Júri:
Presidente: Professora Doutora Ilda Maria Barros dos Santos Gomes Sanches Orientador: Professor Doutor Manuel Pedro Salema Fevereiro
Arguente: Doutora Ana Sofia Roldão Lopes Amaral Duque
Towards modification of Medicago truncatula epigenome: genome editing with engineered nucleases
Copyright Sara Maria Francisco da Costa, FCT/UNL, UNL
i
Acknowledgements/ Agradecimentos
Para mim esta tese foi o despertar para uma nova realidade que me fez sair da zona de conforto. Gostaria de conseguir transmitir a todos os que estiveram presentes ao longo deste último ano o quanto me sinto grata. A falta de talento com as palavras não me permitirá fazer os devidos agradecimentos a todos os que, pelo mais simples gesto, me fizeram chegar até aqui. Assim, fica aqui o melhor que consigo transmitir.
Ao Professor Pedro Fevereiro, pela liberdade que me deu enquanto orientador por ter ouvido todas as ideias e teorias com um espirito aberto. Agradeço todo o apoio e paciência ao longo desta tese
e todos os conselhos sobre a vida na ciência, incluindo os “abre-olhos” quando ficava frustrada por não ter os resultados esperados. E, também, por me ter feito ganhar os meus dias cada vez que ouvia
“Bom trabalho, Sara”.
À Doutora Catarina Pimentel, pelo apoio, paciência (sobretudo nesta fase final) e amizade que sempre demonstrou. Confesso que senti receio no início da tese quando soube que ia ter uma co-orientadora. Neste momento, sinto-me grata por a ter tido ao meu lado nesta tese. Obrigada por todos
os “boa miúda” e os “seu verme horrível” que me incentivaram a dar o meu melhor. Agradeço as
partilhas de histórias e vivências e todos os importantes conselhos sobre o futuro na ciência.
À Professora Claudina Rodrigues-Pousada por me ter recebido no seu laboratório e me ter feito sentir como sua aluna. E, sobretudo, por ter sido um exemplo de força, capacidade de luta e determinação ao longo deste ano.
A todos os membros do BCV/PlantX e do GMS pelo apoio e acompanhamento, em especial à Catarina Amaral, cuja ajuda foi mais do que preciosa.
À Soraia Caetano, pela amizade que foi crescendo e ganhando raízes ao longo deste ano, pelos desabafos e pelas gargalhadas nas alturas mais difíceis. Obrigada por me teres deixado assaltar o teu armário de soluções, extremamente organizado, e por festejares comigo todos os meus positivos. Foste e continuarás a ser um pilar fundamental.
À Carolina Gomes, por ter sido a melhor pessoa com quem podia partilhar esta nova etapa. Dizem que, quem ultrapassa o mestrado lado a lado, cria amizade para o resto da vida. Acredito profundamente que assim seja.
À Olívia Costa pelo apoio incondicional, por acreditar em mim mais do que eu própria e por ter estado ao meu lado sempre que precisava de ajuda. Obrigada pela amizade e carinho que demonstraste desde o dia em que me conheceste e por seres uma excelente ouvinte.
ii
Ao Gonçalo, por me ter ouvido atentamente enquanto relatava pormenorizadamente as minhas novas descobertas e sobretudo pelo apoio incansável em todos os momentos menos bons. Obrigada por teres estado ao meu lado em Salamanca, pelas palavras de ânimo e boa disposição ao longo do penoso processo que foi a escrita da tese e por teres sempre acreditado em mim.
À minha mãe, por vibrar com os meus sucessos e por me animar nas alturas mais difíceis.
Obrigada por todos os “Força filha, tu consegues” que se tornaram essenciais e muitas vezes me deram o alento necessário para continuar.
iii
Resumo
A seca é um dos factores que mais afecta a produtividade agrícola. O aumento da população mundial aliado às alterações climáticas levou à diminuição das fontes de água, sendo um dos maiores desafios da agricultura moderna aumentar a produção alimentar humana e animal.
A metilação de novo do DNA é um processo regulado por pequenos RNAs de interferência
(siRNAs) que estão envolvidos na resposta das plantas ao stress abiótico. Na leguminosa modelo
Medicago truncatula, há evidências que sugerem uma ligação entre as vias de siRNAs e resposta ao
deficit hídrico.
Para compreender o papel da metilação do DNA em condições de seca, foram estabelecidas
metodologias bioinformáticas e moleculares que permitiram o desenho de sistemas como os ‘Clustered regularly interspaced short palindromic repeats’ (CRISPR)/Cas9 e a construção de TALENS (‘transcription activator-like effector nucleases’), para introduzir lesões dirigidas em dois genes que codificam enzimas envolvidas na via de metilação do DNA mediada por RNA - Dicer-like 3 (MtDCL3) e RNA-Dependent RNA polymerase (MtRDR2).
A actividade dos TALENs foi avaliada através de um ensaio em leveduras utilizando duas estratégias diferentes: electroforese em gel de poliacrilamida (PAGE) e análise da conformação de polimorfismos em cadeia simples (SSCP). Neste ensaio, a transformação tripla das células de levedura revelou-se uma alternativa rápida e eficaz relativamente às estratégias que envolvem mating. A técnica
de PAGE pode ser uma ferramenta valiosa para testar a eficiência dos TALENs in vivo desde que a
sua actividade seja aumentada. A estratégia baseada na análise por SSCP provou ser ineficaz devido ao elevado número de falsos positivos.
Futuramente, os TALENs e o sistema CRISPR/Cas9, permitirão a introdução de mutações nos genes da DCL3 e RDR2 permitindo o estudo da relação entre a resistência ao stress e regulação epigenética mediada por siRNAs em M. truncatula.
Palavras-chave
v
Abstract
Periodic drought is the primary limitation of plant growth and crop yield. The rise of water demand caused by the increase in world population and climate change, leads to one of the biggest challenges of modern agriculture: to increase food and feed production.
De novo DNA methylation is a process regulated by small interfering RNA (siRNAs), which
play a role in plant response and adaptation to abiotic stress. In the particular case of water deficit, growing evidences suggest a link between the siRNA pathways and drought response in the model legume Medicago truncatula.
As a first step to understand the role of DNA methylation under water stress, we have set up several bioinformatics and molecular methodologies allowing the design of Clustered regularly interspaced short palindromic repeats (CRISPR)/Cas9 systems and the assembly of TALENs (transcription activator-like effector nucleases), to target both dicer-like 3 (MtDCL3) and RNA-Dependent RNA polymerase (MtRDR2), enzymes of the RNA-directed DNA methylation pathway.
TALENs efficiency was evaluated prior to plant transformation by a yeast-based assay using two different strategies to test TALENs activity: Polyacrylamide gel electrophoresis (PAGE) and Single strand conformation polymorphisms (SSCP). In this assay, yeast cells triple transformation emerged as good and rapid alternative to laborious yeast mating strategies. PAGE analysis might be a valuable tool to test TALENs efficacy in vivo if we could increase TALENs activity. SSCP-based
approach proved to be ineffective due to the generation of several false positives.
TALENs and CRISPR/Cas9 system constructed and designed in this work will in the future certainly enable the successful disruption of DCL3 and RDR2 genes and shed the light on the relationship between plant stress resistance and epigenetic regulation mediated by siRNAs in
M.truncatula.
Keywords
vii
General Contents
Acknowledgements/ Agradecimentos ... 0
Resumo ... iii
Palavras-chave ... iii
Abstract ... v
Keywords………..v
General Contents ... vii
Figure Contents ... ix
Table Contents ... xiii
List of abreviations ... xiv
1 Introduction ... 1
1.1 Agriculture and water deficit ... 1
1.2 Medicago truncatula as a model plant ... 1
1.3 Epigenetic control of gene expression ... 2
1.4 Epigenetic modulation of gene expression and stress response ... 4
1.5 Genome editing using nucleases ... 4
1.5.1 Zinc Finger Nucleases………5
1.5.2 Transcription activator-like effectors nucleases……….6
1.5.3 CRISPR/ Cas9 system………7
1.6 Objectives ... 9
2 Materials and Methods ... 11
2.1 TALENs construction ... 11
2.1.1 Bioinformatic analysis………..11
2.1.2 TALEN assembly via Golden Gate………..11
2.2 TALEN’s functionality: Yeast based-assay ... 13
2.2.1 Medicago truncatula DNA extraction………. 13
2.2.2 Constructs……… 14
2.2.3 Yeast competent cells……….. 14
2.2.4 Yeast cells triple transformation……….. 15
2.2.5 Polyacrylamide gel electrophoresis (PAGE) analysis………. 15
2.2.6 Single Strand Conformation Polymorphisms (SSCP) analysis………... 15
2.3 CRISPR-Cas9 system target sites identification ... …..16
viii
3.1 Design of DCL3 and RDR2 TALENs ... 17
3.1.1 Identifying the region to be targeted……… 17
3.1.2 Choosing the best TALENs………. 19
3.1.3 T-DCL3 and T-RDR2 construction………. 20
3.1.4 Testing TALENs effectiveness – Yeast based assay………... 22
3.1.5 T2-DCL3 and T2-RDR2 construction………. 26
3.2 CRISPR/Cas9 system target sites identification ... 27
4 Discussion ... 29
5 Conclusions and Future Work ... 31
6 References ... 33
ix
Figure Contents
Figure 1.1 Models for PTGS and TGS. In PTGS (left side of the figure), dsRNAs are cleaved into small RNAs that pair with complementary mRNAs and mediate their degradation (indicated by the red cross). In TGS (right side of the figure), dsRNAs are cleaved into small RNAs that direct the methylation of corresponding DNA sequences (blackovals). This promoter methylation inhibits transcription, as indicated by the red cross. Adapted from Sijen et al., 2001. ... 2
Figure 1.2RdDM pathway. Transcription of non-coding regions (heterochromatic regions, repeat regions or transposons) by Poli IV results in the formation of ssRNA which is convert into dsRNA by the action of RDR2. This dsRNA is processed into predominantly 24-nt long siRNAs by DCL3. These siRNAs are methylated by HEN1 and associate with AGO4 or AGO6 to form a RNA-directed DNA methylation effector complex that lead to the methylation of target loci. ... 3
Figure 1.3Models for NHEJ and HR mechanisms. (A) NHEJ mechanism. In step 1, DNA is damaged by an external agent, represented by the lightning symbol, and this result in a DSB (step2). In step 3, DNA is either removed by repair enzymes and religated resulting in a delection or DNA is inserted. (B) HR mechanism. In step 1 DNA is damaged by an external agent, represented by the lightning symbol, and this results in a DSB (step2). IN step 3, damaged DNA binds to donor DNA at a point of homology and repair enzymes copy information from the donor DNA. Th break is repaired resulting in gene conversion in the chromossome as symbolized by the black box. Adapted from Wright et al., 2014. ... 5
Figure 1.4 DNA recognition by zinc-finger nucleases (ZFNs). Scheme of a ZFN dimer bound to a typical, non-palindromic DNA target. Each ZFN consists of the cleavage domain of FokI fused to a zinc-finger domain protein (ZFP) that has been customized to specifically recognize either a left or right half-site (indicated by blue and red boxes), which are separated by a spacer of either 5 or 6 bp. Simultaneous binding by both ZFNs enables dimerization of the FokI nuclease domain and DNA cleavage. Adapted from Miller et al., 2007. ... 6
x
the target site to enable FokI to dimerize and cleave DNA. NLS, nuclear localization signal(s); AD, transcriptional activation domain. Adapted from Cermak et al., 2011. ... 7
Figure 1.6CRISPR/Cas9 system. The system consists of a single-guided RNA which guides the Cas9 nuclease to the genomic target site. Genomic target site has usually 20 base pairs (bp) of homology with the gRNA and a PAM sequence. Cleavage of both strands of target DNA occurs near the PAM. ... 8
Figure 3.1 Intermediate constructs of T-DCL3. (A) pFUS_A clones were amplified by PCR and analysed in a 1% agarose gel: lanes 2 and 5 correspond to positive clones (lane 2 is the left array and lane 5 is the right array), lanes 3 and 6 indicate empty vector clones, lanes 4, 7, 8 and 9 indicate negative clones, lane 10 is the control for pFUS_A vector alone (empty vector) and lane 11 is the negative control. The ladder Gene RulerTM 1Kb DNA was used to indicate fragments size (lanes 1 and 12). (B) pFUS_B clones were amplified by PCR and analysed in a 2% agarose gel. Lanes 2, 3 and 4 indicate positive constructs, lane 5 corresponds to a negative clone, lane 6 is the control for pFUS_B5 vector alone and lane 7 is the negative control. Lanes 1 and 8 contain Gene RulerTM 1Kb DNA ladder.20
Figure 3.2 Intermediate constructs of T-RDR2. (A) pFUS_A clones were amplified by PCR and analysed in a 1% agarose gel: lanes 6, 9 and 12 correspond to positive clones (lane 6 is the left array and lanes 9 and 12 are the right array), lanes 2-5, 7, 8, 10 and 11 indicate negative clones, lane 13 is the control for pFUS_A vector alone (empty vector) and lane 14 is the negative control. The ladder Gene RulerTM 1Kb DNA was used to indicate fragments size (lane 1 and 15). (B) pFUS_B6 clones were amplified by PCR and analysed in a 2% agarose gel. Lanes 5, 8 and 9 indicate positive constructs (lane 5 is the left array and lanes 8 and 9 are the right arrays), lanes 2, 4, 6 and 7 correspond to a negative clones, , lanes 3, 11, 12 indicate empty vectors lane 13 correspond to the control for pFUS_B6 vector and lane 14 is the negative control. Lanes 1 and 15 contain Gene RulerTM 1Kb DNA ladder. ... 21
xi
Figure 3.4 Final constructs for T-RDR2 (A) pTAL3-RDR2 clones were amplified by PCR and analysed in a 1% agarose gel: lanes 3 and 4 correspond to positive clones, lanes 2 and 5 indicate negative clones, lane 6 corresponds to the amplification of pTAL empty vector and lane 7 is the negative control. The ladder Gene RulerTM 1Kb DNA was used to indicate fragments size (lane 1and 8); (B) pTAL4-RDR2 clones were amplified by PCR and analysed in a 1% agarose gel: lanes 2 corresponds to a positive clone, lanes 3- 5 indicate negative clones, lane 6 corresponds to the amplification of pTAL empty vector. The ladder Gene RulerTM 1Kb DNA was used to indicate fragments size (lane 1) ... 22
Figure 3.5 PAGE analysis of T-DCL3 activity in vivo. TALEN target region of yeast triple-transformants were PCR amplified and evaluated on a 20% polyacrylamide gel: lane 5 corresponds the control for pTS_DCL3, lanes 2, 4, 5 and 7 correspond to triple-transformants clones, lane 3 present any amplification, lane 8 indicates the negative control and lanes 1 and 9 contain Gene RulerTM 50 bp DNA ladder. ... 23
Figure 3.6PAGE analysis of T-RDR2 activity in vivo. TALEN target region of yeast triple-transformants were PCR amplified and evaluated on a 12% polyacrylamide gel: lane 8 corresponds the control for pTS_RDR2, lanes 2-7 correspond to triple-transformants clones, lane 9 indicates the negative control and lanes 1 and 10 contain Gene RulerTM 50 bp DNA ladder. ... 23
Figure 3.7 SSCP analysis to test T-DCL3 activity in vivo. TALEN target region of yeast triple-transformants were PCR amplified and evaluated by SSCP. Lane 7 corresponds to the control for pTS_DCL3 target site and, lanes1-5 indicate putative positive triple transformants clones, lane 6 corresponds to a negative clone, lane 8 corresponds to the negative control of the PCR reaction. ... 24
Figure 3.8 SSCP analysis to test T-RDR2 activity in vivo. TALEN target region of yeast triple-transformants were PCR amplified and evaluated by SSCP. Lane 8 corresponds to the control pTS_RDR2, lanes 2-5 indicate putative positive triple-transformants clones, lanes 1, 6 and 7 indicate negative clones, lane 8 indicates the negative control of the PCR reaction. ... 24
Figure 3.9Second SSCP analysis to confirm T-DCL3 activity. TALEN target region of E. coli transformants were PCR amplified and evaluated by SSCP. Lanes 1, 2 and 7 indicate putative
xii
Figure 3.10Second SSCP analysis to confirm T-RDR2 activity TALEN target region of E. coli transformants were PCR amplified and evaluated by SSCP. Lanes 1, 3,5 and 7 indicate putative
positive clones, lane 8 indicate the pTS_RDR2 amplification, lane 9 is the negative control of the PCR reaction. ... 25
Figure 3.11 Final constructs of T2-DCL3. (A) pZHY500-DCL3 constructsts were amplified by PCR and analysed in a 1% agarose gel: lanes 1 and 5 contain Gene RulerTM 1Kb DNA ladder, lanes 2 and 3 indicate positive clones, lane 4 correspond to the empty vector control (B) pZHY501-DCL3 constructs were amplified by PCR and analysed in a 1% agarose gel: lane 1 contains the Gene RulerTM 1Kb DNA ladder, lane 2 indicates positive clone, lane 3 corresponds to a negative clone, lane 4 indicates the empty vector control. ... 26
xiii
Table Contents
Table 3.1: M. truncatula Dicer-like proteins ... 17
Table 3.2: M. truncatula RNA-dependent polymerase family proteins ... 18
Table 3.3 Local homologies between DCL3 and other dicer proteins ... 18
Table 3.4 Local homologies between RDR2 and other RNA-dependent RNA polymerases ... 19
Table 3.5 SAPTA output data for TALEN targeting of DCL3... 19
Table 3.6 SAPTA output data for TALEN targeting RDR2 ... 20
Supplementary Table S1: Growth culture mediums for E.coli strains and S. cerevisiae strains ... 41
Supplementary Table S2: Primers sequences ... 42
Supplementary Table S3: Solutions and reagents ... 43
xiv
List of abreviations
AAD– Acidic activation domain; AGO – Argonaute;
CRISPR– Clustered regularly interspaced short palindromic repeats; DCL– Dicer-like;
DNA– Deoxyribonucleic acid; DSB– Double strand break; dsRNA– Double-strand RNA;
hc-siRNAs– heterochromatic siRNAs; HEN– Hua enhancer;
HMA – Heteroduplex mobility assay; HR– Homologous recombination; MTase– Methylase;
NHEJ – Non-homologous end joining; NLS – Nuclear localization signals;
PAGE– Polyacrylamide gel electrophoresis; PAM– Protospacer adjacent motif;
PCR– Polymerase chain reaction; Pol– Polymerase;
PTGS– Post-transcriptional gene silencing; RdDM– RNA directed DNA methylation; RDR – RNA-dependent RNA polymerase;
RFLP – Restriction fragment length polymorphism; RNA– Ribonucleic acid;
SAPTA– scoring algorithm for predicting TALE(N) activity; sgRNA– Single-guided RNA;
siRNAs– Small interfering RNAs;
SSCP– single-strand conformation polymorphism; ssRNA– Single-strand RNA;
TALE– Transcription activator-like effector;
TALEN– Transcription activator-like effector nuclease; TE– Transposable elements;
TGS– Transcriptional gene silencing; ZFN– Zinc-finger nuclease;
1
1
Introduction
1.1
Agriculture and water deficit
Crop quality and yield are tremendously affected by drastic changes in the environment, namely by extreme weather conditions, water deficit and nutrient depletion. To meet the increasing world food demand, strategies to minimize climate change impact on crop production need urgent research attention. Those strategies require the development of new approaches for agricultural biotechnology, such as targeted plant genome modification (Pennisi, 2010).
Among abiotic stresses, periodic drought is the primary limitation of plant growth and crop yield. This fact together with the rise of water demand caused by both the increase in world population and climate change, is on the basis of one of the biggest challenges of modern agriculture: to increase food and feed production, maintaining or diminishing water consumption (Zhang et al., 2014).
Farmers maximize crop yield by synchronizing plant development with rainy season, but yield increase under drought conditions can only be achieve by breeding and biotechnological advances (Marris, 2008). Strategies to improve plant drought resistance and promote sustainable use of water are therefore urgent and should integrate conventional breeding and novel biotechnological approaches (Chaves et al., 2003).
1.2
Medicago truncatula
as a model plant
Legumes are vital for sustainable agriculture, mainly because they carry out symbiotic nitrogen fixation. Food legumes of global importance include bean (Phaesolus vulgaris), soybean
(Glycine max) and pea (Pisum sativum). Alfafa (Medicago sativa) is the most important forage legume
species and one of the most valuable crops in the USA, yet it is not ideal for genetics or genomics research because of its large, tetraploid genome and out-crossing nature (Graham & Vance, 2003). Its close relative Medicago truncatula, however, is self-fertile, has a relatively small diploid genome
(2n=16) and is easy to transform, which makes it useful for both genetics and genomics studies (Trinh et al., 1998; Chabaud et al., 2003; Araújo et al., 2004). For these reasons, M. truncatula is considered a
model plant within the legume family (Cook, 1999; Young et al., 2005). M. truncatula is also regarded
as a drought-adapted species, as it occurs naturally in the arid and semi-arid environments of the Mediterranean (Nunes et al., 2008) and, as such it is concurrently an ideal experimental model to
study the molecular and biochemical mechanisms conferring drought resistance in plants (Zhang et al.,
2014).
2
reprogramming and metabolism modification (Yamaguchi-Shinozaki & Shinozaki, 2006; Talamè et al., 2007).
1.3
Epigenetic control of gene expression
Epigenetic modifications are mitotically and/or meiotically inheritable yet reversible changes in the DNA that affect gene expression. They do not involve changes in DNA sequence and are intimately associated with plant development (Steimer et al., 2004). Epigenetic modifications can be
propagated across generations and genes housing those modifications are the so-called epialleles (Paszkowski & Grossniklaus, 2011). Plants differing in just one epiallele can be phenotypically different. Therefore, the presence of epialleles in various loci in the genome greatly contributes to phenotypic variability in plants.
Many epigenetic changes require the recognition of particular DNA or RNA sequences (Figure 1.1). At the DNA level, recognition of those sequences within promoter regions can lead to transcriptional gene silencing (TGS), which is associated with DNA methylation and/or chromatin modifications. At the RNA level, epigenetic modifications induce post-transcriptional gene silencing (PTGS), either by promoting sequence specific RNA degradation or by inhibiting translation (Steimer
et al., 2004).
Figure 1.1Models for PTGS and TGS. In PTGS (left side of the figure), dsRNAs are cleaved into small RNAs
that pair with complementary mRNAs and mediate their degradation (indicated by the red cross). In TGS (right side of the figure), dsRNAs are cleaved into small RNAs that direct the methylation of corresponding DNA sequences (blackovals). This promoter methylation inhibits transcription, as indicated by the red cross. Adapted from Sijen et al., 2001.
Besides a prominent role in the regulation of gene expression during plant development (Zilberman et al., 2007), histone modifications and DNA methylation are also important for
maintaining genomic integrity (Lauria & Rossi, 2011).
Two of the four DNA bases, adenine and cytosine, may undergo modifications, but adenine modifications have been poorly investigated (Kumar et al., 2013). In plant nuclear genomes, cytosine
3
heavily methylated and loss of methylation are often associated with their transcriptional activation and mobilization (Chan et al., 2005). DNA methylation also occurs within gene coding regions (Zhang et al., 2006), but its significance remains a matter of debate (Humbeck, 2013).
In plants, DNA methylation patterns result from two mechanisms: maintenance or de novo
DNA methylation (Chan et al., 2005). Maintenance of methylation is the process by which
pre-existing methylation patterns are preserved after DNA replication (Zhang et al., 2010b). The de novo
methylation is a process in which cytosine residues are methylated, resulting in the formation of new methylation patterns. This process is also known as RNA-directed DNA methylation (RdDM) because putative sites for methylation are targeted via homology with small interfering RNAs (siRNAs) (Figure 1.2) (Matzke et al., 2009; Henderson & Jacobsen, 2007). RdDM is active in all tissues and cell
types in vegetative and reproductive phases of plants (Kumar et al., 2013).
siRNAs are non coding small RNAs (typically 24 nucleotides (nt)), arising from non-coding regions of the genome (TEs and other repetitive elements),and therefore called heterochromatic siRNAs (hc-siRNAs), by means of the RNA interference pathway (Zhang et al., 2007). Polymerase IV
(Pol IV) generates a single stranded RNA (ssRNA) transcript of the target region by using methylated DNA as template (Herr et al., 2005). Then, the RNA dependent RNA polymerase 2 (RDR2) interacts
with Pol IV and converts ssRNA into double-stranded RNA (dsRNA) (Xie et al., 2004; Lu et al.,
2006). Dicer-like 3 (DCL3) chops this dsRNA , originating 24 nt siRNAs (Xie et al., 2004; Henderson et al., 2006). siRNAs are stabilized by 3’-terminal ribose methylation mediated by the HUA enhancher
1 (HEN1) (Yu et al., 2005). Argonaute 4 (AGO4) or AGO 6 (Li et al., 2006) are then loaded with
mature siRNAs and direct cytosine methylation by recruiting the de novo DNA Methylase (MTase)
DRM2 (Matzke et al., 2009).
Figure 1.2 RdDM pathway. Transcription of non-coding regions (heterochromatic regions, repeat regions or
4
1.4
Epigenetic modulation of gene expression and stress response
Epigenetic changes are known to play a relevant role in plant stress response such as DNA damage, drought, high salinity and pathogen infection (Richards, 2011; Paszkowski & Grossniklaus, 2011). In fact, plants deficient in small RNA biogenesis exhibit impaired transgenerational response to stress (Boyko & Kovalchuk, 2010). DCL2, DCL3 and DCL4 proteins have some functional redundancy and are required for biogenesis of several classes of small RNAs (Boyko & Kovalchuk, 2010). In the Arabidopsisdcl3 mutant, dsRNAs arising from the RdDM pathway can be processed by
multiple DCLs, although preferentially processed by DCL3, in wild-type plants (Kasschau et al.,
2007). The analysis of the progeny of dcl2 and dcl3 mutant plants revealed the absence of significant
changes in DNA methylation in response to heat or UVC stress conditions as compared to the progeny of wild-type plants, possible due to the functional overlap between DCL proteins (Boyko & Kovalchuk, 2010). Recent observations in our laboratory further reinforce the relationship between epigenetic modification and stress response as it was shown that, in M. truncatula, DCL3 transcript
levels increase under water deficit conditions (Capitão et al., 2011).
In the RdDM pathway, RDR2 is upstream DCL3 (Figure 1.2). RDR2 seems to have a crucial role in this pathway, since knock-out RDR2 mutants do not produce heterochromatic siRNAs (Daxinger et al., 2009). This finding suggests that no other RDR proteins (RDR1 or RDR6) are able to
counteract the loss of RDR2, (Kasschau et al., 2007).
Interestingly, the analysis of small RNAs in the Arabidopsis rdr2 mutant has shown that the
small RNA population was highly enriched for other types of small RNAs (Lu et al., 2006), that were
not however able to compensate RDR2 loss, leading to the up-regulation of many DNA TEs, retrotransposons and genes (Jia et al., 2009).
The fully understand (and control) of the mechanisms that rule epigenetic regulation of gene expression under a context of stress conditions, such as drought, would surely open new possibilities for sustained improvement of crops.
1.5
Genome editing using nucleases
Targeted genome engineering has an enormous impact on academia, society and industry, as this approach enables researchers to modify genomic loci of interest in a very precise manner.
5
pathway inevitably impacts on the fidelity of the repair. Indeed, while HR is generally viewed as a conservative DSB repair pathway, NHEJ operates with poor fidelity and nucleotide deletions and/or insertions (indels) are frequently detected at repaired junctions (Decottignies, 2013).In plant species, DNA repair is typically effected by the NHEJ and not by HR pathway (Britt & May, 2003; Weinthal
et al., 2010).
Figure 1.3Models for NHEJ and HR mechanisms. (A) NHEJ mechanism. In step 1, DNA is damaged by an external agent, represented by the lightning symbol, and this result in a DSB (step2). In step 3, DNA is either removed by repair enzymes and religated resulting in a delection or DNA is inserted. (B) HR mechanism. In step 1 DNA is damaged by an external agent, represented by the lightning symbol, and this results in a DSB (step2). In step 3, damaged DNA binds to donor DNA at a point of homology and repair enzymes copy information from the donor DNA. Th break is repaired resulting in gene conversion in the chromossome as symbolized by the black box. Adapted from Wright et al., 2014.
The generation or targeted DSBs requires endonucleases with high fidelity of DNA recognition, in order to create site-specific cleavage. These enzymes must recognize a long DNA sequence with high specificity in order to avoid cytotoxic off-target DNA cleavage. In recent years, great efforts have been made to devise efficient and accessible genome editing nucleases, of which zing finger nucleases, transcription activator-like effector nucleases (TALENs), and the CRISPR/Cas9 system are good examples.
1.5.1 Zinc Finger Nucleases
Zinc finger nucleases (ZFNs) are artificial DNA nucleases constructed by fusing several zinc finger domains to the cleavage domain of the endonuclease FokI. FokI, a type IIS restriction enzyme (Pingoud et al., 2005), composed of two separate domains, an N-terminal DNA-binding domain and a
C-terminal DNA-cleavage domain (Li et al., 1992). FokI exists as an inactive monomer in solution
and becomes an active dimer upon binding to its target DNA. Therefore, two FokI molecules are involved in double-stranded DNA cleavage (Bitinaite et al., 1998). Custom-designed ZFN functions as
6
Figure 1.4DNA recognition by zinc-finger nucleases (ZFNs). Scheme of a ZFN dimer bound to a typical,
non-palindromic DNA target. Each ZFN consists of the cleavage domain of FokI fused to a zinc-finger domain protein (ZFP) that has been customized to specifically recognize either a left or right half-site (indicated by blue and red boxes), which are separated by a spacer of either 5 or 6 bp. Simultaneous binding by both ZFNs enables dimerization of the FokI nuclease domain and DNA cleavage. Adapted from Miller et al., 2007.
Because several zinc finger domains can tolerate mismatched DNA bases, off-target associated with ZFN usage has been reported (Gabriel et al., 2011; Pattanayak et al., 2012).
Recognition of non-specific sites by ZFNs (or by any other nuclease used in genome editing approaches) generate undesired genomic DSB and might lead to unexpected mutations and chromosomal aberrations (Pattanayak et al., 2012; Radecke et al., 2010). ZFN strict DNA binding
requirements greatly shortens the universe of genes that may be targeted (Ramirez et al., 2008).
Despite these limitations, which hinder their wider application, ZFNs have been used for targeted genome editing in various organism like Arabidopsis thaliana (Zhang et al., 2010a), Nicotiana tabacum (Townsend et al., 2009; Marton et al., 2010), Petunia hybrida (Marton et al., 2010), Glycine max (Curtin et al., 2011), Caenorhabditis elegans (Wood et al., 2012) and medaka (Chen et al., 2012).
1.5.2 Transcription activator-like effectors nucleases
TALENs have rapidly emerged as an alternative genome editing tool to ZFNs. Similar to ZFNs, TALENs use the non-specific FokI domain as the DNA cleavage module. In TALENs, however, this domain is fused with a TALE (Transcription activator-like effector) protein (Christian et al., 2010; Li et al., 2011).
TALEs are a class of DNA binding proteins produced by plant pathogenic bacteria,
Xanthomonas sp. The native function of these proteins is to directly modulate host gene expression to
allow pathogen survival therein (Bonas et al., 1989). Upon delivery into host cells via the bacterial
type III secretion system, TALEs enter the nucleus, bind specific sequences located within the host promoter regions and activate the transcription of the corresponding genes (Van Den Ackerveken et al., 1996). TALEs have in common an N-terminus required for type III secretion, a C-terminus
containing nuclear localization signals (NLS) (Van Den Ackerveken et al., 1996) and an acidic
activation domain (AAD) typical of transcription factors (Zhu et al., 1998).
7
truncated repeat of 20 amino acids. Each repeat is nearly identical except for two variable amino acid residues located at positions 12 and 13, called repeat variable di-residues (RVD) (Bonas et al., 1989).
The RVD specifies the target sequence: each RVD recognizes one different nucleotide, and each of the four DNA bases is recognized by different RVDs (Figure 1.5 (A)). The knowledge of this correspondence (the code RVD-base) enabled the prediction of TALE targets. TALENs target sites are always preceded by a thymine (T) that is required for TALE activity (Moscou & Bogdanove, 2009; Boch et al., 2009).
Figure 1.5 TAL effector and TALEN structure. (A) TALE structure. A consensus repeat sequence is shown with
the repeat-variable di-residue (RVD) underlined. The sequence of RVDs determines the target nucleotide sequence. (B) TALEN structure. Two TALENs are required to bind the target site to enable FokI to dimerize and cleave DNA. NLS, nuclear localization signal(s); AD, transcriptional activation domain. Adapted from Cermak et al., 2011.
As mentioned before, since FokI cleaves as a dimer, TALENs function in pairs (left and right TALEN). This pairs are arranged in an opposing orientation on opposite sides of doubled-strand DNA (Figure 1.5 (B)) with an optimal spacer sequence between them (usually of 15 – 30 nt) (Cermak et al.,
2011). When left and right TALENs bind to DNA, an active FokI domain is reconstituted and DNA is cleaved within the spacer, generating a DSB.
Unlike ZFNs, TALENs can be easily and rapidly constructed to target essentially any DNA sequence. In addition, TALENs exhibit significantly reduced off-target effects and cytotoxicity compared with ZFNs, making them an efficient genome editing tool (Mussolino et al., 2011). For this
reasons, TALEN mediated Genome Editing was listed as one of the ten breakthroughs of 2012 by the journal Science (Alberts, 2012).
TALENs usage in plants was first reported in rice (Li et al., 2012). Since then, TALEN
technology has been used in dicot species such as tobacco and Arabidopsis and in monocot species such as Brachypodium, barley and maize (Mahfouz et al., 2011; Christian et al., 2013; Shan et al.,
2013a; Wendt et al., 2013; Liang et al., 2014).
1.5.3 CRISPR/ Cas9 system
8
CRISPRs are loci encompassing several short repeats functioning as an adaptive microbial immune system, that prevents the cellular entry of unwanted virus and foreign DNA molecules (Barrangou et al., 2007). Several types of CRISPR-associated proteins (Cas) are encoded by cas genes
located in the vicinity of CRISPRs. Cas proteins are required for the multistep defense against intruder genetic element. Their number, identity, and the corresponding operon organization appear to be extremely variable (Makarova et al., 2011). The CRISPR system has three basic components, the Cas
endonuclease and two RNA molecules that guide Cas protein to the target sequence. By generating a single-guide RNA (sgRNA) that combines the function of the two RNA molecules in a chimeric molecule, CRISPR/Cas system became a useful tool for gene editing and silencing (Jinek et al., 2012).
The sgRNA is complementary to a specific region, called protospacer adjacent motif (PAM), that recruits Cas protein (Wiedenheft et al., 2012). The type II CRISPR/Cas system most widely used for
gene editing uses the monomeric enzyme Cas9 (Jinek et al., 2012; Cong et al., 2013) and has the
advantage of possessing a PAM recognition sequence of only two nucleotides in length (GG) (Jinek et al., 2012). This allows the generation of a numerous ‘guide’ RNAs for any particular gene due to GG
sequence abundance.
Figure 1.6CRISPR/Cas9 system. The system consists of a single-guided RNA which guides the Cas9 nuclease to
the genomic target site. Genomic target site has usually 20 base pairs (bp) of homology with the gRNA and a PAM sequence. Cleavage of both strands of target DNA occurs near the PAM. Adapted from Jinek et al., 2012.
Cas9 nuclease is functional as a transgene in most, if not all, cells in which it has been tested: rice (Shan, et al., 2013b; Mao et al., 2013; Xie & Yang, 2013), wheat (Shan, et al., 2013b), Arabidopsis
(Mao et al., 2013; Li et al., 2013) and tobacco (Li et al., 2013; Nekrasov et al., 2013).
The great advantage of genome editing using CRISPR/Cas system relies on its simplicity - cells need only to be transformed with one plasmid containing the Cas9 gene and a gene encoding a sgRNA (Jiang et al., 2013). Moreover this technology allows targeting of several genes at the same
9
1.6
Objectives
The current global socio-economic and environmental scenario places the development of novel strategies to increase food production, maintaining or diminishing water consumption, at forefront of modern agriculture research.
In this work we intend to set up the tools that in the future will certainly enable us to study the relationship between plant stress resistance and epigenetic regulation mediated by siRNAs in the legume plant model Medicago truncatula. To this end, we will focus on DCL3 and RDR2, enzymes of
the RdDm pathway. Growing evidence suggests the involvement of DCL3 in drought response (Capitão et al., 2011). As RDR2 is a component of the RdDm pathway upstream DCL3 (Xie et al.,
2004) that substantially impacts on hc-siRNAs formation, it would be also interesting to study its relevance on stress response.
The generation of rdr2 and dcl3 Medicago truncatula mutants, will allow the future
identification of epialleles related to drought resistance and may provide novel strategies to enhance legume productivity.
In this context, the main objectives of this work are to:
1) Design and construct TALENs targeting two crucial enzymes of the RdDM pathway - DCL3 and RDR2;
2) Test those TALENs effectiveness;
11
2
Materials and Methods
2.1
TALENs construction
2.1.1 Bioinformatic analysis
Medicago truncatula gene sequences were identified using John Craig Venter Institute (JCVI)
database for Medicago genome (v.4.0). Alignments were performed using DIALIGN (Morgenstern,
2004), a web tool available at http://bibiserv.techfak.uni-bielefeld.de/dialign/submission.html, using the following parameters: Sequence mode = DNA w/o translation; Threshold= 0; Regions max. sim.= 9. The software used to design TALENs is available online – SAPTA: Scoring Algorithm for
Predicting TALE(N) Activity
(http://baolab.bme.gatech.edu/Research/BioinformaticTools/TAL_targeter.html). DNA target sequences (RDR2 and DCL3) were then scanned for suitable TALEN binding sites based on TALEN design guidelines described by (Lin et al., 2014). The spacer length was set to 14-19 bp and TAL
arrays lengths were adjusted to 15-17. The SAPTA output data consists of a Table containing the sequence to be recognized by the left and right TALENs (target sites). TALEN pairs are ranking according a score (composite score) that estimates TALEN pair activity (high scores indicate higher activity). Since naturally occurring TAL effector recognition sites are preceded by a T, which is required for TAL effector activity, only TALEN recognition sites preceded by a T are included.
2.1.2 TALEN assembly via Golden Gate
TALEN repeat arrays recognizing the defined target sites (see above) were constructed using the Golden Gate kit (Addgene) according to the assembly method described by (Cermak et al., 2011)
TALENs were assembled in two sequential steps: (i) assembly of repeat modules into intermediary arrays of 1-10 repeats and (ii) cloning of the intermediary arrays into a backbone to make the final construct. TALENs were assembled following the Golden Gate Cloning strategy, a recently developed method of assembling multiple DNA fragments in an ordered fashion in a single reaction (Engler et al., 2008). The Golden Gate method uses Type IIS restriction endonucleases, which cleave outside
their recognition sites to create unique 4bp overhangs (sticky ends). Cloning is facilitated by digesting and ligating in the same reaction mixture because correct assembly eliminates the enzyme recognition site (Cermak et al., 2011).
2.1.2.1 Assembly of intermediate arrays
12
U/mL, New England Biolabs®) and 1x T4 DNA ligase buffer (New England Biolabs®). The reaction was incubated in a thermocycler for 10 cycles of 5 min at 37°C and 10 min at 16°C, then heated to 50°C for 5 min and to 80°C for 5 min. Then, 6.25 mM ATP (Epicentre ®) and 100 U of
Plasmid-Safe™ ATP-Dependent DNase (10 000 U/mL, Epicentre®) were added to the reaction. The mixture was incubated at 37°C for 1h. Treatment with Plasmid Safe DNase is crucial to prevent linear DNA fragments, including partial arrays, from recombining.
2.1.2.2 Transformation of Escherichia coli
The ligation mixture was used to transform Escherichia coli XL1 Blue competent cells.
Approximately 200 µL of chemically competent cells, prepared according to Inoue et al. 1990, were
mixed with 10 µL of Golden Gate mix reaction and kept on ice for 30 min. Then, the competent/DNA mixture was heated at 42°C in a water bath for 45 seconds and quickly chilled in ice for 2 minutes. After SOC medium (Supplementary Table S1) (800 µL) addition, the mixture was incubated in a 37°C oven, for 1 hour. Samples were centrifuged 5 minutes at 5000 rpm, ressuspended in 250 µL of SOC medium and then plated on LB Agar (Supplementary Table S1) containing 50µg/mL spectinomycin (Nzytech), 20 mg/mL X-gal (Nzytech) and 0,1 M IPTG (Nzytech) and incubated at 37°C overnight, to allow blue/white screening of recombinants.
2.1.2.3 Selection of positive clones
The selection of positive clones (white colonies) was performed by colony PCR. A small amount of colony mass was introduced, with the help of sterile toothpick, into a PCR tube, paced in a microwave for 5 minutes (900W) to break cell wall and immediately chilled on ice. Afterwards, 0.4 µM primer – pCR8_F1 and pCR8_R1 (Supplementary Table S2) – provided by Golden Gate TALEN kit (Addgene), 1.5 mM MgCl2 (Promega), 0.3 mM dNTPs (Nzytech), 1X GoTaq® reaction buffer (Promega), 0.6 U GoTaq® polymerase (Promega) and miliQ H2O (up to 20 µL). PCR reactions were carried out in a thermocycler using the following temperature parameters: 2 minutes at 98°C (1 cycle) followed by 35 cycles of 45 seconds at 95°C, 30 seconds at 55°C (annealing step) and 105 (pFUS_B) or 70 (pFUS_B) seconds at 72°C (extension step).
PCR products were loaded onto a 1% or 2% agarose (SeaKem®) gel (pFUS_A and pFUS_B reactions, respectively) stained with ethidium bromide (EtBr) (Sigma-Aldrich) (0.05µL/mL) and gel electrophoresis was carried out (5V per cm). DNA fragments were visualized using Gel Doc XR+ system (Biorad). Agarose was dissolved in TAE 1X (Supplementary Table S3).
After positive clone identification, cell cultures carrying those clones were grown overnight in LB liquid medium (Supplementary Table S1) supplemented with 50µg/mL spectinomycin (Sigma-Aldrich®). Plasmid DNA was extracted using ZR Plasmid Miniprep™ - Classic (Zimo Research),
13
results were analysed through a quick alignment tool available at http://baolab.bme.gatech.edu/Research/BioinformaticTools/assembleTALSequences.html, which allowed the confirmation of the correct position of RVDs in the array.
2.1.2.4 Assembly and selection of final arrays
Intermediary arrays (into pFUS_A and pFUS_B), along with a last repeat were cloned into the backbone plasmids pTAL3 (left TALEN) and pTAL4 (right TALEN), which contain the nuclease FokI domain (Cermak et al., 2011). Intermediary arrays were also cloned into pZHY500 (left TALEN)
and pZHY501 (right TALEN) backbones, which are truncated versions of pTAL3 and pTAL4 exhibiting a higher nuclease activity (Zhang et al., 2013). pZHY500 and pZHY501 were a kind gift of
Dr. Daniel Voytas. Reactions were prepared as follows: 150 ng each of pFUS_A and pFUS_B plasmids containing the intermediary repeat arrays, 75 ng of pTAL3 (or pTAL4, pZHY500, pZHY501), 150 ng of last repeat plasmid, 10 U of Esp3I (10000 U/mL, ThermoScientific), and 400 U of T4 DNA ligase (400 000 U/mL, New England Biolabs®) in 1X T4 DNA ligase buffer (New England Biolabs®). Reactions were placed in thermocycler as in section 2.1.2.1. Plasmid Safe DNase treatment was omitted at this stage. The ligation mixture was used to transform E.coli as described in
section 2.1.2.2, cultures were plated in ampicillin (100µg/mL) LB Agar plates (Supplementary Table S1) for selection of the transformants.
Several colonies were next chosen for plasmid DNA extraction. Plasmid DNA was extracted using ZR Plasmid Miniprep™ - Classic (Zimo Research), according to manufacturer’s instructions. Selection of positive clones was performed by PCR. Correct constructs were expected to have around 2kb in length. A 20 µL PCR reaction was prepared by mixing: 0.4 µM primer – TAL_F1 and TAL_R2 (Supplementary Table S2) – provided with Golden Gate TALEN kit (Addgene), 1.5 mM MgCl2 (Promega), 0.3 mM dNTPs (Nzytech), 1X GoTaq® reaction buffer (Promega), 0.6 U GoTaq® polymerase (Promega) and miliQ H2O (up to 20µL). The reaction mixture was placed for 2 minutes at 98°C and then subjected to 35 cycles of: 45 seconds at 95°C, 30 seconds at 55°C and 3 minutes at 72°C. The fragments amplified were then analysed by gel electrophoresis using a 1% agarose (SeaKem®) gel, prepared as described above (section 2.1.2.3). Putative positive clones were next confirmed by sequencing using 10 µM SeqTALEN 5-1 and 10 µM TAL_R2 primers (Supplementary Table S2) provided by Golden Gate TALEN Kit. Sequencing results were analysed as described in section 2.1.2.3.
2.2
TALEN’s functionality: Yeast based
-assay
2.2.1 Medicago truncatula DNA extraction
DNA was extracted from the leaves of M9-10a line of M. truncatula Gaertn cv. Jemalong
14
somatic embryos through a regeneration process described previously (Araújo et al., 2004; Santos &
Fevereiro, 2002). Plants were gown in vitro under the following regimes: 16h of light/8h of dark in growth cabinets maintained at 24 °C during the day and at 22°during the night with 50 % to 60 % humidity and a light intensity of 100 µmol m-2s-1. Leaf DNA extraction was performed according to Santos & Fevereiro 2002.
2.2.2 Constructs
The left TALEN of DCL3 and RDR2 were cloned into both pTAL3 and pZHY500, two Golden Gate compatible yeast expression vectors, containing HIS3 as a (yeast) selectable marker. The
right TALENs were cloned into pTAL4 and pZHY501, also two compatible yeast expression vectors, containing LEU2 as a selectable marker. TALEN target sites for DCL3 or RDR2 were cloned into
pRS416 (Sikorski & Hieter, 1989), a yeast vector containing URA3 as a selectable marker. TALENs
targets sites were amplified by PCR using as a template M. truncatula genomic DNA, previously
digest with a rare cut restriction enzyme, and using the polymerase Phusion®, a proofreading enzyme, that originates blunt-ends fragments.
Each PCR reaction contained 50ng of digested DNA template, 0.6 µM of primer (DCL3_Fwd and DCL3_Rev or RDR2_Fwd and RDR2_Rev) (Supplementary Table S2) (StabVida), 0.3 mM dNTPs (Nzytech), 1X Phusion ® CG buffer, 0.4 U of Phusion® polymerase (New England Biolabs) and miliQ H2O (up to 20 ul). The reaction mixture was placed in a thermocycler and subjected to the following temperature cycling parameters: 1 cycle at 98°C for 2 minutes and 35 cycles at 95°C for 45 seconds, 58°C for 30 seconds and at 72°C for 15 seconds. Amplified fragments were electrophoretically separated in a 2% agarose gel (SeaKem®) and recovered using Zymoclean™ Gel DNA Recovery Kit (Zymo Research) according to manufacturer’s instructions. Purified fragments
were cloned into pRS416 previously digested with SmaI (1U/µL) (Fermentas). The ligation step was performed overnight at 16ºC in a 20 µL reaction volume using 5 ng of pRS416, 100 ng of insert (DCL3 target or RDR2 target), 400 U of T4 DNA ligase (400 000 U/mL, New England Biolabs®) and 1X T4 DNA ligase buffer (New England Biolabs®).
2.2.3 Yeast competent cells
15 2.2.4 Yeast cells triple transformation
A volume of 50 µL of yeast competent cells was mixed with 1 mg/mL salmon sperm denature DNA (Sigma-Aldrich), 300 ng of plasmid DNA (pTAL3 (or PZHY500), pTAL4 (or PZHY501), pRS416 with DCL3 target and pRS416 with RDR2 target) and 300µL of transformation solution (Supplementary Table S3) were added. Cells were incubated at 30°C, for 30 minutes, 200 rpm and next heat-shocked at 42°C for 15 minutes. After addition of 800µL of sterile water, cells were centrifuged at 5000 rpm for 1 minute and plated onto selective agar plates (Synthetic drop out (SD) agar medium (Supplementary Table S1) supplemented with histidine (0.2mL/L) (Sigma-Aldrich) and leucine (0.2mL/L) (Sigma-Aldrich)). Growth was recorded after 3 days at 30ºC.
The above transformed yeast cells were made competent for transformation according to the above described protocol (section 2.2.3). SD medium supplemented with histidine and leucine was used instead of YPD. Competent cells were double transformed with the left and right TALENs and plated in SD plates without histidine, uracil and leucine.
2.2.5 Polyacrylamide gel electrophoresis (PAGE) analysis
Colony PCR of the transformed yeast cells was performed as described in section 2.1.2.3 using the primers (DCL3_Fwd, DCL3_Rev, RDR2_Fwd and RDR2_Rev) listed in Supplementary Table S2 and an extension time of 30 seconds. This PCR was followed by a second (nested) PCR using primers (DCL3In_Fwd, DCL3In_Rev, RDR2In_Fwd and RDR2In_Rev) listed in Supplementary Table S2 and an extension step of 15 seconds. The final fragments had an expected size of 60 bp.
Two types of polyacrylamide gels were assembled: 12% polyacrylamide gel with Acrylamide (Fluka)/Bisacrylamide (Sigma-Aldrich) ratio of 19:1 according to Biorad instructions; and a 20% polyacrylamide gel with Acrylamide/bisacrylamide (Roth) ratio of 29:1 according to Roth instructions. These types of gels have a separation range between 20-150 bp and 6-100 bp, respectively. PCR products (10 µL) were loaded onto polyacrylamide gels that run at 100 V during 3 hours in TBE 0.5x (Supplementary Table S3). DNA staining was performed by soaking gels into a TBE solution containing EtBr (Sigma-Aldrich) (0.1µL/mL). DNA fragments were visualized using Gel Doc XR+ system (Biorad).
2.2.6 Single Strand Conformation Polymorphisms (SSCP) analysis
Nested PCR products (12 µL) were mixed with 36 µL of formamide dye (Supplementary Table S3) and denatured at 95°C for 10 minutes. After denaturation, samples were immediately kept in -20°C deep freeze for 10 minutes.
16
was performed at 100V for 2 hours. After electrophoresis, gel was stained with silver as described by Byun et al. 2009 to visualize band patterns.
Briefly, after electrophoresis, SSCP gels are fixed and stained in a stain solution for 20 min, then, the gels are rinsed with distilled water once and are developed with a develop solution (Supplementary Table S3) until dark staining bands appear on the yellow background of the SSCP gels (varies between 5 and 10 min). Development is then stopped with a stop solution for 1 minute.
Putative positive clones (PCR products exhibiting a different gel migration pattern) were sequenced using M13 Forward primer (Supplementary Table S2) to detect possible indel mutations. Sequences were compared using Blast2Seq, a web tool available at http://blast.ncbi.nlm.nih.gov/Blast.cgi, to detect differences in the sequence comprising the spacer region of each TALEN target.
2.3
CRISPR-Cas9 system target sites identification
Sequences from DCL3 and RDR2 genes were analysed by means of CHOPCHOP (Montague
et al., 2014), an online tool (https://chopchop.rc.fas.harvard.edu/) that designs potential CRISPRs
target sequences. This tool efficiently predicts off-target binding of single-guide RNAs in several species, including plants, but not in M. truncatula (genome not available in CHOPCHOP). As such, to
avoid the possibility of off-target effects CRISPR sequences designed by CHOPCHOP were blasted against the M. truncatula genome using http://blast.ncbi.nlm.nih.gov/Blast.cgi and checked in
17
3
Results
3.1
Design of DCL3 and RDR2 TALENs
3.1.1 Identifying the region to be targeted
In endonuclease-based genome editing approaches, recognition of non-specific sites is often a problem, which lead to undesired genomic DNA breaks that might result in mutations and chromosomal aberrations (Pattanayak et al., 2012). As such, the precise identification of the DNA
sequence to be targeted is one the most important steps when constructing TALENs.
The genome of Medicago truncatula is being sequenced and genomic data is available for the
whole scientific community at John Craig Venter Institute (JCVI) homepage (Version 4.0 - http://www.jcvi.org/medicago/).
We started by searching the genome of M. truncatula for sequences annotated as ‘dicer’. This
search retrieved 10 possible dicer-sequences within M. truncatula genome (Table 3.1). Dicer-like 3
(MtDCL3) appeared associated with the Locus ID Medtr3g105390. Likewise, sequences annotated as
‘RNA dependent RNA polymerase’ were searched within M. truncatula genome, which resulted in
seven RNA-dependent RNA polymerase family proteins (Table 3.2). RNA-dependent RNA polymerase 2 (MtRDR2) appeared associated with the locus ID Medtr4g106660.
Table 3.1: M. truncatula Dicer-like proteins
n.a. not assigned
Locus ID Product name A. thaliana Ortholog
Medtr7g118350 endoribonuclease dicer-like protein dicer-like 1 Medtr2g030490 endoribonuclease dicer-like protein dicer-like 2 Medtr3g105390 endoribonuclease dicer-like protein dicer-like 3 Medtr4g116860 endoribonuclease dicer-like protein dicer-like 4
Medtr1g063400 dicer-like protein, putative n.a.
Medtr1g063410 endoribonuclease dicer-like protein n.a Medtr8g077780 endoribonuclease dicer-like protein n.a Medtr1g060740 endoribonuclease dicer-like protein n.a Medtr8g069975 endoribonuclease dicer-like protein n.a
18
Table 3.2: M. truncatula RNA-dependent polymerase family proteins
Locus ID Product name A.thaliana Ortholog
Medtr4g106660 RNA-dependent RNA polymerase family protein RNA-dependent RNA polymerase 2
Medtr3g107390 RNA-dependent RNA polymerase family protein RNA-dependent RNA polymerase 6
Medtr8g064670 RNA-dependent RNA polymerase family protein n.a. Medtr6g088660 RNA-dependent RNA polymerase family protein n.a. Medtr2g059620 RNA-dependent RNA polymerase family protein n.a. Medtr1g032710 RNA-dependent RNA polymerase family protein n.a. Medtr0212s0050 mitovirus RNA-dependent RNA polymerase n.a. n.a. not assigned
We next, aligned MtDCL3 and MtRDR2, hereafter designated as DCL3 and RDR2, respectively, with each of the retrieved sequences (Tables 3.1 and 3.2) using DIALIGN (Morgenstern, 2004). DIALIGN is a software tool that combines local and global alignment features without gap penalties and is far more versatile than traditional alignment approaches. After DIALIGN analysis, the first 500 bp of DCL3 and RDR2 genes (corresponding to the first exon of the genes) emerged as the suitable regions for TALENs targeting. In fact, these regions exhibit low similarity with other Dicer-like or RDR-Dicer-like genes present in Medicago genome (alignment not shown). Small stretches of
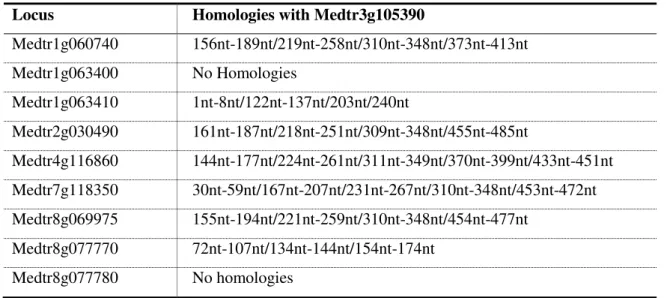
sequence homology, however, were found within these 500 bp regions (Tables 3.3 and 3.4). These sequences were therefore taken into account for TALENs design.
Table 3.3 Local homologies between DCL3 and other dicer proteins
Locus Homologies with Medtr3g105390
Medtr1g060740 156nt-189nt/219nt-258nt/310nt-348nt/373nt-413nt Medtr1g063400 No Homologies
Medtr1g063410 1nt-8nt/122nt-137nt/203nt/240nt
Medtr2g030490 161nt-187nt/218nt-251nt/309nt-348nt/455nt-485nt
Medtr4g116860 144nt-177nt/224nt-261nt/311nt-349nt/370nt-399nt/433nt-451nt Medtr7g118350 30nt-59nt/167nt-207nt/231nt-267nt/310nt-348nt/453nt-472nt Medtr8g069975 155nt-194nt/221nt-259nt/310nt-348nt/454nt-477nt
19
Table 3.4 Local homologies between RDR2 and other RNA-dependent RNA polymerases
Locus Homologies with Medtr4g106660
Medtr0212s0050 10nt-29nt/148nt-160nt
Medtr1g032710 No Homologies
Medtr2g059620 93nt-132nt/175nt-184nt
Medtr3g107390 No Homologies
Medtr6g088660 27nt-66nt/235nt-259nt
Medtr8g064670 397nt-419nt
3.1.2 Choosing the best TALENs
The 500 bp region of DCL3 and RDR2 were next screened for possible TALEN target sites, using the design tool SAPTA (Lin et al., 2014), available online. The output of this analysis consists
of a scored list of target sequences, with high scores indicating higher TALEN activity (Table 3.5 for DCL3 and Table 3.6 for RDR2). For DCL3, the four best-scored TALENs were excluded due to homologies with the above referred sequence stretches (Table 3.3). The TALEN pair positioned in the ranking position 5 was then chosen for further analysis. This TALEN was hereafter designated as T-DCL3 (Table 3.5).
Table 3.5 SAPTA output data for TALEN targeting of DCL3
Left TALEN Right TALEN Spacer
Size
Composite Score Binding sequence Size Binding sequence Size
T-CCCACTGTTCACCTTGT 17 T-CTGTATTCAGCTTTAT 16 19 49.01
T-TCTCCAGCTCAGGAAG 16 T-CCCTTCTAGGAACCAAG 17 16 40.37
T-CAGGAAGAAACCCTCAT 17 T-CCAACTGATCCCTTCT 16 16 39.37
T-CCAGCTCAGGAAGAA 15 T-CCCTTCTAGGAACCAAG 17 14 39.02
T-GTATGCAAAACCCAA 15 T-CTTCCTGAGCTGGAG 15 14 38.72
20
Table 3.6 SAPTA output data for TALEN targeting RDR2
Left TALEN Right TALEN Spacer
Size
Composite
Score Binding sequence Size Binding sequence Size
T-TTCCCATCGGTCCTGAT 17 T-CGAACACCTTCCCATGA 17 18 41.75
T-TCGAGACATTGGAAGCT 17 T-CTTGTTCTCGGCGAGAG 17 16 35.76
T-ATGCTGGTTTTCCCAT 16 T-CCCATGATTGAAGCACG 17 18 34.82
3.1.3 T-DCL3 and T-RDR2 construction
The Golden Gate method was used for TALENs construction. With this method TALENs are assembled in two steps. In an initial step, the first 10 RVDs are cloned in the correct order into the vector pFUS_A and the remaining RVDS are cloned in the corresponding pFUS_B vector. In a second step both inserts (intermediate arrays) of pFUS plasmids are joined and cloned into the final vector backbone. The RVD order within T-DCL3 and T-RDR2 was established according to the retrieved TALEN binding sequences (Tables 3.5 and 3.6) and the known RVD-base correspondence (Supplementary Table S4).
At the end of the first step, positive clones were evaluated by PCR amplification using vector primers, followed by electrophoresis in 1% (pFUS_A) or 2% (pFUS_B) agarose gels. The expected size for correct clones was 1.2 Kb (pFUS_A, DCL3 and RDR2), 700 bp (pFUS_B5 DCL3) and 900 bp (pFUS_B6, RDR2).
PCR amplification of T-DCL3 intermediate clones is shown in Figure 3.1. In panel A, lanes 2 and 5 indicate positive clones for pFUS_A constructs. The smearing effect indicates a positive clone – the 1.2 kb expected fragment is almost undetectable. Lanes 3 and 6 correspond to empty vector clones since they have the same fragment size of the pFUS_A control lane (nr10). Lanes 4, 7, 8, and 9 are negative pFUS_A clones, which probably correspond to clones with one or two RVDs. Positive pFUS_B clones are shown in panel B in lanes 2-4.
Figure 3.1 Intermediate constructs of T-DCL3. (A) pFUS_A clones were amplified by PCR and analysed in a
21
(lanes 1 and 12). (B) pFUS_B clones were amplified by PCR and analysed in a 2% agarose gel. Lanes 2, 3 and 4 indicate positive constructs, lane 5 corresponds to a negative clone, lane 6 is the control for pFUS_B5 vector alone and lane 7 is the negative control. Lanes 1 and 8 contain Gene RulerTM 1Kb DNA ladder.
The results of PCR amplification of T-RDR2 intermediate clones are presented in Figure 3.2. In panel A, lane 6, 9 and 12 indicate positive clones for pFUS_A intermediate constructs. Positive pFUS_B clones are shown in panel B: in lanes 5, 8 and 9, appear the ‘ladder effect’ and bands with
around 900bp. Selected clones were further confirmed by sequencing.
Figure 3.2 Intermediate constructs of T-RDR2. (A) pFUS_A clones were amplified by PCR and analysed in a
1% agarose gel: lanes 6, 9 and 12 correspond to positive clones (lane 6 is the left array and lanes 9 and 12 are the right array), lanes 2-5, 7, 8, 10 and 11 indicate negative clones, lane 13 is the control for pFUS_A vector alone (empty vector) and lane 14 is the negative control. The ladder Gene RulerTM 1Kb DNA was used to indicate fragments size (lane 1 and 15). (B)
pFUS_B6 clones were amplified by PCR and analysed in a 2% agarose gel. Lanes 5, 8 and 9 indicate positive constructs (lane 5 is the left array and lanes 8 and 9 are the right arrays), lanes 2, 4, 6 and 7 correspond to a negative clones, , lanes 3, 11, 12 indicate empty vectors lane 13 correspond to the control for pFUS_B6 vector and lane 14 is the negative control. Lanes 1 and 15 contain Gene RulerTM 1Kb DNA ladder.
Intermediate arrays were then assembled into the backbone plasmids: pTAL 3 (left TALEN) and pTAL4 (right TALEN). Final constructs (pTAL3-DCL3 and pTAL4-DCL3; pTAL3-RDR2 and pTAL4-RDR2) were evaluated by PCR followed by agarose gel electrophoresis (Figure 3.3 and 3.4). As mentioned above, a smear or ladder effect indicates positive clones. All the tested clones were positive and were further confirmed by sequencing.
Figure 3.3 Final constructs for T-DCL3. pTAL3-DCL3 and pTAL4-DCL3 clones were amplified by PCR and
analysed in a 1% agarose gel: lanes 2 – 6 correspond to positive clones (lanes 2, 3 and 4 indicate pTAL3-DCL3 and lane 5 and 6 indicate pTAL4-DCL3), lane 7 corresponds to the amplification of pTAL empty vector. The ladder Gene RulerTM 1Kb