Combined effects of potassium and wastewater
application on the yield and quality of bermuda
grass (Cynodon dactylon) in the Mediterranean
regions
ARTICLE in WSEAS TRANSACTIONS ON ENVIRONMENT AND DEVELOPMENT · JANUARY 2008 CITATION1
READS15
3 AUTHORS, INCLUDING: J. Beltrão Universidade do Algarve 147 PUBLICATIONS 230 CITATIONS SEE PROFILE Pedro José Correia Universidade do Algarve 46 PUBLICATIONS 280 CITATIONS SEE PROFILECombined effects of potassium and wastewater application on the yield and quality
of Bermuda grass (Cynodon dactylon) in the Mediterranean regions
JOSÉ BELTRÃO, RUI SANTOS; PEDRO JOSE CORREIA
CDCTPV-Faculty of Engineering of Natural Resources (FERN)
University of Algarve
Campus de Gambelas, 8000-139 Faro
PORTUGAL
[email protected]
Abstract: The reuse of treated wastewater is considered as an alternative disposable to potable water in the mediterranean agriculture and landscape, namely in golf courses. Bermuda grass (Cynodon dactylon, Peers) is used very often on the fairways, roughs and tees of golf courses of the Mediterranean Basin due to its tolerance to drought, salinity, high temperatures and damages. The objective of this work is to study the response of this cultivar to the combined effects of municipal wastewater and two levels of potassium fertilization, during Spring and Summer. The experimental design known as sprinkle point source was used to simulate the various levels of wastewater application, expressed by the crop coefficient kc. This procedure is characterized by the assumption that a point creates a linear irrigation gradient from the water point source, producing a gradual change in water application, and a high degree of irrigation uniformity must be obtained in parallel isohyets.
Chemical analysis of wastewater irrigation water was monitored through all the experimental period (from April to September). Climatic data was also recorded. Yield (aboveground biomass) and the good visual appearance (GVA) of the lawn were assessed in two sampling dates, May and July. Municipal wastewater can be used to irrigate Bermuda grass, without an apparent decrease on grass quality. As concluding remarks, it may be seen that the irrigation water amount is the most pronounced limiting production factor of bermuda grass (Cynodon dactilon, Peers), when compared with potassium fertilization, but it is possible that there is a positive interaction between water and irrigation. This response is modulated by evaporative air conditions since lower yields were obtained in summer. On the other hand, if the potassium fertilization is increased, two situations may occur: 1) with high amounts of water application, leaching problems may occur, mainly on sandy soils, and production may decrease; 2) if potassium fertilization increases, and irrigation water decreases, yield decreases due to the increase of salinity (potassium fertilizers are salts), mainly on salt affected soils.
Key-Words: GVA – good visual appearance, kc – crop coefficient, salination, leaching, point source.
1 Introduction
The increased population and the expansion of urbanism create competition on the limited water [1, 2]. In arid and semi-arid regions, such as the Mediterranean regions, supplies of good quality water allocated to agriculture are expected to decrease because most of available fresh / potable water resources have been already mobilized [3, 4]. The factors driving the development of Mediterranean regions will be tourism because of their beaches and mild and sunny climate. Due to these factors, the number of golf courses is increasing very strongly. These aspects cause nowadays
important problems, as follows: shortage of fresh water and amenity (gardens and golf courses) and soil and underground water contamination from excess fertiliser application. Current technologies that Mediterranean countries are applying to solve these problems include: reducing fresh water used in irrigation and fertilizers application, and at the same time, exploiting alternative water resources such as the reuse of the municipal treated wastewater.
The reuse of treated wastewater is considered as an alternative disposable to potable water in the mediterranean agriculture and landscape [5], namely in golf courses [6, 7]. Another very important growth
and quality crop factor is nutrient content [8]. The intense use of effluent for sprinkle irrigation attracted public awareness of environmental pollution and the impact of water quality [9]. Secondary and tertiary effluent reuse is subject to various environmental and health criteria which are being defined for each region [10]. The effluent applied under sprinkle irrigation exposed to solar radiation may intensify dieway of the contamination pathogens [11].
Hence, the effluent disposal solves, simultaneously, environmental contamination problem [12], and is beneficial for agricultural use due to increase of plant productivity, reduction the irrigation needed, potential reduction in waste treatment cost, and saving of fertilisers [13, 14]. In order to avoid soil contamination it is imperative that fertilizers should be judiciously used. These rules are normally applied to nitrogen, but other elements should also be considered with care.
Transpiration and assimilation are linked together, because water vapor and CO2 pass through the same stomatal pores [15]. Under soil water stress conditions, stomatal conductance decreases, and consequently, transpiration and CO2 fixation are reduced. Water deficit can cause a direct effect on stomatal aperture, by their effect on relative and absolute turgor levels in the guard cells; as the water deficit spreads through the leaf, turgor loss, in both guard cells and adjacent cells, leads to progressive stomatal closure [16]. In additional to these theoretical considerations, observations have shown a good correlation between net photosynthesis, transpiration and plant water stress indexes [17, 18]. This empirical correlation is used to establish the relationship between plant production and transpiration [19]. However, there are many other factors affecting yield, such as the nutritional and salinity environment of the root zone of turfgrasses. Nitrogen is the most important nutrient required by the grasses; potassium is the second one [20]. Several studies on the response of grass to the combined effects of treated wastewater and nitrogen application were already done [21]. Scarcity of nitrogen may produce chlorosis on the leaves, decreasing the area of green leaves, and, therefore, the photosynthetic rate and its effect on biomass accumulation. This work presents some findings related to the Bermuda grass (Cynodon dactylon, Peers) response, at different yields and quality levels, to the combined effects of treated wastewater and potassium application.
Potassium is an essential element and is one of the most important element with respect to its physiological functions. It is taken up very efficiently and translocated throughout the plant. One of the most important features of potassium is its role on the translocation of photosynthates and the promoting effect on phloem loading. Potassium its highly mobile in plants and long-distance transport occurs in xylem and phloem. It is known the influence of potassium on the quality and growth of Bermuda grass [22], once that is directed related to the stomatal physiological mechanisms, to the synthesis of the carbohydrates [23], on the development of the root system [24], and on the special case of Bermuda grass, its influence on the week resistance to low temperature [25]. Soils of golf courses require frequent applications of potassium, once that potassium fertilizers are generally susceptible to leaching, mainly in sandy soils [26]. The use of enhanced potassic plant nutrition is an efficient method on regulating sodium induced stress in many crops, and, additionally, its use is a potent tool precluding chloride-induced stress in many crops [27]; these aspects were demonstrated through several physiological mechanisms [28]. In sharp contrast to agriculture, where plant quality and yield are of major importance, ornamental horticulture is concerned exclusively with the creation of an environment aesthetically suitable for recreation or relaxation; the value of turfgrass depends on its color, density and general appearance rather than its yield [29]. In this study the quality (appearance) of the lawn was compared with the observation of the color of the turfgrass, this quality depends upon the interaction of the above mentioned factors, as soil water and fertilization.
2 Material and methods
It was selected to this study the bermuda grass (Cynodon dactilon, L. Pers), the most used species in the fairways of the Mediterranean golf courses. It is a warm-season species, adapted to a wide range of soil conditions; although Bermuda grass generally not very cold tolerant, the poleward limits of adaptation have been extended with the development of several new cultivars; its intolerance of shade necessitates the use of alternative warm-season species on sites where trees and other structures restrict sunlight penetration [30]. These species are perennial, have a long life, quick growth at 18-35 ºC, but become
brown when temperature decreases. Its growth is extremely vigorous, when compared to other species [31].
The experiments were conducted in the Salgados golf course, Algarve, Southern Portugal, during Spring and Summer.
The climate of Algarve can be considered as Mediterranean and in particular the south shore, after Köppen, is classified as Csa, with semi-arid characteristics, identified by mild rainy winters and by warm and dry summers. Snow and frost are not expected. The annual value for reference evapotranspiration ETo (Penman method) is around 1300 mm and precipitation is around 500 mm. Table 1 shows the most important climatic parameters - temperature, Penman-Monteith potential evapotranspiration ETP and precipitation of the coastal area of Algarve, where the study was carried out. It may be seen that there was no rain during April, July and August, and only 17 mm in May; monthly reference evapotranspiration ETo (Penman method) was, respectively, 165 mm in May and 208 mm in July.
The soil is an alluvial saline soil. It is classified as a “Fluviosol-thionic”, according to the soil classification “World Reference Base for Soil Resources” [32]. The soil profile is described as: Horizon A – thin soil (0.00-0.20 m depth) - texture: sandy soil (sand – 96 %; silt – 1 %; and clay – 3 %), pH (water) = 8.5; colour (dry) = and (wet) =; bulk density - 1.88 g cm-3); gravimetric soil water content at different soil matric potential ψm values were, respectively: θw at - 10 kPa = - 0.050 kg water kg-1 dry soil, θw at – 330kPa = 0.040 kg kg-1; and θw at - 1500 kPa = 0.018 kg kg-1.
Horizon B – (0.20 – 0.60 m depth) - texture: loam-clay sandy soil (sand – 66 %; silt – 3 %; and loam-clay – 22 %); gravimetric soil water content.at different soil matric potential ψm values were, respectively: θw at - 100 kPa = - 0.080 kg kg-1; θ
w at – 330 kPa = 0.070 kg kg-1; θ
w and at - 1500 kPa = 0.050 kg kg-1.
Horizon C – (depth > 0.60 m) texture: clay soil, Cat-clay soil known as thyosol (rich in Sulfur), very low hydraulic conductivity.
Table 1. Monthly climatic parameters of the experimental site. . MONTH TEMPERATURE (º C) ETP (mm) RAIN (mm) January 12 33 57 February 13 40 8 March 15 80 97 April 16 117 0 May 17 165 17 June 20 184 1 July 22 208 0 August 22 184 0 September 20 119 99 October 18 85 9 November 15 36 36 December 13 24 158 YEAR 17 1275 482
The reclamation plant serves several urban housing. Raw wastewater flows through a comminutor and screens where the course solids are grind up. Afterwards, it flows to a biological disk tank provide with a sprinkler. Then, it flows to sedimentation tank where solid phase is separated from the effluent. After a sand filtration, the effluent is discharged to lagoons, and finally applied on the irrigation of the golf course.
The different chemical parameters of the treated wastewater are shown in Table 2.
Table 2 – Main Chemical parameters of irrigation water. Irrigation water parameters Values pH 7,4* - 8.1** ECw (dS m-1) 1,54* - 1.65** SAR 5,6 CO3--(ppm) 0,0 HCO3- (ppm) 469,8 Na+ (ppm) 197,8 K+ (ppm) 12* - 14** Mg++ (ppm) 42,3 Ca++ (ppm) 69,7 Cl- (ppm) 243* - 258** NO3- (ppm) 1.2 NO2-- (ppm) 0.6* - 0.7** P(ppm) 7* - 9**
*May; ** July
Main chemical parameters were determined by a reflectometry (Merck RQ – Flex Plus), according to the different manufacturer instructions, specific to each ion. The pH and the electrical conductivity of wastewater were determined by a portable potenciometer and a conductivimeter, respectively. Tt was applied ammonium nitrate at a rate of 25 kg ha-1 month-1.
Other chemical parameters of irrigation water are given in table 3. It may be seen that, in general, the concentration of all these parameters are not high; exception made to the boron, which is slightly higher [33]
Table 3 – Other chemical parameters of the irrigation water [34].
Parameter Unit Value
Aluminum ppm 3.9 Arsenium ppm <0.05 Barium ppm 0.006 Berilium ppm <0.002 Boron ppm 0.44 Cadmium ppm <0.001 Lead ppm <0.005 Cobalt ppm <0.005 Copper ppm <0.01 Chromium ppm <0.03 Iron ppm 0.017 Manganese ppm <0.02 Nickel ppm <0.005 Selenium ppm <0.01 Sulphate (SO4-) ppm 77 Vanadium ppm <0.01 Zinc ppm 0.2 Fluoride ppm <0.1 Molybden ppm <0.01 CQO mg O2 L-1 57
It was used an experimental design known as sprinkle point source shown in Fig. 1 [35], which is characterized by the assumption that a point creates a
linear irrigation gradient from the water point source, producing a gradual change in water application, and a high degree of irrigation uniformity must be obtained in parallel isohyets.
The wettest zone was near the sprinkler and the treatments near the borders were the driest. The irrigation system was stopped when wind speed was larger than 1 m s-1. It was used a 323/90 Naan sprinkler, 2.4 x 4.8 mm diameter nozzles, using a 250 kPa sprinkler pressure, with a wetting radius around 10 m. Christiansen uniformity coefficient CUC [36] was used to determine the uniformity of water distribution as follows:
CUC = 100 {1 – [ ( Σ | xi – m | ) / (m . n ) ] } [1] where:
CUC – Christiansen’s uniformity coefficient, percent;
n - number of collecting cans in the overlapped isohyets;
xi - water measurements in the i-th collecting can (i = 1, 2,…, n);
m - mean of n measurements in the overlapped isohyets;
The uniformity of water distribution was determined at 2; 4; 6; and 8 m from the sprinkle point source; it was obtained, respectively, CUC's values of 94.5; 92.7; 91.9; and 80.0%. According to the pluviometric diagram, it was used a crop coefficient value kc = 1.6, 1.2, 0.9, 0.5, and 0.1, at, respectively, 2, 4, 6, 8, 10 m from the sprinkler source. The plot was irrigated once a day. Daily reference evapotranspiration ET0 was determined according to the Penman method, being crop evapotranspiration computed according to FAO methods [37, 38].
Fig. 1 - Point source experimental design. Irrigation gradient expressed by crop coeficient values.
Fig. 1 Experimental design known as sprinkle point source.
The quality (appearance) of the lawn was compared with the observation of the color values of “Standard Soil Color Charts”[39]. Color values ≤ 5 correspond to a good visual appearance GVA of the lawn and the value 5 is the minimal absolute yield needed for the good appearance of the grass. This classification was complemented by “The Royal Horticultural Society’s Color Chart RHS [40].
The grass samples, under different irrigation and fertilization amounts, were mowed with scissors and collected at the predetermined distance from the sprinkler. The size of each sample was 0.25 m2 and the mowed grass was weighted, and then dried and weighted again.
The water plot was divided into two subplots of potassium treatments. Potassium application levels were K1 (25 kg ha-1 month-1); K2 (100 kg ha-1 month-1). The number of replications was four.
3 Results and discussion
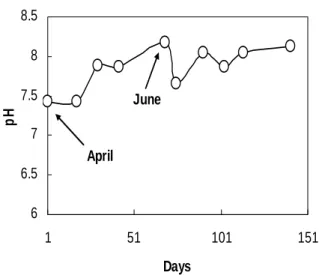
Figs. 2 and 3 show the evolution of the pH (Fig. 2) and potassium concentration (Fig. 3) in the irrigation water during the experimental period.
6 6.5 7 7.5 8 8.5 1 51 101 151 Days pH April June
Fig. 2. Evolution of the pH in the irrigation water between April and September.
It was seen that the pH was lower in April (7.43) and higher during June (8.05) possibly due to the higher water evaporation, and salts concentration increase.
0 5 10 15 20 25
April June July September
Dates
K
(
ppm
)
Fig. 3. Evolution of the potassium in the irrigation water during the research period.
It may be seen that the potassium concentration was high in all sampling dates, and the highest value was registered in June (20 ppm).
Fig. 4 shows the evolution of phosphorus, nitrate and ammonium in the irrigation water during the research period.
0 10 20 30 40 50 60 0 50 100 150 200 Days pp m P NO3- NH4+
Fig. 4. Evolution of the concentration of P, NH4+, and NO3- on the irrigation water between April and September.
Fig. 4 shows that P concentration was relatively uniform along the research period; however there was a slightly increase during July. The concentration of NO2- form was nearly null, but exceptionally on June was a sharply higher (data not shown). NH4+ concentration was relatively uniform and low (1-3 ppm), with a slight increase on the beginning of July (5 ppm). On the other hand, NO3 -concentration was not uniform along the research period, and it was observed a clear seasonal variation. A sharp increase was observed on August (45 ppm). Hence, it was seen a larger concentration of nitrogen during the Summer, (after 60 days) due to the evaporation increase and to the touristic flux.
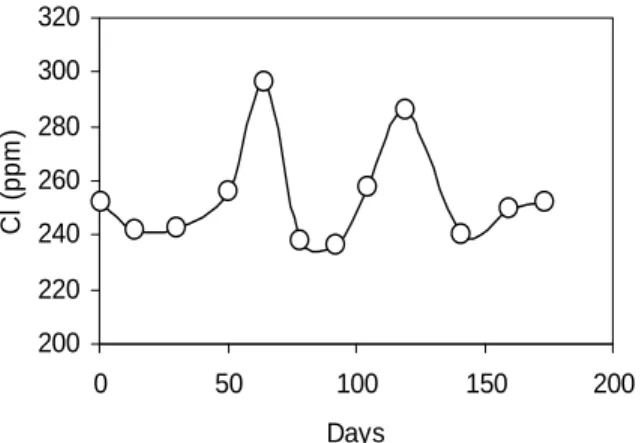
Figs. 5 and 6 show, respectively, the evolution of chlorides and electrical conductivity of the irrigation water during the research period.
200 220 240 260 280 300 320 0 50 100 150 200 Days Cl ( p p m )
Fig. 5. Evolution of chloride concentration the irrigation water during the research period.
It may be seen that the evolution of the chloride concentration was relatively uniform (250 ppm) and slightly higher during June and August (280-290 ppm) due to the higher water evaporation during the Summer. 1 1.1 1.2 1.3 1.4 1.5 1.6 1.7 1.8 1.9 2 0 50 100 150 200 Days EC ( d s /m )
Fig. 6. Evolution of the electrical conductivity of the irrigation water during the research period.
Fig. 6 shows that the evolution of the electrical conductivity of irrigation water was also relatively uniform (1.4 - 1.7 dS m-1) and slightly higher on the end of August (1.7 dS m-1) due to the higher water evaporation during the Summer and to increase of the touristic flux during the Summer, once that the irrigation water is treated wastewater.
Figs. 7 and 8 show, respectively, the Bermuda grass (Cynodon dactylon, Peers) response (dry matter yield
values and the quality level), to the combined effects of treated wastewater and potassium application, during Spring (May) and Summer (July).
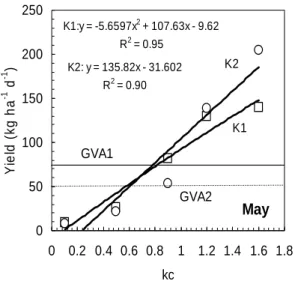
K1:y = -5.6597x2 + 107.63x - 9.62 R2 = 0.95 K2: y = 135.82x - 31.602 R2 = 0.90 0 50 100 150 200 250 0 0.2 0.4 0.6 0.8 1 1.2 1.4 1.6 1.8 kc Y ie ld ( k g h a -1 d -1 ) K2 K1 May GVA1 GVA2
Fig. 7. Relationships between yield and crop coefficient (kc) in May, for K1 (squares) and K2 (circles) treatments. Good visual appearance of the lawn, (GVA) corresponded to a yield of 75 kg in the K1 treatment (solid line) and to a yield of 50 kg in the K2 treatment (dashed line).
K1: y = 36.324x2 - 1.7842x + 27.102 R2 = 0.98 K2: y = 44.534x + 15.701 R2 = 0.79 0 50 100 150 200 250 0 0.2 0.4 0.6 0.8 1 1.2 1.4 1.6 1.8 kc Y iel d ( k g h a -1 d -1 ) K2 K1 July GVA1,2
Fig. 8. Relationships between yield and crop coefficient (kc) in July, for K1 (squares) and K2 (circles) treatments. Good visual appearance of the lawn (GVA) corresponded to a yield of 65 kg in both treatments (solid line).
The relation between kc values and grass yields were computed through the equations and determination coefficients (R2) of the curves, shown in Figs. 1 (May) and 2 (July).
Because of lack of randomization of the point source irrigation design the normal analysis of variance could be not used to evaluate significance. All the regression parameters were found to be significant at 0.05 to 0.01 level.
It is seen several general aspects: 1) monotonic increase of yields with the increase of water application; 2) in May, for each irrigation level there was a monotonic increase of yields with the increase of potassium application; 3) yield increases more with the increasing amount of water application than with the increase of potassium, particularly in May; 4) production was low in all cases, when there was no water application.
It may be seen that the good visual appearance of the lawn in May was appeared after a fresh matter yield of 75 kg ha-1 d-1 for K
1 and 50 kg ha-1 d-1 for K2; this shows the influence of potassium fertilization on the efficiency of water use by K2 treatment. On the other hand, on July (Fig. 3) that influence was not verified.
Maximum production was obtained in May (210 kg ha-1 d-1), and lower yield was obtained in July (114 kg ha-1 d-1), which was coincident to higher evaporative demand conditions. This was supported by the increase of the pH (7.4 in April and 8.1 in July) and of electrical conductivity of irrigation water (1.54 dS m-1 in May and 1.65 dS m-1 in July).
In May, it was seen that for higher amounts of water (kc > 0.6) the yield increased with the enhanced amount of potassium applied; this means that there was a positive interaction between potassium application and water effects. On the other hand, in July, for a kc > 0.4, yield increase was not so clear and yield was lower in both treatments, compared to the values obtained in May. This response suggests another limiting factor which may be associated to the leaching losses of potassium and to the increase of soil electrical conductivity of soil solution, according to the above mentioned increase of the electrical conductivity and pH of the irrigation water, which are ultimately coupled to climatic conditions.
4 Conclusions
In the golf courses of the Mediterranean basin, the evolution of fertilizers’ concentrations, salinity and pH of irrigation wastewater are larger during Summer due to the higher water evaporation and due to the increase of the touristic flux during this period. The irrigation water amount is the most pronounced limiting production factor of bermuda grass (Cynodon dactilon, Peers), when compared with potassium fertilization. The quality of the turfgrass, which can be expressed by its good visual appearance (GVA), was obtained for a kc around 0.6 in July. However, in May, GVA value was obtained at higher kc values due to higher growth rates. If the potassium fertilization is increased with high amounts of water application, production increases. On the other hand, yield decreases due to the above mentioned increase of salinity (potassium fertilizers are salts) and pH of irrigation water and of the pH, mainly on salt affected soils. Hence, in terms of their effects on the aesthetic quality of the lawn, an additional moderate application of water was sufficient to replace a considerable amount of potassium.
References:
[1] Costa, M.; Beltrao, J.; Dionisio, L.P.C.; Guerrero, C.A.C.; Brito, J.M.C.; Matos, L.; Rebelo, J.; Gamito, P. 2002. Response of fairway grasses of golf courses to potable water irrigation as compared to wastewater application. Acta Horticulturae 573:357-362. [2] Papaioannou, A.; Plageras, P.; Dovriki, E.;
Kakavas, K.; Nastos, P.; Paliatsos, A. G. 2006. Quality control of drinking water and public
health.
WSEAS Transactions on
Environment and Development
2(6):845-850.
[3] Hamdy, A. (2002). Sustainable use and management of non conventional water resources in arid regions. Acta Horticulturae 573:119-128.
[4] Lydakis-Simantiris, N.; Pentari, D.; Katsivela, E.; Koutoulakis, D.; Perdikatsis, V.; Pavlaki, A. 2006. A chemical and microbiological study of the water of the Agyia Springs in Western Crete.
WSEAS Transactions on Environment
and Development 2(6):816-822.
[5] Oron, G.; de Malach, Y; Hoffman, Z.; Manor, Y. 1992. Effect of effluent quality and application method on agricultural productivity and environmental control. Water Sci. Technol. 26, 1593-1601
Lisbon, Portugal.
[6] Arsenio, A.; Gamito, P.; Faleiro, M.L.; Brito, J.C. 1998. Wastewater quality for reuse on irrigation in Algarve. 1st International Conference on Environment Water: Innovative Issues in Irrigation and Drainage, ICID, Lisbon, Portugal.
[7]
Moura, B.; Dionísio, L.; Beltrão, J.; &
Borrego, J.J. 2006. Reclaimed wastewater
for golf course irrigation. WSEAS
Transactions on Environment and
Development 2(5):652-658.
[8] Marecos do Monte, M.H. 1996. Contribution to the use of treated wastewater for irrigation in Portugal. Ph.D. Thesis. Technical university of Lisbon, Portugal.
[9] Asano, T.; Mills, R.A. 1990. Planning and analysis for water reuse projects. J. Am. Water Works Association, 38-47. USA.
[10] Angelakis, A.N.; Tchobanoglous, G. (1997). Necessity of establishing EU guidelines for wastewater reclamation and reuse with emphasis to the EU Mediterranean countries. Acta Horticulturae 449(2):73-682.
[11] Oron, G.; Beltrao, J. 1993. Complete environmental effluent disposal and reuse by drip irrigation. M.A.C. Fragoso and M.L. van Beusichem (eds.), Optimization of Plant Nutrition, 589-592. Kluwer Academic Publishers.
[12]
Penkova, N.; Beltrão, J.; Oron, G.; Salgot,
M.; Alexandrov, V.; Khaydarova, V.;
Menzhulin, & Pobereijsky, L. 2002.
Secondary wastewater reuse as a
component of integrated water resources
management. Proceedings of the 5th
Conference on Water resources
Management in the ERA of Transition
(September, 4 - 8, 2002). Athens, Greece.
European Water Resources
Association:366-374.
[13] Salgot M. Brissaud F., Campos C.: 1996. Disinfection of secondary effluents by infiltration-percolation. Water Sci. and Tech.:33 (10-11): 271-276.
[14] Brenner A., Shandalov S., Messalem R., Yakirevich A., Oron G., Rebhun M.: 2000, Wastewater reclamation for agricultural reuse in Israel: Trends and experimental results. Water, Air and Soil Pollution; 123: 167-182. [15] Goudriaan, J. 1982. Potential production
process. In F.W.T. Penning de Vries and H.H. van Laar (eds.). Simulation of plant growth and crop production: 98-113. Pudoc, Wageningen, The Netherlands.
[16] Slatyer, R.O. 1967. Plant water relationships. Academic Press, New York, USA.
[17] Sinclair, T.R.; Tanner, C.B.; Bennet, J.M. 1984. Water use efficiency in crop production. BioScience 34:36-40.
[18] Choudhury, B. 1986. An analysis of observed linear correlations between net photosynthesis and a canopy-temperature-based plant water stress index. Agric. For. Meteorol. 36:323-333. [19] de Wit, C.T. 1958. Transpiration and crop
yields. Institute of Bilogical and Chemical Research on Field Crops and Herbage nº 64. wageningen, The Netherlands.
[20] Turgeon, A.J. 1980. Turfgrass management. 4th Prentice Hall. Eglewood Cliffs. USA.
[21] Beltrao, J.; Gamito, P. Guerrero, C.; Arsenio, A.; Brito, J. C. 1999. Grass response to minicipal wastewater as compared to nitrogen and water application. In: D. Anac & P. Martin-Prevel (Eds.). Improved Crop Quality by Nutrient Mangement 60: 263-266. Kluwer Academic Publishers.
[22] Carrow, R.N; Duncan, R.R. 1998. Salt affected turfgrass sites. Assessment and Management. Ann Arbor Press, Chelsea, Michigan, USA. [23] Miller, G.; Dickens, R. 1996a. Bermuda grass
carbohydrate levels as influenced by potassium fertilization and cultivar. . Crop Science 36: 1283-1289.
[24] Trenholm, L.E.; Dudeck, A.E.; Sartain, J.B.; Cisar, J.L.1998. Bermuda grass growth, total nonstructural carbohydrate concentration, and quality as influenced by nitrogen and potassium. Crop Science 38(1):168-174.
[25] Miller, G.; Dickens, R. 1996b. Potassium fertilizers related to cold resistance in Bermuda grass. Crop science 36: 1290-1295.
[26] Huck, M.; Carrow, R.N.; Duncan, R.R.. 2000. Effluent water: nightmare or dream come true ?. USGA Record 38(2): 15-29.
[27] Achilea, O. 2002. Alleviation of salinity – Induced stress in cash crops by multi-K (potassium nitrate); five cases typifying the underlying pattern. Acta Horticulturae 573:43-48.
[28] Ben Asher, J.; Pacardo, E. 1997. K uptake by root system grown in saline soil: A conceptual model and experimental results. Food security in the Wana region, the essential need for balanced fertilization: 360-369 International Potash Institute, Basel, Switzerland.
[29] Beard, J. B. 1982. Turfgrass management for golf courses. Prentice Hall. Englewood Cliffs, USA.
[30] Mantell, A.; Stanhill, G. 1981. Lawngrass. In Irrigation of field and orchard crops under semi-arid conditions (2nd edition). Shalhevet, J.; Mantell, A.; Bielorai, H.; Shimshi, D. (eds.). III C, Volcani Center, Bet Dagan, Israel. [31] Mateo Box, J.M; Urbano, P. 1985. The
Turfgrasses. 2ed. Madrid, Spain (spanish) [32] FAO-ISSS-ISRC. 1998. World reference base
for soil resources. 87 pp. FAO, Rome, Italy. [33] Angelakis, A.N.; Marecos do Monte, M.H.;
Bontoux, L.; Asano, T. 1999. The status of wastewater reuse practice in the Mediterranean basin: need for guidelines. Wat. Res. 33:2201-2217.
[34] Guerrero, C. 2004. Wastewater. Depurated wastewater reuse. Workshop on the Reuse of wastewater irrigation on golf courses.
Instituto
de Ciências Agrárias Mediterrânicas
(ICAM),
University of Évora, Portugal. Oral Communication.[35] Or, D.; Hanks, R. 1992. A single point source for the measurement of irrigation production functions. Irrig. Sci. 13:55-64.
[36] Christiansen, J. 1942. Irrigation by sprinkling. Calif. Agron. Esp. Bulletin 640. USA.
[37] Doorenbos, J.; Kassam, H. 191979. Yield response to water. FAO Irrigation Drainage Paper 33, Rome, Italy.
[38] Doorenbos, J.; Pruitt. 1977. Crop water requirements. FAO Irrigation Drainage Paper 24, Rome, Italy.
[39] Oyama, M.; Takehara, H. 1991. Revised standard Soil Color Charts. Ed. Eijkelkamp Agrisearch Equipment. Eijkelkamp, The Nederlands, 1-26.
[40] Royal Horticultural Society’s Color Chart RHS. Lodon, UK.

![Table 3 – Other chemical parameters of the irrigation water [34].](https://thumb-eu.123doks.com/thumbv2/123dok_br/18451445.897474/5.918.93.430.581.1003/table-chemical-parameters-irrigation-water.webp)