1 Departamento de Desporto e Saúde, Faculdade de Motricidade Humana, Universidade de Lisboa
trolled and acknowledged for exercise prescription. This study is inserted in the PICO Project (Clinical tri-al: NCT01832545).
Keywords: Walking capacity; Knee osteoarthritis; Knee pain; Obesity; 6MWT
IntroductIon
Knee osteoarthritis (KOA) is highly prevalent in obese individuals1and with the increasing obesity and aging
rate of the world population2, the expectations are that
the prevalence of KOA will increase too. Among the KOA risk factors (age, obesity, occupation, lower limb muscle weakness, previous knee injury and misalign-ment) only obesity, occupation and strength are con-sidered modifiable factors1,3,4. In the predictive model
presented by Zhang et al.5, six risk factors were related
to KOA incidence (age, sex, body mass index (BMI), occupation, family history and knee injury) and four risk factors were related to KOA progression (age, sex, knee injury and sports). Regarding BMI, a value above 30 kg/m2implies a greater risk of KOA incidence,
main-ly for bilateral occurrence6.
The majority of patients with KOA do not meet the recommended levels of physical activity7, leading to
weight gain and obesity8; the increased mechanical load
and knee muscle weakness related to obesity, exacer-bates mechanical pain and may aggravate the disease, providing a general loss of functionality and subsequent inactivity. The combination of obesity and KOA creates a vicious cycle of pain, physical activity reduction, loss of functionality, disease progression and, again, accen-tuation of sedentary behavior9. These cycles can be
worsened with depressive symptoms, which are fre-quently associated with obesity and KOA symptoms10,
whereby each can trigger and influence one another, further compromising the quality of life4.
In addition to local effects due to increased joint
Predictors of walking capacity in
obese adults with knee osteoarthritis
Yázigi F1, Espanha M1, Marques A1, Teles J1, Teixeira P1 ACTA REUMATOL PORT. 2018;43:256-263
AbstrAct
Introduction: Knee osteoarthritis (KOA) has a consid-erable prevalence in obese individuals and recommen-dations of weight loss for KOA management are gain-ing greater importance. Exercise is recommended to interrupt the cycle obesity-KOA-pain-inactivity, where walking is the most common exercise pattern recom-mended for obese individuals who initiate a weight loss exercise program. Thus this study aimed to analyse the factors which can affect the walking capacity in obese adults with symptomatic KOA.
Methods: 48 obese adults (age=55±7years; BMI=35±5 Kg/m2) with clinical and radiological KOA completed
self-reported questionnaires (Knee Injury and Os-teoarthritis Outcome Score, Brief Pain Inventory and Beck Depression Inventory), physical function tests (Six Minutes Walking Test-6MWT, chair sit and reach-CSRT, five repetition sit-to-stand test-FRSTST, hand-grip strength-HST, isokinetic knee strength) and body composition was determined.
Results: The best model (F= 41.485; p<.001) ex-plained 73% of the 6MWT’s variance, where fat mass of the most painful limb, knee pain severity and lower limb strength were the strongest predictors of the 6MWT.
Conclusion: Despite the importance of lower limb fat mass and strength, pain was the only variable that ap-peared as a predictor of 6MWT in the three tested mod-els. The existence of knee pain affects the capacity to walk or to perform weight bearing exercises and con-sequently the exercise’s adherence, compromising the objective of body composition improvement. Thus, au-thors suggest that, additionally to the lower limb strengthening, knee pain should be screened,
con-loading, obesity has systemic metabolic effects in KOA11caused by the higher concentrations of
inflam-matory markers (such as TNF-a and leptin12that are
predominantly secreted by adipose tissue)13. Beyond
the fact of leptin increases the synthesis of TNF-b, a stimulator of osteophyte formation14, the consequent
result of low-grade inflammation plays a pathophysi-ological role in OA because it can affect muscle func-tion, lower the individual’s pain threshold, and affect chondrocyte homeostasis, leading directly to cartilage matrix degradation12,15. Thus, weight loss and body
composition improvement is gaining increasing im-portance for KOA prevention and management3, 4, 13, 16.
For a general weight loss program, with an exercise and behaviour intervention lasting 3-6 months, the recommended reduction of initial body mass is be-tween 5-10%17. In cases of KOA, a decrease in BMI
close to 10% is suggested to have a beneficial impact on cartilage matrix degeneration17. Messier et al.16
re-ported that a weight reduction of 1 kg could mean a 4-fold decrease in knee load per step, with a 1.4% re-duction in knee abre-duction moment. Due to the high number of steps taken daily, this reduction can be con-sidered clinically significant and may assist with pain reduction eventually stimulating an increase in physi -cal activity.
Walking is one of the most important functions of the human being and is an essential capacity for au-tonomy and for maintaining an independent lifestyle18.
The aerobic capacity and walking ability in different populations have been evaluated using the Six Minu tes Walking Test (6MWT), and reference values rela -ted to obesity and KOA have been published5,19-22.
Capodaglio et al.23showed that the distance walked in
the 6MWT by obese adult individuals significantly cor-related to age, gender and BMI, proposing a reference equation where these variables explained 48% of va -riance of the walked distance. It has been found that the walking distance of obese individuals is signifi-cantly less than that of their lean counterparts20,22,23.
Additionally, individuals suffering from KOA adapt variations in gait biomechanics to avoid mechanical pain, compensating with dynamic balance which com-promises gait efficacy20.
In general, the walking capacity can be affected by age, sex, excess weight, fat free mass, cognitive limita-tions, lower limb strength, musculoskeletal and car-diovascular disorders, psychological factors, mobility and amount of weekly physical activity24-27. It is the
most common weight bearing exercise recommended
for obese individuals when initiating their weight loss exercise program. However, the muscle weakness, the existence of knee pain and other KOA symptoms could be a constraint for their physical performance, com-promising exercise motivation and adherence, espe-cially if symptoms of depression are also present10, 22.
Although the factors that may affect walking capaci -ty are well-known, in the case of obese individuals with KOA, there may be other factors that compromise their ability to walk and that should be considered in the prescription of exercises. Thus, to provide a better un-derstanding on this subject, the present study aimed to analyse the factors than can affect the walking ca-pacity in obese adults with symptomatic KOA.
Methods
This study was integrated in the PICO project (Inter-vention Program Against Osteoarthritis) and approved by the Ethical Committee of the Faculty of Human Ki-netics, University of Lisbon. The PICO project took place in Oeiras, Lisbon District, in our faculty campus, being that the physical tests and questionnaires were applied by exercise physiologists in our lab and inter-vention sessions was done in the auditorium and in the pool. More detailed information can be found in the study protocol previously published28. Trial
regis-tered number is NCT01832545.
PArtIcIPAnts
The recruitment and selection process was performed according to the eligibility criteria previously defined in the PICO project28: 40 ≤ age ≤ 65 years, BMI≥28.0
Kg/m2, unilateral or bilateral KOA (radiographic and clinical ACR criteria), knee pain, a sedentary lifestyle, being independent with mobility capacity, and reading and writing knowledge. All eligible individuals who contacted the study secretariat went through the same selection process, namely, a telephone-based pre–se-lection stage followed by a face to face interview and completion of the Knee Osteoarthritis Pre-Screening questionnaire (KOPS)29. Volunteers who fulfilled the
ACR clinical criteria30were referred to the radiological
examination and the final diagnosis was provided by a rheumatologist. The final sample included 48 indivi -duals (55±7 years), 35 females and 13 males with KOA, 71% of the sample was comprised of partici-pants between 40-59 years of age, while 29% fell between 6065 years of age. Only 25% of total indivi
-with higher association or correlation -with 6MWT and less correlated between themselves were selected as candidate predictors. The set of candidate predictors comprised the variables sex, age, KOOS Other Sym -ptoms, BPI pain severity, BDI score, FRSTST, extension isokinetic peak torque (extPKTQ), BMI, waist-to-hip ratio and lower limb fat mass. In case of occurrence of bilateral KOA, measures of the most painful knee were used for statistical analyses. The stepwise method was used for the variable selection purpose, considering the criterion Probability of F-to-enter ≤.05 and Probabili-ty of F-to-remove>=.10.
Statistical analysis was performed using IBM SPSS Statistics 20.0 and MedCalc Statistical Software (MedCalc Software, Mariakerke, Belgium). Statistical signifi cance was set at p<.05 (2-tailed) for all analyses.
results
Mean with standard deviation (SD), range and 95% confidence interval (CI) of main outcomes for the whole sample are given in Table I. The KOOS dimen-sions with poorest scores were Sport/rec and Quality of Life (QOL). The means of the BPI results, measured over the previous 24 hours, were below 5 on a 0-10 scale in each dimension, where the Pain Severity di-mension registered a mean score for the worst pain of 4.5±2.5, for the least pain of 2.6±2.3, and the mean pain on the testing day was 2.9±2.1. Among the seven items of Pain Interference dimension, the lowest scores were found for walking ability (3.9±3.0) and normal working (3.9±2.5).
Concerning depression, although BDI scores showed a wide range, the 95% CI for the entire sample was [9.0,14.7], where the lower limit represents a mini -mal (0–13) and the upper limit a mild depression clas-sification (14–19) (Table I).
The absolute value, of knee strength, of the most and less painful knee, corresponding to the relative results reported in Table I, were 86±34 Nm (PkTQ extMPK) and 105±41 Nm (PkTQ extLPK) for knee isokinetic ex-tension, and 48±22 Nm (PkTQ flexMPK) and 54±22 Nm (PkTQ flexLPK) for knee isokinetic flexion. The absolute values for isometric knee extension strength were 131±47 Nm (MPK) and 154±58 Nm (LPK).
The mean waist–to-hip ratio across all participants was greater than 0.90 (Table I), classifying the sample as abdominal obesity, according to the World Health Organization38. With respect to BMI, the total fat mass
duals were in retirement. Regarding the educational status, 81% of the participants reported having com-pleted 9th grade, while 46% comcom-pleted some college.
Procedures
KOA symptoms were assessed by the Portuguese ver-sion of the Knee Injury and Osteoarthritis Outcome Score (KOOS)31and by Brief Pain Inventory (BPI) –
short version32; mental health was assessed by Beck
De-pression Inventory (BDI-II)33. The Portuguese version
of the short form of the International Physical Activity Questionnaire (IPAQ) was used to assess the amount of physical activity in which each participant engaged per week34, where results is presented as metabolic equiva
-lent (METs). Questionnaires was applied along the two physical testing days, with random order and were filled by self-report and confirmed in an interview by the exercise physiologist.
The physical function tests included the Six Minutes Walking Test (6MWT), Chair Sit and Reach test (CSR),35, the Five-Repetition Sit-To-Stand Test
(FRSTST)21and the Handgrip Strength Test (HST)36.
Direct measurement of knee strength was assessed by isokinetic and isometric tests of both knee joints using a dynamometer Biodex System III (Biodex Medical Inc., Shirley, NY, U.S.A.)28. Lower Limbs were classified as
most painful knee (MPK) and less painful knee (LPK). Whole body, trunk and lower limb fat mass (FM%), strongly associated with KOA13, were assessed using a
Dual-energy X-ray Absorptiometry scanner-DXA (QDR 4500A, fan-beam densitometer, software version 8.21; Hologic, Waltham, USA)13. Anthropometric
measure-ments (body mass, stature and waist and hip circum-ferences) were collected according to the Internation-al Society for the Advancement of Kinanthropometry (ISAK) procedures37. The intra-observer technical error
for circumferences in the pilot study was 0.3. Body mass index was calculated as mass (measured in kilo-grams by a standard calibrated scale) divided by height squared (measured in meters).
stAtIstIcAl AnAlysIs
Descriptive analyses for the total sample were per-formed and the correlations between variables were provided using the Pearson Correlation Coefficient in-terpreted as strong (r≥0.7), moderate (0.5< r<0.7) and weak (0.3< r<0.5).
Regarding the underlying model assumptions, the independence of predictors, the normality and ho-moscedasticity were tested. In a first step, the variables
tAble III. descrIPtIve AnAlysIs of MAIn outcoMes of totAl sAMPle n=48 Mean SD Range 95% CI KOOS Pain 47.7 16.5 10-89 [42.9,52.5] Symptoms 50.7 20.6 11-96 [44.7,56.7] Sport/rec 29.4 18.9 0-80 [23.9,34.8] ADL 53.9 20.5 24-99 [47.9,59.8] QOL 36.1 19.0 0-81 [30.6,41.6] BPI Severity 3.6 1.9 0-7.8 [3.0,4.1] Interference 3.3 2.3 0-7.3 [2.6,3.9]
BDI Depression score 11.9 9.7 1-41 [9.0,14.7]
Physical 6MWT (m) 549 81 330-698 [525,573]
function Handgrip (Kg) 29.6 9.8 10-50 [26.7,32.4]
FRSTST (s) 11.0 2.7 6-18 [10.2,11.7]
CSRMPK (cm) -6.3 10.7 -29.5-14 [-9.4,-3.2]
Knee Strength Isometric PeakTorque MPK 1.44 0.47 0.54-2.59 [1.30,1.58] tests (N-M/Kg) Isometric PeakTorque LPK 1.68 0.53 0.80-2.67 [1.53,1.83] Isokinetic PeakTorque extension MPK 0.94 0.34 0.22-1.82 [0.84,1.04] Isokinetic PeakTorque extensionLPK 1.15 0.39 0.48-2.05 [1.04,1.26] Isokinetic PeakTorque flexion MPK 0.52 0.22 0.09-1.18 [0.46,0.59] Isokinetic PeakTorque flexion LPK 0.60 0.23 0.12-1.07 [0.53,0.66]
Body composition Weight (Kg) 90.8 13.9 67.4-127.8 [86.8,94.9]
BMI (Kg/m2) 35.0 5.0 29.2-50.7 [33.6,36.4]
Waist-to-Hip Ratio 0.9 0.1 0.7-1.1 [0.87,0.92]
Total Fat Mass (%) 34.3 10.0 48.5-61.0 [37.4,42.1]
Trunk Fat Mass (%) 39.9 6.8 21.2-50.4 [37.9,41.9]
IPAQ Physical activity (MET /week) 871 714 0-3996 [664,1078]
Sitting time (min/ week) 2258 808 810-4200 [2023,2492] Abbreviations: KOOS, Knee injury and Osteoarthritis Outcome Score; BPI, Brief Pain Inventory; BDI, Beck Depression Inventory; 6MWT,Six Minutes Walking Test; FRSTST, Five Repetitions Sit to Stand Test; CSR, Chair Sit and Reach; MPK, Most Painful Knee; LPK,Less Painful Knee; BMI, Body Mass Index; IPAQ, International Physical Activity Questionnaire
reported sitting time per week corresponded to a mean of 5.4 hours per day, and some participants reported being in a seated position up to 10 hours per day.
PredIctIve Models
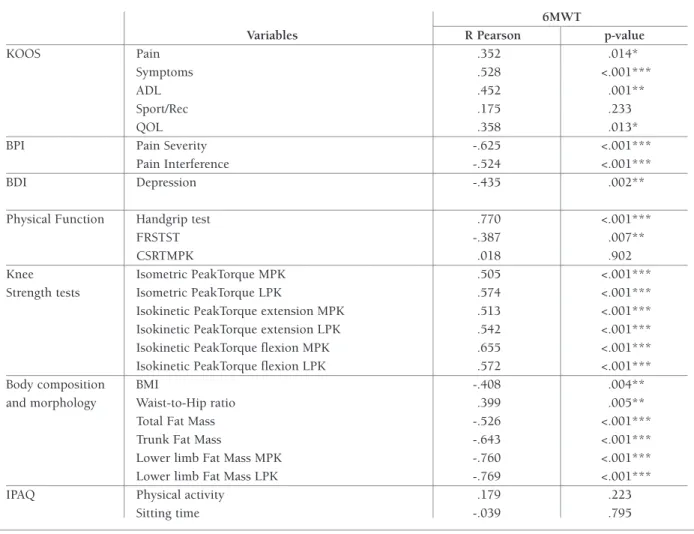
Prior to performing linear regression analyses to iden-tify predictive factors of 6MWT, correlation analyses were conducted to gain a better understanding of how KOA symptoms and quality of life (measured by KOOS, BPI, BDI) and physical fitness outcomes (strength, flexibility and body composition) are asso-ciated with the 6MWT results. Pearson product-mo-ment correlation coefficients are shown in Table II. Re-garding KOOS dimensions, only the Sport/Rec showed no significant correlation with 6MWT, while Other Symptoms and ADL had a weak and moderate corre-lation, respectively. Furthermore, BPI pain scores had and the trunk fat mass, as well as the mean results and
CI reinforced the obesity classification of the majority of participants in this study.
The mean waist–to-hip ratio across all participants was greater than 0.90 (Table I), classifying the sample as abdominal obesity, according to the World Health Organization38. With respect to BMI, the total fat mass
and the trunk fat mass, as well as the mean results and 95% CI reinforced the obesity classification of the ma-jority of participants in this study.
In relation to the initial level of physical activity, al-though the weekly mean METS of physical activity re-ported by the total sample was classified as a moderate level, none of the individuals were participating in any structured or supervised exer cise program and some participants indicated not having any type of physical activity equal to or greater than 10 min (low level). The
tAble II. PeArson Product-MoMent correlAtIons And 2-tAIled P-vAlue between 6Mwt And Koos, bPI, bdI, IPAQ And body coMPosItIon
6MWT
Variables R Pearson p-value
KOOS Pain .352 .014*
Symptoms .528 <.001***
ADL .452 .001**
Sport/Rec .175 .233
QOL .358 .013*
BPI Pain Severity -.625 <.001***
Pain Interference -.524 <.001***
BDI Depression -.435 .002**
Physical Function Handgrip test .770 <.001***
FRSTST -.387 .007**
CSRTMPK .018 .902
Knee Isometric PeakTorque MPK .505 <.001***
Strength tests Isometric PeakTorque LPK .574 <.001***
Isokinetic PeakTorque extension MPK .513 <.001*** Isokinetic PeakTorque extension LPK .542 <.001*** Isokinetic PeakTorque flexion MPK .655 <.001*** Isokinetic PeakTorque flexion LPK .572 <.001***
Body composition BMI -.408 .004**
and morphology Waist-to-Hip ratio .399 .005**
Total Fat Mass -.526 <.001***
Trunk Fat Mass -.643 <.001***
Lower limb Fat Mass MPK -.760 <.001***
Lower limb Fat Mass LPK -.769 <.001***
IPAQ Physical activity .179 .223
Sitting time -.039 .795
Abbreviations: KOOS: Knee injury and Osteoarthritis Outcome Score; BPI: Brief Pain Inventory; BDI: Beck Depression Inventory; 6MWT,Six Minutes Walking Test; FRSTST: Five Repetitions Sit to Stand Test; CSR: Chair Sit and Reach; MPK: Most Painful Knee; LPK,Less Painful Knee; BMI: Body Mass Index; IPAQ: International Physical Activity Questionnaire.
*p<0.05, **p<0.01, ***p <0.001
6MWT showed no significant correlation with the IPAQ outco mes. Predictors for the 6MWT in obese adults with KOA were found using stepwise linear re-gression (Table III).
The first model (F= 41.485; p<.001), explained 73% of the variance in 6MWT. Despite having tested all variables, only the %Fat mass of the most painful knee, BPI pain severity (BPI severity) and FRSTST remained significant (Table III). The equation of model 1 is as follows:
6MWT (m) = 849.676 – (4.883´Lower Limb FM%) – (17.270´BPI Sev) – (5.606 ´ FRSTT) a stronger correlation with 6MWT than the KOOS Pain
dimension.
Mental health, represented by BDI, had a mode rate and significant correlation (p<.001) with the 6MWT. Of the physical function and strength tests, the hand-grip test was strongly correlated with the 6MWT while the isokinetic knee extension and flexion and isomet-ric knee extension showed a moderate correlation with the 6MWT. With respect to body composition, lower limb fat mass was strongly and inversely correlated with the 6MWT. All other body composition variables had mo derate correlations with 6MWT, while the waist-to-hip ratio had a weak and positive correlation. The
The second model (Table III), which did not con-sider the outcomes from the scanner and dynamome-ter (fat mass and isokinetic strength), was significant and explained 65% of the variance of 6MWT (F= 29.989; p<.001), revealing Sex, BPI severity and FRSTST as a predictive factors. The equation of second model is as follow:
6MWT (m) = 649.797 + (92.367 ´ Sex) – (14.048 ´ BPI Sev) – (6.878 ´ FRSTST) sex = 1, for male and sex = 0, for female.
The third model was tested considering the same candidate predictors as those used in model 2, but without inclusion of the lower limb strength assessed by FRSTST, a physical test that would not be conve-nient to perform in a clinical context. The third model was also significant (F= 37.262; p<.001) and explained 61% of the variance. In this model two variables pre-dicted 6MWT, Sex and BPI severity. The equation of this third model is as follow:
6MWT (m) = 572.292 + (101.641´Sex) – (14.162´BPI Severity)
sex = 1 for male and sex = 0, for female.
dIscussIon
The difficulty in finding other studies that applied a broad battery of tests with similar sample population, compromised the development of this discussion. However this reinforce the pertinence of this study. The analysis of the three models presented (Table III) pro-vides important information regarding the walking ca-pacity in obese individuals with KOA. In addition to the walking distance of obese individuals being signifi -cantly smaller compared to lean individuals20, 23there
is an association with the functional limitations im-posed by KOA symptoms, leading to the adoption of different gait patterns to ensure maintenance of ba lance and to avoid mechanical pain, thereby compromising gait efficacy20and decreasing gait speed.
Capodaglio and coworkers23showed that the 6MWT
in obese individuals was significantly correlated with age, gender and BMI, and proposed a reference equa-tion where these variables could explain 48% of the walked distance: 6MWTm= 894.2177 – [2.0700 ´ age (yrs)] – (51.4489 ´ gender) – [5.1663 ´ BMI (Kg/m2)]. Our results are in accordance with this study
and show a significant correlation between 6MWT and body composition, body morphology and OA sym -ptoms. However, the model of Capodaglio23included
age as a predictive factor for 6MWT and in our mo dels, tAble III. MultIPle regressIon Models of PredIctIve vArIAbles for 6Mwt
Model Adj. R2 F Predictor Variables B SE B b p
Model 1 .725 41.49
Constant 849.68 32.38 <.001***
%FM_ MPK -4.39 0.73 -.537 <.001***
BPI pain severity -17.27 3.58 -.407 <.001***
FRSTST -5.61 2.51 -.182 .030*
Model 2 .649 29.99
Constant 649.81 36.16 <.001***
Sex 92.37 18.58 .510 <.001***
BPI pain severity -14.05 4.20 -.336 .002**
FRSTST -6.88 2.71 -.225 .015*
Model 3 .607 37.26
Constant 572.29 20.48 <.001***
Sex 101.64 19.29 .561 <.001***
BPI pain severity -14.16 4.45 -.339 .003** Abbreviations: FM: fat mass; BPI: Brief Pain Inventory; 6MWT: ix Minutes Walking Test; FRSTST: Five Repetitions Sit to Stand Test; CSR: Chair Sit and Reach; MPK: Most Painful Knee; LPK: Less Painful Knee.
age was not significant, possibly due the fact that our sample included adults rather than older persons. This suggests that the effects of aging lost importance in adults sample, where other variables became more im-portant. The advantage of using data from the present study to evaluate the predictors for 6MWT was the abi -lity to test models with a broad variety of dimensions, from physical fitness and mental health to KOA sym -ptoms and health-related quality of life.
Regarding knee strength, deficits in quadriceps activa tion can moderate the relationship between knee strength and physical function,39and this is considered
in the literature as a significant predictor for the 6MWT performance40. Curiously, despite the correlations that
were found between strength tests and 6MWT, the FRSTST remained significant and, instead of the knee strength tests, was included in Models 1 and 2. A possi -ble explanation is that walking long distances require more resistance than maximal strength. Therefore, al-though both maximal isometric and isokinetic strength (extension and flexion) were associated with walking distance, only the functional strength obtained by the FRSTST was a predictor of walking ability in models 1 and 2. Also, participants did not reveal considerable knee muscle weakness, and this could explain the obser vation that knee strength outcomes did not show relevant results in the three models presented. In addi -tion, we did not perform eccentric strength tests, an important component for physical function activities. Although the variables selected for testing are be-coming increasingly simple and accessible, the knee pain obtained from BPI severity is a relevant predictor for the 6MWT in each of the three models. It was ex-pected that the fat mass included in Model 1 would be substituted with the BMI when the variables from DXA scanner became unavailable for Model 2 and 3, but this was not observed, and Models 2 and 3 did not reveal BMI or other body morphology as predictors for 6MWT.
The advantage of this study in comparison with others was the possibility to test objective measures in combination with sex, age and self-reported outcomes from questionnaires. The analysis of predictors for the 6MWT indicated that knee pain is a limitation for obese individuals initiating an exercise program that includes weight bearing activities, and should be considered at the onset. Although it seems obvious, the importance of a frequent knee pain assessment should be rein-forced for exercise professionals who works with obese individuals in weight control programs, in order to
guarantee an adequate exercise prescription. Exercise mode and volume should be adapted according knee pain intensity, otherwise it becomes a constraint for meeting exercise program goals, compromising the adher ence of participants.
corresPondence to
Flávia Yázigi
Faculdade de Motricidade Humana, Estrada da Costa E-mail: [email protected]
references
1. Martin KR, Kuh D, Harris TB, Guralnik JM, Coggon D, Wills AK. Body mass index, occupational activity, and leisure-time physical activity: an exploration of risk factors and modifiers for knee osteoarthritis in the 1946 British birth cohort. BMC Musculoskelet Disord. 2013;14:219. Epub 2013/07/26. 2. International Obesity Taskforce (IOTF). The Global Epidemic:
IASO/IOTF analysis EUA: IOTF; 2010 [cited 2013 July, 11th]; Available from: http://www.iaso.org/iotf/obesity/obesitythe-globalepidemic/.
3. Muthuri SG, Hui M, Doherty M, Zhang W. What if we prevent obesity? Risk reduction in knee osteoarthritis estimated through a meta-analysis of observational studies. Arthritis Care Res (Hoboken). 2011;63(7):982-90. Epub 2011/03/23.
4. McAlindon TE, Bannuru RR, Sullivan MC, Arden NK, Beren-baum F, Bierma-Zeinstra SM, et al. OARSI guidelines for the non-surgical management of knee osteoarthritis. Osteoarthritis Cartilage. 2014;22(3):363-88. Epub 2014/01/28.
5. Zhang W, McWilliams DF, Ingham SL, Doherty SA, Muthuri S, Muir KR, et al. Nottingham knee osteoarthritis risk prediction models. Ann Rheum Dis. 2011;70(9):1599-604. Epub 2011/05/27.
6. Sturmer T, Gunther KP, Brenner H. Obesity, overweight and pat-terns of osteoarthritis: the Ulm Osteoarthritis Study. J Clin Epi-demiol. 2000;53(3):307-13. Epub 2000/04/13.
7. Farr JN, Going SB, Lohman TG, Rankin L, Kasle S, Cornett M, et al. Physical activity levels in patients with early knee os-teoarthritis measured by accelerometry. Arthritis Rheum. 2008;59(9):1229-36. Epub 2008/09/02.
8. Flegal KM, Carroll MD, Ogden CL, Johnson CL. Prevalence and trends in obesity among US adults, 1999-2000. JAMA. 2002;288(14):1723-7. Epub 2002/10/09.
9. Pisters MF, Veenhof C, van Dijk GM, Dekker J. Avoidance of ac-tivity and limitations in activities in patients with osteoarthritis of the hip or knee: a 5 year follow-up study on the mediating role of reduced muscle strength. Osteoarthritis Cartilage. 2014;22(2):171-7. Epub 2013/12/18.
10. Pereira D, Severo M, Barros H, Branco J, Santos R, Ramos E. The effect of depressive symptoms on the association between radiographic osteoarthritis and knee pain: a cross-sectional study. BMC Musculoskelet Disord. 2013;14(1):214.
11. Lee S, Kim TN, Kim SH. Sarcopenic obesity is more closely as-sociated with knee osteoarthritis than is nonsarcopenic obesi-ty: a cross-sectional study. Arthritis Rheum. 2012;64(12):3947-54. Epub 2012/11/30.
12. Fowler-Brown A, Kim DH, Shi L, Marcantonio E, Wee CC, Shmerling RH, et al. The mediating effect of leptin on the rela-tionship between body weight and knee osteoarthritis in older adults. Arthritis Rheumatol. 2015;67(1):169-75. Epub
2014/10/11.
13. Visser AW, de Mutsert R, Loef M, le Cessie S, den Heijer M, Bloem JL, et al. The role of fat mass and skeletal muscle mass in knee osteoarthritis is different for men and women: the NEO study. Osteoarthritis Cartilage. 2014;22(2):197-202. Epub 2013/12/18.
14. Scharstuhl A, Glansbeek HL, van Beuningen HM, Vitters EL, van der Kraan PM, van den Berg WB. Inhibition of endogenous TGF-beta during experimental osteoarthritis prevents osteo-phyte formation and impairs cartilage repair. J Immunol. 2002;169(1):507-14. Epub 2002/06/22.
15. Mobasheri A. Osteoarthritis year 2012 in review: biomarkers. Osteoarthritis Cartilage. 2012;20(12):1451-64. Epub 2012/07/31.
16. Messier SP, Gutekunst DJ, Davis C, DeVita P. Weight loss re-duces knee-joint loads in overweight and obese older adults with knee osteoarthritis. Arthritis Rheum. 2005;52(7):2026-32. Epub 2005/06/30.
17. Serebrakian AT, Poulos T, Liebl H, Joseph GB, Lai A, Nevitt MC, et al. Weight loss over 48 months is associated with reduced progression of cartilage T2 relaxation time values: data from the osteoarthritis initiative. J Magn Reson Imaging. 2015;41(5): 1272-80. Epub 2014/04/05.
18. Messier SP, Loeser RF, Hoover JL, Semble EL, Wise CM. Os-teoarthritis of the knee: effects on gait, strength, and flexibility. Arch Phys Med Rehabil. 1992;73(1):29-36. Epub 1992/01/01. 19. Beriault K, Carpentier AC, Gagnon C, Menard J, Baillargeon JP, Ardilouze JL, et al. Reproducibility of the 6-minute walk test in obese adults. Int J Sports Med. 2009;30(10):725-7. Epub 2009/07/09.
20. Hulens M, Vansant G, Claessens AL, Lysens R, Muls E. Predic-tors of 6-minute walk test results in lean, obese and morbidly obese women. Scand J Med Sci Sports. 2003;13(2):98-105. Epub 2003/03/19.
21. Schlenk EA, Lias JL, Sereika SM, Dunbar-Jacob J, Kwoh CK. Improving physical activity and function in overweight and obese older adults with osteoarthritis of the knee: a feasibility study. Rehabil Nurs. 2011;36(1):32-42. Epub 2011/02/05. 22. Ekman MJ, Klintenberg M, Bjorck U, Norstrom F, Ridderstrale
M. Six-minute walk test before and after a weight reduction pro-gram in obese subjects. Obesity (Silver Spring). 2013;21(3): E236-43. Epub 2013/02/14.
23. Capodaglio P, De Souza SA, Parisio C, Precilios H, Vismara L, Cimolin V, et al. Reference values for the 6-Min Walking Test in obese subjects. Disabil Rehabil. 2013;35(14):1199-203. Epub 2012/10/16.
24. Lord SR, Menz HB. Physiologic, psychologic, and health pre-dictors of 6-minute walk performance in older people. Arch Phys Med Rehabil. 2002;83(7):907-11.
25. Pankoff B, Overend T, Lucy D, White K. Validity and respon-siveness of the 6 minute walk test for people with fibromyalgia. J Rheumatol. 2000;27(11):2666-70.
26. Carter R, Holiday DB, Nwasuruba C, Stocks J, Grothues C, Tiep B. 6-minute walk work for assessment of functional capacity in patients with COPD. Chest. 2003;123(5):1408-15.
27. Correia de Faria Santarem G, de Cleva R, Santo MA, Bernhard AB, Gadducci AV, Greve JM, et al. Correlation between Body Composition and Walking Capacity in Severe Obesity. PLoS One. 2015;10(6):e0130268. Epub 2015/06/23.
28. Marques A, Martins J, Ramos M, Yazigi F, Carreiro da Costa F. Perception and reality - Portuguese adults' awareness of active lifestyle. Eur J Sport Sci. 2013. Epub 2013/09/18.
29. Yazigi F, Carnide F, Espanha M, Sousa M. Development of the Knee OA Pre-Screening Questionnaire. Int J Rheum Dis. 2014. Epub 2014/09/27.
30. Altman R, Alarcon G, Appelrouth D, Bloch D, Borenstein D, Brandt K, et al. The American College of Rheumatology criteria for the classification and reporting of osteoarthritis of the hip. Arthritis Rheum. 1991;34(5):505-14. Epub 1991/05/01. 31. Goncalves RS, Cabri J, Pinheiro JP, Ferreira PL. Cross-cultural
adaptation and validation of the Portuguese version of the Knee injury and Osteoarthritis Outcome Score (KOOS). Os-teoarthritis Cartilage. 2009;17(9):1156-62. Epub 2009/03/24. 32. Ferreira-Valente MA, Pais Ribeiro JL, Jensen MP. Further Vali-dation of a Portuguese Version of the Brief Pain Inventory In-terference Scale. Clínica y Salud. 2012;23:89-96.
33. Campos RC, Goncalves B. The Portuguese Version of the Beck Depression Inventory-II (BDI-II) Preliminary Psychometric Data with Two Nonclinical Samples. European Journal of Psycho-logical Assessment. 2011;27(4):258-64.
34. Craig CL, Marshall AL, Sjostrom M, Bauman AE, Booth ML, Ainsworth BE, et al. International physical activity question-naire: 12-country reliability and validity. Medicine and science in sports and exercise. 2003;35(8):1381-95.
35. Jones CJ, Rikli RE, Max J, Noffal G. The reliability and validity of a chair sit-and-reach test as a measure of hamstring flexibil-ity in older adults. Res Q Exerc Sport. 1998;69(4):338-43. Epub 1998/12/29.
36. Deforche B, Lefevre J, De Bourdeaudhuij I, Hills AP, Duquet W, Bouckaert J. Physical fitness and physical activity in obese and nonobese Flemish youth. Obes Res. 2003;11(3):434-41. Epub 2003/03/14.
37. Marfell-Jones M, Olds T, Stewart A, Lindsay Carter JE. Interna-tional Standards for Anthropometric Assessment.: Potchef-stroom: ISAK.; 2006.
38. American College of Sports Medicine (ACSM). ACSM's Guide-lines for Exercise Testing and Prescription. 109th ed: Lippincott Williams & Wilkins; 20173.
39. Fitzgerald GK, Piva SR, Irrgang JJ, Bouzubar F, Starz TW. Quadriceps activation failure as a moderator of the relationship between quadriceps strength and physical function in individ-uals with knee osteoarthritis. Arthritis Rheum. 2004;51(1):40-8. Epub 2004/02/12.
40. Maly MR, Costigan PA, Olney SJ. Contribution of psychosocial and mechanical variables to physical performance measures in knee osteoarthritis. Phys Ther. 2005;85(12):1318-28. Epub 2005/11/25.
![tAble III. descrIPtIve AnAlysIs of MAIn outcoMes of totAl sAMPle n=48 Mean SD Range 95% CI KOOS Pain 47.7 16.5 10-89 [42.9,52.5] Symptoms 50.7 20.6 11-96 [44.7,56.7] Sport/rec 29.4 18.9 0-80 [23.9,34.8] ADL 53.9 20.5 24-99 [47.9,59.8] QOL 36.1 19.0 0-81 [3](https://thumb-eu.123doks.com/thumbv2/123dok_br/18368285.891510/4.880.92.792.166.656/table-descriptive-analysis-outcomes-sample-range-symptoms-sport.webp)