281
GRID SAMPLE FOR SPATIAL STUDY OF SOIL PENETRATION RESISTANCE IN AN ELEPHANT GRASS FARMING AREA
Elder Barboza de Souza1, Jorge Wilson Cortez2, Nelci Olszevski1, Hideo de Jesus Nagahama1, Alan da Cunha Honorato1, Victor Fonseca de Araújo1 & Jardênia Rodrigues Feitosa3
1Universidade Federal do Vale do São Francisco. E-mail:[email protected]; [email protected]; [email protected]; [email protected]; [email protected]
2Universidade Federal da Grande Dourados. E-mail: [email protected] 3Universidade Federal de Viçosa. E-mail: [email protected]
ABSTRACT
This research aimed at evaluating the sampling grids to determine the spatial soil mechanic resistance penetration (RP) in an area cultivated with elephant grass. Data analysis showed that the highest PR values occurred at the 0.10-0.30 m layer. As for the geostatistical analysis, the RP presented spatial dependence for all layers and sample meshes and the sampling mesh of 20 x 20 m, presented a higher amount of informations.
Keywords: Ultisol, soil compaction, geoestatistic
MALHAS AMOSTRAIS PARA ESTUDO ESPACIAL DA RESISTÊNCIA À PENETRAÇÃO EM CULTIVO DE CAPIM ELEFANTE
RESUMO
Objetivou-se avaliar malhas amostrais para determinação espacial da resistência mecânica do solo à penetração (RP) em área cultivada com capim elefante. O experimento foi realizado em Argissolo Amarelo com textura arenosa. A análise dos dados indicou que os maiores valores de RP ocorreram na camada 0,10-0,30 m. Quanto à análise geoestatística, a RP apresentou dependência espacial para todas as camadas e malhas amostrais e que a malha amostral 20 x 20 m, apresenta maior quantidade de informações.
INTRODUCTION
With the large usage of farming machinery and the intensification of agriculture farming, the soil managment is the one of the practices thas has been most altered in the last years. In general, the inadequate soil managment of the farming soils has a tendency to increase soil density and penetration resistance, hence, decrease of soil porosity and sometimes the available water content for the plants, attributes that show a significant relationship with root growth and development (REICHERT et al., 2014, REICHERT et al., 2014b, REICHERT et al., 2016).
It is important to emphasize that the knowledge of spatial and time variability of soil properties and crops are shown as the basic principle for the precise management of agricultural areas, in any scale (GREGO & VIEIRA, 2005, AMADO et al., 2009). To study the spatial variability, currently, we use techniques such as geostatistics, based on the "theory of regionalized variables" (MERCANTE et al., 2003, YAMAMOTO & LANDIM, 2013). The great advantage of this technique is due to the fact that some soil attributes are not completely independent and the spatial variability must be considered in the statistical analysis of the data (CARVALHO et al., 2004), leading to a better understanding of the processes of interactions among soil, plant and atmosphere.
Several similar studies such as from Bottega et al. (2011), Santos et al. (2012), and Mercante et al. (2003), are being carried out to characterize the degree of structure and spatial variability of soil physical attributes in different regions and soil classes. When evaluating soil penetration resistance (PR) in a dystrophic Red Latosol, Marasca et al. (2011) observed spatial dependence in all evaluated layers of RP expressed through semivariograms. In precision agriculture, geostatistics is essential and the determination of the number of samples that is representative for a given area and conditions are one of the limiting factors for the spatialization of soil attributes. Data collection in the precision farming system is one of the basic steps to be taken. The determination of a number of samples that ensures a reliable average value will save time and work, and there is a positive cost-benefit ratio through the accuracy in the lowest cost evaluation (TAVARES FILHO & RIBON, 2008). Therefore, it is indispensable to create sample grids, which consist of spliting the area into rectangular or quadratic sections of equal and reduced size, so that samples are taken in each section (STEPIEN et al., 2013, MONTANARI et al., 2012).
Therefore, this study aims at evaluating grid samples for the spatial determination of soil mechanical resistance to penetration in an elephant grass farming area in the Brazilian semiarid region.
283
MATERIAL AND METHODS
The study area was located at the Campus of Agricultural Sciences at the “Universidade Federal do Vale do São Francisco” in Petrolina, state of Pernambuco, Brazil, at the geographical coordinates 9º 23 '' S and 40º 30 '' W and 376 m altitude. The typical climate of this area is known as Bswh, according to the classification of Köppen, characterized by the scarcity and irregularity of the precipitations with rains in the summer and strong evaporation as a consequence of the high temperatures.
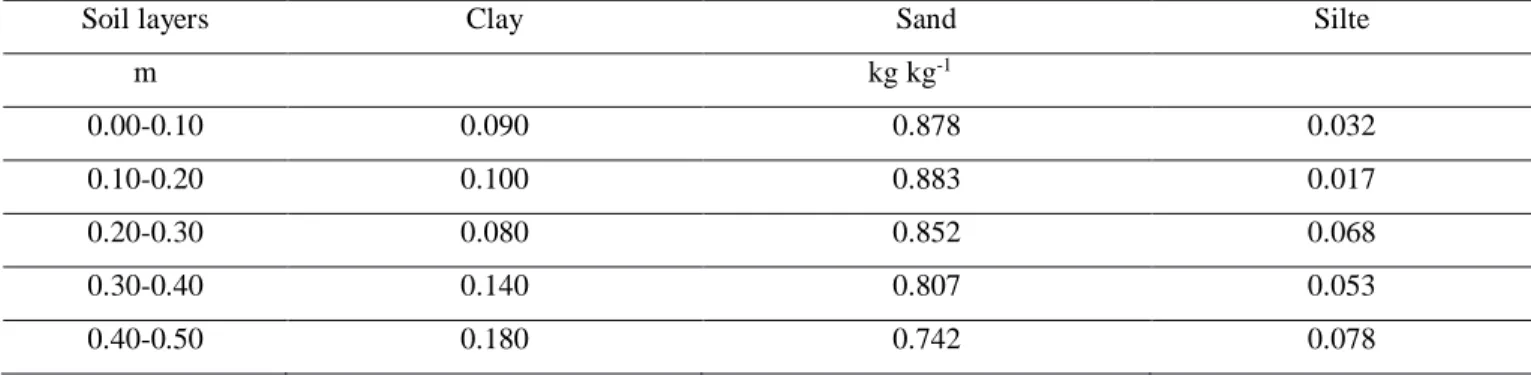
The soil in the experimental study area was classified as sand Ultisol, according to the soil taxonomy keys (Soil Survey Staff, 2014) and its granulometry was determined by the pipette method (DONAGEMA et al, 2011). The soil moisture at the moment of data collection of penetration resistance was close to the soil field capacity, which was 11%.
Table 1. Granulometric soil composition and moisture content during data collection for the layers of the Ultisol.
Soil layers Clay Sand Silte
m kg kg-1 0.00-0.10 0.090 0.878 0.032 0.10-0.20 0.100 0.883 0.017 0.20-0.30 0.080 0.852 0.068 0.30-0.40 0.140 0.807 0.053 0.40-0.50 0.180 0.742 0.078
The experimental area was cultivated with an elephant grass (Pennisetum purpureum) since the 1980s. However, the area was restructured in 2007, with a new harrow of discs of 0.61 m in diameter and then grooved with a threaded tips of two nozzles harrower. The elephant grass was harvested mechanically during 60 days with forage implement coupled into the tractor. The irrigation system of the crop was performed by conventional fixed grid sprinkler.
The area delimited for the study was of 120 x 400 m dimensions (4.8 ha). For the evaluation of PR in the field, an IAA / Planalsucar-Stolf impact penetrometer was used for measuring according to a methodology proposed by Stolf (1991), where is counted the number of impacts caused by the fall of a piston in a constant stroke, in the layers of 0.00-0.10; 0.10-0.20; 0.20-0.30; 0.30-0.40; and 0.40-0.50 m, the values obtained were then converted into MPa in each layer, which simulates the resistance that the soil offers. For the determination of the number of representative samples of PR in the area, there were used 03 types of grid sample of: (i) 20 x 20 m (147 sample points); (ii) 40 x 40 m (44 sample points)
and (iii) 60 x 60 m (21 sample points). Deformed soil samples were collected for determination of the gravimetric moisture at the time of the RP data collection.
The data collected was submitted to descriptive statistical analysis for visualization of general dispersion and position of the data, that obtained parameters: mean, standard deviation, variance, coefficient of variation (CV%), asymmetry, and kurtosis. The normality of the data was verified with the Ryan-Joiner test.
For the semivariance analysis, semivariograms were adjusted for each soil layer to the depth of 0.50 m. The semivariogram adjustment was performed by selecting the model and its parameters with the maximum coefficient of determination and the smallest value of the square sum of residuals.
Subsenquently, in the semivariogram were adjusted: the nugget effect (Co), which highlights the discontinuity of the semivariogram; The threshold (Co + C1), which corresponds to the value of the semivariance equivalent to its reach; The range (a), which corresponds to the spatial dependence boundary distance, from which the samples are considered independent, and therefore classical statistics can be used without restriction; And the contribution (C), which corresponds to the difference between the level and the nugget effect, and represents the spatially structured semivariance (AMARO FILHO, 2008). Then, for interpolation, there was used Kriging to predict non-sampled areas. Furthermore, this method proposes the moving average estimate of values of variables distributed in space from adjacent values, while considered interdependent by a function called a variogram that was conventionally described as semivariogram (LANDIM & STURARO, 2002) and, thus, generating maps of isolines for each layer and for each sampling grid.
RESULTS AND DISCUSSION
Considering the analysis of the soil moisture content along the soil profile, it can be verified that the moisture percentage is uniform up to 0.50 m depth (Table 1). Hence, the differences of the RP levels found can be attributed to the physical attributes of the soil, such as total porosity and state of compaction (CARVALHO et al., 2008).
In relation to the RP (Figure 1), it can be seen that the average values presented variations for the grid samples dimensions. The 20 x 20 m grid sample showed an intermediate PR when compared to 40 x 40 m and 60 x 60 m. The 40 x 40 m grid sample showed a lower average RP value, while the 60 x 60 m grid sample presented the highest RP values.
285
Figure 1. Mean values of RP (MPa) in the layers of 0.00-0.10; 0.10-0.20; 0.20-0.30; 0.30 0.40 and
0.40-0.50 m and 20 x 20, 40 x 40 and 60 x 60 m grid sample. (Petrolina PE, 2012)
The mean values of PR in all grid samples were below the critical value of PR that, according to Sene et al. (1985), for sandy soils is between 6.0 and 7.0 MPa. Thus, with the average RP values, it was observed that mechanical intervention would not be required to remove compacted layers, up to a depth of 0.50 m. However, Freddi et al. (2009) state that there may be limitation of water content when PR reaches 2.15 MPa; which can be verified from the 0.10 m layer (Figure 1).
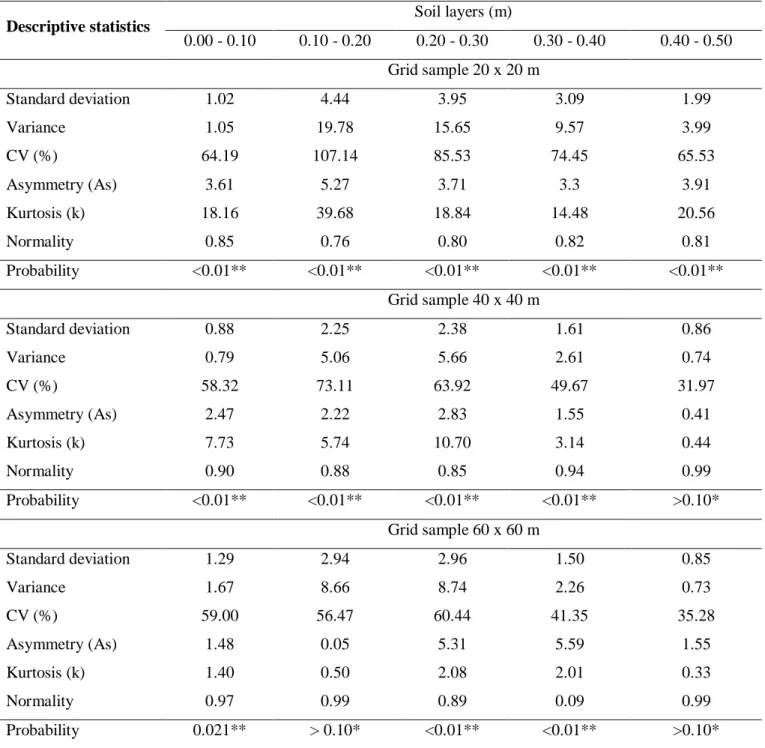
Furthermore, by the limits of coefficient of variation (CV) suggested by Warrick & Nielsen (1980) for the classification of soil attributes, it can be said that RP data presented mean CV (12% <CV> 60%) in the layers 0.00 -0.10; 0.30-0.40 and 0.40-0.50 m, for the grid sample of 40 x 40 m, and in the layers 0.00-0.10; 0.10-0.20; 0.30-0.40; and 0.40-0.50 m, for the 60 x 60 m sampling grid (Table 2). In the other layers and corresponding grid samples, the CV indicates high data variability (C.V.> 60%).
According to Pearson's asymmetry coefficient, which refers to the tendency of normal distribution of the data when their numerical values approach to zero (Table 2), the symmetric distribution of the data (| As | <0.15) is verified for the layer of 0.0-0.10 m with the sample grid of 60 x 60 m. When the asymmetry coefficient approaches zero, the greater the probability of accepting the hypothesis that the data meet the normal distribution. In the other layers and grid samples, the data showed itself asymmetrically (| As |> 0.15), with its distribution curve being classified as moderate asymmetric (0.15 <| As | <1) in the layer 0,40 -0.50 m in the sample grid of 40 x 40 m and as strong asymmetric in the other layers and corresponding grid samples.
0 0.1 0.2 0.3 0.4 0.5 0 1 2 3 4 5 6 L a y e rs , m
Soil penetration resistance, MPa
Table 2. Descriptive statistics for RP (MPa) on 20 x 20, 40 x 40 and 60 x 60 m grid sample
Descriptive statistics Soil layers (m)
0.00 - 0.10 0.10 - 0.20 0.20 - 0.30 0.30 - 0.40 0.40 - 0.50 Grid sample 20 x 20 m Standard deviation 1.02 4.44 3.95 3.09 1.99 Variance 1.05 19.78 15.65 9.57 3.99 CV (%) 64.19 107.14 85.53 74.45 65.53 Asymmetry (As) 3.61 5.27 3.71 3.3 3.91 Kurtosis (k) 18.16 39.68 18.84 14.48 20.56 Normality 0.85 0.76 0.80 0.82 0.81 Probability <0.01** <0.01** <0.01** <0.01** <0.01** Grid sample 40 x 40 m Standard deviation 0.88 2.25 2.38 1.61 0.86 Variance 0.79 5.06 5.66 2.61 0.74 CV (%) 58.32 73.11 63.92 49.67 31.97 Asymmetry (As) 2.47 2.22 2.83 1.55 0.41 Kurtosis (k) 7.73 5.74 10.70 3.14 0.44 Normality 0.90 0.88 0.85 0.94 0.99 Probability <0.01** <0.01** <0.01** <0.01** >0.10* Grid sample 60 x 60 m Standard deviation 1.29 2.94 2.96 1.50 0.85 Variance 1.67 8.66 8.74 2.26 0.73 CV (%) 59.00 56.47 60.44 41.35 35.28 Asymmetry (As) 1.48 0.05 5.31 5.59 1.55 Kurtosis (k) 1.40 0.50 2.08 2.01 0.33 Normality 0.97 0.99 0.89 0.09 0.99 Probability 0.021** > 0.10* <0.01** <0.01** >0.10*
*: Normal distribution by the Ryan-Joiner test. **: non-normal distribution by Ryan-Joiner test. CV: coefficient of variation.
The kurtosis coefficient (Table 2), which indicates the degree of flatness of the data distribution curve, tends to be normal in the 0.40-0.50 m layer, the 40 x 40 m of the sampling grid, and in the
0.10-287 0.20 and 0.40-0.50 m in the grid sample of 60 x 60 m. In the other layers, the data did not follow a normal distribution tendency.
The Ryan-Joner Normality Test calculates the correlation coefficient between the data placed in an orderly model on a normal probability plot relative to the percentage points from the standard normal distribution. Thus, it can be verified with the test that the normality of the data (Table 2) is accepted for the layer 0.40 – 0.50 m of the sampling grid of 40 x 40 m, and in the layers 0,10-0,20 and 0.40-0.50 m of the 60 x 60 m sampling grids, as observed by the kurtosis coefficient. The other layers do not present a tendency to normality by the Ryan-Joner test. When the data distribution is not normal, their mean values are not representative, which shows the importance of geostatistics in the comprehension of PR spatialization.
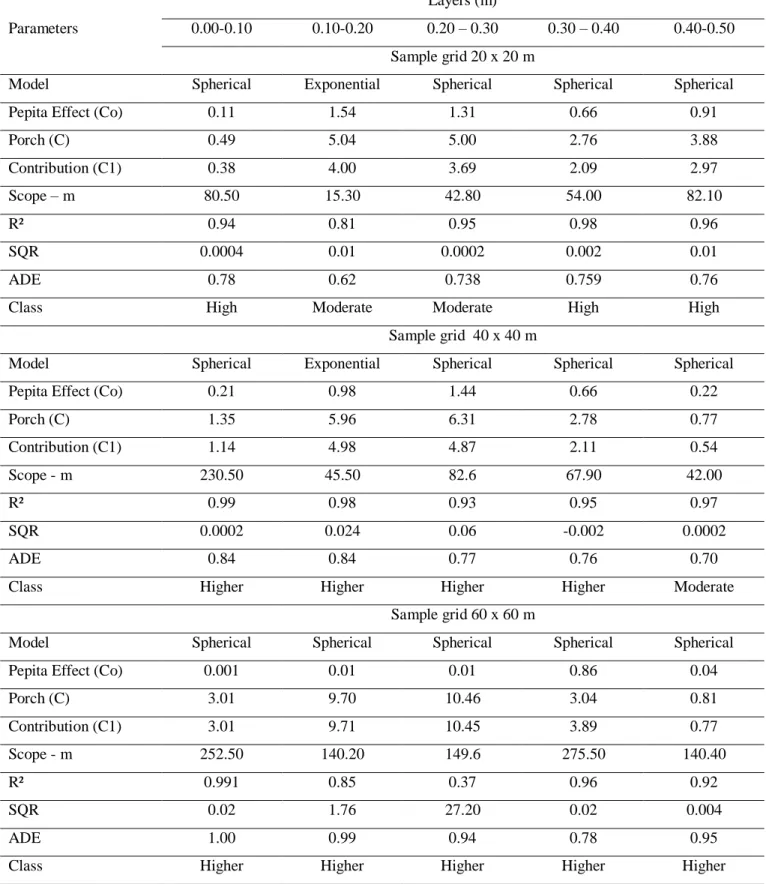
Nevertheless, it was verified that the semivariogram adjustments (Table 3) met the spherical and exponential models for PR, with a degree of spatial dependence (ADE) classified as moderate and strong (CAMBARDELLA et al., 1994). The range (a) of the semivariograms, which suggests the spatial dependence of PR, was varying in both layers and sample meshes, with high range indexes. Coelho et al. (2012) explained that this range variation for PR in the Vertisoils could be related to the management issues applied to the soil, as well as the quantity and distribution of the samples in the field.
For the 20 x 20 m sampling grid, the minimum range reached was 15, 30 m in the 0.10 0.20 m layer, in the 40 x 40 sampling grids was 42 m, in the 0.40-0.50 layer, 50 m, while in the 60 x 60 m sampling grid, it was 140.20 m in the 0.10-0.20 m layer (same layer of the minimum reach for the 20 x 20 m grid sample). Therefore, the application of statistical methods that consider the samples to be random and independent should not be performed at smaller distances than the range found (ANDRIOTTI, 2003).
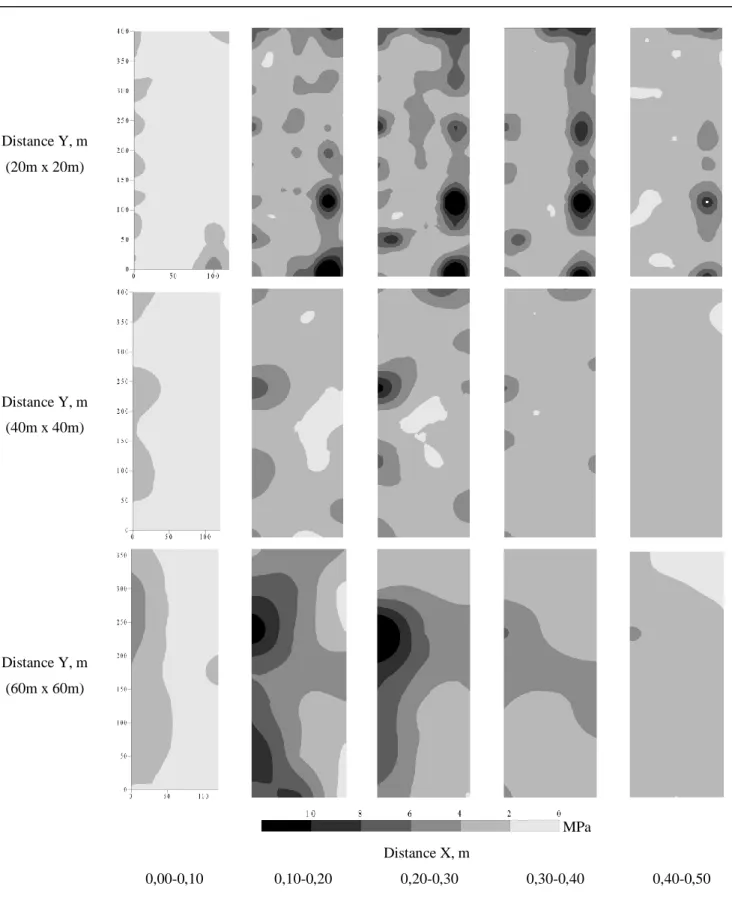
From the maps obtained with the geostatistical analysis (Figure 2), it can be verified that an increase of areas with higher concentration of RP occurs as the depth increases, being observed higher values of RP in the layers of 0.10-0, 20 and 0.20-0.30 m for the different sampling grids.
As moisture content was constant along the soil profile, the variation of PR between the layers, is probably, due to the management in the area, to the accumulation of pressures in the soil through the traffic of machines, and to the gradual reduction of the amount of organic matter and of the biological activity that probably occurs with increasing depth (BRAIDA et al., 2010; MARCHÃO et al., 2007).
Table 3. Penetration resistance-adjusted semivariograms (MPa) in 20 x 20 m sample meshes; 40 x 40
m and 60 x 60 m. (Petrolina - PE, 2012)
Parameters
Layers (m)
0.00-0.10 0.10-0.20 0.20 – 0.30 0.30 – 0.40 0.40-0.50 Sample grid 20 x 20 m
Model Spherical Exponential Spherical Spherical Spherical
Pepita Effect (Co) 0.11 1.54 1.31 0.66 0.91
Porch (C) 0.49 5.04 5.00 2.76 3.88 Contribution (C1) 0.38 4.00 3.69 2.09 2.97 Scope – m 80.50 15.30 42.80 54.00 82.10 R² 0.94 0.81 0.95 0.98 0.96 SQR 0.0004 0.01 0.0002 0.002 0.01 ADE 0.78 0.62 0.738 0.759 0.76
Class High Moderate Moderate High High
Sample grid 40 x 40 m
Model Spherical Exponential Spherical Spherical Spherical
Pepita Effect (Co) 0.21 0.98 1.44 0.66 0.22
Porch (C) 1.35 5.96 6.31 2.78 0.77 Contribution (C1) 1.14 4.98 4.87 2.11 0.54 Scope - m 230.50 45.50 82.6 67.90 42.00 R² 0.99 0.98 0.93 0.95 0.97 SQR 0.0002 0.024 0.06 -0.002 0.0002 ADE 0.84 0.84 0.77 0.76 0.70
Class Higher Higher Higher Higher Moderate
Sample grid 60 x 60 m
Model Spherical Spherical Spherical Spherical Spherical
Pepita Effect (Co) 0.001 0.01 0.01 0.86 0.04
Porch (C) 3.01 9.70 10.46 3.04 0.81 Contribution (C1) 3.01 9.71 10.45 3.89 0.77 Scope - m 252.50 140.20 149.6 275.50 140.40 R² 0.991 0.85 0.37 0.96 0.92 SQR 0.02 1.76 27.20 0.02 0.004 ADE 1.00 0.99 0.94 0.78 0.95
289 Distance Y, m (20m x 20m) Distance Y, m (40m x 40m) Distance Y, m (60m x 60m) MPa Distance X, m 0,00-0,10 0,10-0,20 0,20-0,30 0,30-0,40 0,40-0,50 Figure 2. Spatialization of penetration resistance in the layers of 0.00-0.10; 0.10-0.20, 0.20-0.30,
0.30-0.40 and 0.30-0.40-0.50 m and 20 x 20, 40 x 40 and 60 x 60 m sampling grid (Petrolina - PE, 2012)
The lowest PR values in the superficial layer (0.00-0.10 m) are probably related to the system and the management practices adopted in the area. Since this area has been cultivated with elephant grass for some years without periodic crop rotation it is suggested that structural modifications resulting from the mechanical action produced by plant roots, edaphic fauna (biopores) and the constant deposition of organic matter (cattle manure and / or sheep) may lead to the occurrence of lower RP indexes in this layer.
For soils with a sandy texture, the critical value for PR is between 6.0 and 7.0 MPa (SENE et al., 1985), because above this, root growth can be limited, besides causing problems of aeration and water availability to plants, reduction of yields. However, it was observed that PR levels are different and higher than the critical value range in the area (Figure 2 and Table 4), justifying in some subregions a temporal monitoring of RP and a possible mechanical intervention.
The percentages of area occupied by different PR ranges (0-2, 2-4, 4-6, 6-8, 8-10, and> 10) in the 20 x 20 and 40 x 40 m grid samples (Table 4) presented a correlation between them relating to the PR limits and their proportion (%), when compared to the same layer in the sampling grid. Furthermore, as for the grid sample of 60 x 60 m, the limits and proportions of PR differed considerably from the other sampling grids. According to Cherubin et al. (2011), the larger the sample size, the lower the information quality, what makes, the results become less accurate, which may make it difficult to interpret and / or define compacted areas.
It is also verified that the highest RP percentages are between 2 and 4 MPa; mainly from the 0.10 to 0.50 m layers in all sampling grids, confirming the information in Figures 1 and 2. The visualization of the proportion of the extreme PR indexes in each sampling grid also serves to assist the management of more targeted soil and the specificity of the agricultural practice to be adopted for the target area.
According to Oliver et al. (1989), the estimation of the data variance when the support is small is susceptible to errors and its accuracy is decreased. The same authors recommend a minimum of 100 comparisons and, following the practice in time series analysis, suggest that estimations should be made at a distance no greater than 1/5 of the entire transect for a dimension. In general, nearby sampling points have large weights, while in the furthest distances spatial dependence was reduced or was no longer existing (VIEIRA et al., 2002; LIMA et al., 2006). The larger the sample, and the shorter the interval, the better the semivariance estimate.
291
Table 4. Percentage of the area occupied accoring to the levels of resistance to penetration in the layers
of 0.00-0.10; 0.10-0.20, 0.20-0.30, 0.30-0.40 and 0.40-0.50 m and 20 x 20, 40 x 40 and 60 x 60 m sampling grids. (Petrolina - PE, 2012)
RP (MPa) Layers (m) 0.00-0.10 0.10-0.20 0.20-0.30 0.30-0.40 0.40-0.50 Grid sample 20 x 20 m 0-2 84.94 0.69 0.29 0.30 5.88 2-4 14.41 61.12 53.05 63.10 79.14 4-6 0.65 27.47 29.00 21.06 12.44 6-8 0.00 6.93 11.28 10.88 2.05 8-10 0.00 1.71 3.51 3.16 0.50 > 10 0.00 2.08 2.86 1.50 0.00 Grid 40 x 40 m 0-2 88.34 11.63 5.84 0.11 1.28 2-4 11.66 75.80 73.79 94.84 98.72 4-6 0.00 11.39 16.44 4.99 0.00 6-8 0.00 1.18 2.90 0.06 0.00 8-10 0.00 0.00 0.86 0.00 0.00 > 10 0.00 0.00 0.18 0.00 0.00 Grid 60 x 60 m 0-2 60.22 3.39 0.09 0.00 10.72 2-4 35.19 25.29 43.47 72.14 88.70 4-6 4.59 38.14 31.91 27.69 0.58 6-8 0.00 22.32 15.88 0.17 0.00 8-10 0.00 9.49 4.98 0.00 0.00 > 10 0.00 1.38 3.67 0.00 0.00 CONCLUSIONS
The RP analysis through semivariograms showed spatial dependence in all studied layers and sampling grids. Moreover, in all layers showed higher and moderate spatial dependencies. The highest
values of resistance to penetration (RP) occurred from the 0.10 to 0.30 m layers, leading to infer that in the analysis of one RP must consider the spatial distribution of the attribute through geostatistics.
The sampling grid of 20 x 20 m allowed to characterize the soil with higherr detail in the information and accuracy of the results.
ACKNOWLEDGEMENTS
To the Foundation for Support to Science and Technology of the State of Pernambuco (FACEPE) for the grant of the first author. To the CNPq - National Council of Scientific and Technological Development.
REFERENCES
AMADO, T. J. C.; PES, L. Z.; LEMAINSKI, C. L.; SCHENATO, R. B. 2009. Atributos químicos e físicos de Latossolos e sua relação com os rendimentos de milho e feijão irrigados. Revista
Brasileira de Ciência do Solo, Viçosa, v.33, p.831-843.
AMARAL, F. C. S.; SILVA, E. F.; MELO, A. S. 2006. Caracterização pedológica e estudos de
infiltração da água no solo em perímetros irrigados no Vale do São Francisco, Rio de Janeiro:
Embrapa Solos, 1th ed. 104p.
AMARO FILHO, J.; ASSIS JÚNIOR, R. N.; MOTA, J. C. A. 2008. Física do solo: Conceitos e
aplicações. Fortaleza: Imprensa Universitária, 1th ed. 290p.
ANDRIOTTI, J.L.S. 2003. Fundamentos de Estatística e Geoestatística, São Leopoldo: Editora, 1th ed. 165p.
BOTTEGA, L. E.; BOTTEGA, S. P.; SILVA, S. A.; QUEIROZ, D. M.; SOUZA, C. M. A.; RAFULL, L. Z. L. 2011. Variabilidade espacial da resistência do solo à penetração em um Latossolo Vermelho distroférrico. Revista Brasileira de Ciências Agrárias, Recife, v. 6, n.2, p. 331-3361.
BRAIDA, J. A.; REICHERT, J. M.; REINERT, D. J.; VEIGA, M. 2010. Teor de carbono orgânico e a susceptibilidade à compactação de um Nitossolo e Argissolo. Revista Brasileira de Engenharia
Agrícola e Ambiental, v.14, p.131-139.
CAMBARDELLA, C. A.; MOORMAN, T. B.; NOVAK, J. M.; PARKIN, T. B.; KARLEN, D. L.; TURCO, R. F.; KONOPKA, A. E. 1994. Field scale variability of soil properties in Central Iowa soils. Soil Science Society American Journal, Iowa, v. 58, n. 5, p. 1501-1511.
CARVALHO, J. R. P.; DECHENS, S. C. F.; DUFRANC, G. 2004. Variabilidade espacial da agregação do solo avaliada pela geometria fractal e geoestatística. Revista Brasileira de Ciência do Solo, Viçosa, v. 28, n.1, p. 1-9.
CARVALHO, L. A.; NETO, V. J. M.; SILVA, L. F.; PEREIRA, J. G.; NUNES, W. A. G. A.; CHAVES, C. H. C. 2008. Resistência mecânica do solo à penetração (RMP) sob cultivo de cana-de-açúcar, no município de Rio Brilhante-MS. Agrarian, Dourados, v. 1, n. 2, p. 7-22.
CHERUBIN, M. R.; SANTI, A. L.; BASSO, C. J.; EITELWEIN, M. T.; VIAN, A. L. 2011. Caracterização e estratégias de manejo da variabilidade espacial dos atributos químicos do solo utilizando a análise dos componentes principais. Enciclopédia Biosfera, Goiânia, v. 7, n. 13, p. 196-210.
293 COELHO, D. S.; CORTEZ. J. W.; OLSZEVSKI, N. 2012. Variabilidade espacial da resistência mecânica à penetração em Vertissolo cultivado com manga no perímetro irrigado de Mandacaru, Juazeiro, Bahia, Brasil. Revista Brasileira de Ciência do Solo, Viçosa, v. 36, n. 3, p. 755-763. FREDDI, O. S.; CENTURION, J. F.; DUARTE, A. P.; PERES, F. S. C. 2009. Compactação do solo e
produção de cultivares de milho em Latossolo Vermelho. II – Intervalo hídrico ótimo e sistema radicular. Revista Brasileira de Ciência do Solo, Viçosa, v. 33, n. 4, p. 805-818.
GREGO, C. R.; VIEIRA, S. R. 2005. Variabilidade espacial de propriedades físicas do solo em uma parcela experimental. Revista Brasileira de Ciência do Solo, Viçosa, v. 29, n. 2, p. 169-177.
JOURNEL, A. G.; HUIBJERTS, C. J. 1991. Mining geoestatistics. London: Academic Press, 1th ed. 600p.
LANDIM, P. M. B.; STURARO, J. R. 2002. Krigagem indicativa aplicada à elaboração de mapas
probabilísticos de riscos. DGA, IGCE, UNESP/Rio Claro, Lab. Geomatemática, Texto Didático
06.19p.
LIMA, J. S. S.; SILVA, J. T. O.; OLIVEIRA, R. B.; ALMEIDA, V. S.; VANZO, F. L. 2006. Estudo da viabilidade de métodos geoestatísticos na mensuração da variabilidade espacial da dureza da madeira de paraju (Manilkarasp). Revista Árvore, Viçosa, v. 30, n. 4, p. 651-657.
MARASCA, I.; OLIVEIRA, C. A. A.; GUIMARÃES, E. C.; CUNHA, J. P. A. R.; ASSIS, R. L.; PERIN, A.; MENEZES, L. A. S. 2011. Variabilidade espacial da resistência do solo à penetração e o teor de água em sistema de plantio direto na cultura da soja. Bioscience. Journal, Uberlândia, v. 27, n. 2, p. 239-246.
MERCANTE, E.; URIBE-OPAZO, M. A.; SOUZA, E. G. 2003. Variabilidade espacial e temporal da resistência mecânica do solo à penetração em áreas com e sem manejo químico localizado. Revista
Brasileira de Ciência do Solo, Viçosa, v. 27, n. 6, p. 1149-1159.
MONTANARI, R.; SOUZA, G.S.A.; PEREIRA, G.T.; MARQUES JUNIOR, J.; SIQUEIRA, D.S.; SIQUEIRA, G.M. 2012. The use of scaled semivariograms to plan soil sampling in sugarcane fields.
Precision Agriculture, v.13, p.542-552.
OLIVER, M.; WEBSTER, R.; GERRARD, J. 1989. Geostatistics in Physical Geography. Part I: Theory. Transactions of the Institute of British Geographers, Birmingham, v. 14, n. 3, p. 259-269.
REICHERT, J.M.; BERVALD, C.M.P.; RODRIGUES, M.F.; KATO, O.R.; REINERT, D.J. 2014. Mechanized land preparation in eastern Amazon in fire-free forest-based fallow systems as alternatives to slash-and-burn practices: Hydraulic and mechanical soil properties. Agriculture, Ecosystems & Environment, v. 192, p. 47-60.
REICHERT, J.M.; RODRIGUES, M.F.; BERVALD, C.M.P.; BRUNETTO, G.; KATO, O.R.; SCHUMACHER, M.V. 2014b. Fragmentation, fiber separation, decomposition, and nutrient release of secondary-forest biomass, mechanically chopped-and-mulched, and cassava production in the Amazon.. Agriculture, Ecosystems & Environment, v. 204, p. 8-16.
REICHERT, J.M.; RODRIGUES, M.F.; BERVALD, C.M.P.; KATO, O.R. 2016. Fire-free fallow management by mechanized chopping of biomass for sustainable agriculture in eastern Amazon: Effects on soil compactness, porosity, and water retention and availability. Land Degradation & Development, v. 27, p. 1403-1412.
SANTOS, K. S.; MONTENEGRO, A. A. A.; ALMEIDA, B. G.; MONTENEGRO, S. M. G. L.; ANDRADE, T. S.; FONTES JUNIOR, V. P. 2012. Variabilidade espacial de atributos físicos em solos de vale aluvial no semiárido de Pernambuco. Revista Brasileira de Engenharia Agrícola e
SENE, M.; VEPRASKAS, M. J.; NADERMAN, G. C.; DENTON, H. P. 1985. Relationship of soil texture and structure to corn yield response to subsoiling. Soil Science Society American Journal, Iowa, v. 49, n. 2, p. 422-427.
SOIL SURVEY STAFF. 2014. Keys to soil taxonomy. 12. ed. Washington, DC: USDA-Natural Resources Conservation Service.
STEPIEN, M.; GOZDOWSKI, D.; SAMBORSKI, S. 2013. A case study on the estimation accuracy of soil properties and fertilizer rates for different soil-sampling grids. Journal of Plant Nutrition and
Soil Science, v.176, p.57-68.
STOLF, R. 1991. Teoria e teste experimental de fórmulas de transformação dos dados de penetrômetro de impacto em resistência do solo. Revista Brasileira de Ciência do Solo. Viçosa, v. 15, p. 229-235.
TAVARES FILHO, J.; RIBON, A. A. 2008. Resistência do solo à penetração em resposta ao número de amostras e tipo de amostragem. Revista Brasileira de Ciência do Solo, Viçosa, v. 32, n. 2, p. 487-494.
VIEIRA, S. R.; MILLETE, J.; TOPP, G. C.; REYNOLDS, W. D. 2002. Handbook for geoestatistical
analysis of variability in soil and climate data. In: ALVAREZ, V. V. H.; SCHAEFER, C. E. G.
R.; BARROS, N. F.; MELLO, J. W. V.; COSTA, J. M., eds. Tópicos em Ciência do Solo, v. 2, p. 1-45.
WARRICK, A. W.; NIELSEN, D. R. 1980. Spatial variability of soil physical properties in the
field. In: HILLEL, D., ed. Applications of soil physics. New York, Academic Press, p. 319-344.
YAMAMOTO, J. K.; LANDIM, P. M. B. Geoestatística: conceitos + aplicações. São Paulo: oficina de textos, 2013. 216 p.
Received in March 30, 2015 Accepted in November 23, 2017