OCTOBER
2015
M
ASTER IN
FINANCE
MASTERS
FINAL
PROJECT
D
ISSERTATION
THE PERFORMANCE OF
F
EMALE
E
NTREPRENEURS IN
P
ORTUGAL
2
M
ASTER IN
FINANCE
MASTERS
FINAL
PROJECT
D
ISSERTATION
THE PERFORMANCE OF
F
EMALE
E
NTREPRENEURS IN
P
ORTUGAL
MARGARIDA FREITAS
GUIDANCE
:
PROFESSORA DOUTORA ANA ISABEL ORTEGA VENÂNCIO
3
Abstract
This study analyzes the performance of Portuguese female entrepreneurs. We evaluate
performance in terms of firms initial size, survival and growth. We use an employer–
employee dataset (QP – “Quadros de Pessoal”), to evaluate start-ups established by a
sole entrepreneur, who were working in the previous period and exclude start-ups which
we could not identify at least one owner or their background.
Our major findings are female entrepreneurs are less likely to possess larger start-ups,
these firms have lower survival in the first years and fewer chances of growing when
compared with male entrepreneurs.
JEL Classification: G32, L26, M13
Keywords: Female Entrepreneurship; Initial Size; Survival; Growth; Performance;
4
Resumo
Este estudo analisa o desempenho das mulheres empreendedoras Portuguesas. Nós
concentramo-nos especificamente em avaliar o desempenho em termos de dimensão
inicial da start-up, na sua sobrevivência e no seu crescimento. Foi usada uma base de
dados empregador-empregado (QP - "Quadros de Pessoal"), para avaliar start-ups
estabelecidas por um único empreendedor, e com atividade decorrente no período
anterior. Foram excluídas start-ups às quais não poderia ser identificado pelo menos um
fundador ou as informações inerentes a anos anteriores.
A nossa principal conclusão é que as mulheres empreendedoras são menos propensas a
possuir grandes start-ups, têm menor sobrevivência nos primeiros anos de atividade e
têm menos crescimento quando comparadas com homens empreendedores.
Classificação JEL: G32, L26, M13
Palavras-chave: Empreendedorismo Feminino; Dimensão inicial; Sobrevivência;
5
Acknowledgements
After this long process, I would like to thank my family and friends for the daily support
and encouragement during this last year, for their faith in me, their patience and
tolerance in my days in bad mood. Without your efforts, none of this would be possible.
To my parents, I am deeply grateful for all your love, support, motivation and
encouragement throughout my entire life.
To Professor Ana Venâncio, my deep gratitude for the guidance, patience and support
along my dissertation period and for raising this work with her knowledge and
experience.
Finally, I would like to thank the Portuguese Ministry of Employment and Social
Security and Gabinete de Estratégia e Planeamento (GEP) for giving me access to the
matched employer-employee data. All errors remain my own. Views expressed are
those of the author and do not necessarily reflect those of any branch or agency of the
Government of Portugal. Financial support was provided by the Fundação para a
Ciência e a Tecnologia (Portuguese Foundation for Science and Technology) through
6
Table of Contents
1. Introduction ... 10
2. Literature Review and Hypothesis ... 13
2.1. Determinants of Female Entrepreneurial Activity ... 13
2.2. Start-ups Performance of Female Entrepreneurs ... 15
3. Data and Descriptive Statistics ... 18
3.1. Data ... 18
3.2. Sample ... 18
3.3. Descriptive Statistics ... 19
4. Methodological Approach and Results ... 21
4.1. Size ... 21
4.2. Survival ... 23
4.3. Growth ... 27
5. Conclusion ... 29
6. References ... 31
7. Tables ... 43
8. Appendix ... 54
7
List of Tables
Table 1: Literature Review Summary ... 43
Table 2: Description of the Variables ... 47
Table 3: Descriptive Statistics ... 48
Table 4: OLS Model for the Firm’s Initial Size ... 50
Table 5: Logit Model for Firm’s Survival ... 51
Table 6: Cox Proportional Hazard Model for Firm’s Survival ... 52
8
Appendix
Table A.1: Probit Model for Firm’s Survival ... 54
Table A.2: OLS Model for the Firm’s Survival ... 55
Table A.3: OLS Model for the Firm’s Initial Size (with EPH) ... 56
Table A.4: Logit Model for Firm’s Survival (with EPH) ... 57
Table A.5: Probit Model for Firm’s Survival (with EPH) ... 58
Table A.6: OLS Model for the Firm’s Survival (with EPH) ... 59
Table A.7: Cox Proportional Hazard Model for Firm’s Survival (with EPH) ... 60
9
List of Abbreviations
CAE.Rev2.1 Portuguese Classification of Economic Activities, Revision 2
LPM Linear Probability Model
NUTS II Nomenclature of Territorial Units for Statistics 2
QP Quadro de Pessoal
R. A. Autonomous Region
10
1.
Introduction
Previous literature suggests that female individuals suffer from gender differences, and
lack of representation in top firms (Parker, 2009; Flabbi et al, 2014). Female
entrepreneurship is viewed as a solution to overcome their lack of power in the society.
The females in entrepreneurship are still an understudied topic in the literature,
especially concerning the entry determinants. Nevertheless, in the past years, the
numbers of studies have increased, and they suggest that having children and being
divorced forces female individuals to look for employment (Birley, 1989; Fetsch, 2015).
Other studies suggest that entrepreneurship becomes attractive to female individuals
because of the opportunity to achieve material and personal success, independence and
to avoid barriers currently faced by females in large organizations (Goffee and Scase,
1987).
Despite the lack of studies, female entrepreneurs assume nowadays an important role in
our society, as their numbers have increased in the last years. Devine (1994b) finds that
the number of self-employed females doubled since 1975 until 1990, and their rate
increased by more than 67 percent. Nevertheless, this increase is smaller in comparison
to men entrepreneurs (Aronson, 1991; Devine, 1994a; Fairlie and Woodruff, 2007).
Also, Brush (2006) finds that female entrepreneurs have grown in a number of
countries. For instance, 5.3 million start-ups in the United States are owned by females.
According to the Global Entrepreneurship Monitor (GEM) in 2012, 126 million females
were active entrepreneurs and 78 percent were running established businesses in 67
countries (GEM, 2012).
Female entrepreneurs face distinct opportunities and constraints from male
11
entrepreneurship. Their main constraints are discrimination at the top levels (“glass
ceiling”)1 (Devine, 1994a), possession of a child (Wellington, 2006) and lack of
financial funds to start their business (Malewicki & Leitch, 2012). Other challenges for
women-owned entrepreneurs include: lack of mentors (Heilman & Chen, 2003) and
perception on success and failure (Parker, 2009). To overcome these constraints and
challenges, countries around the world have expanded programs geared towards
external financing access, but also, towards the creation of networks2 to encourage
women entrepreneurs (Fetsch, 2015). These constraints also affect the performance of
their start-ups.
In this study, we focus on the performance of female entrepreneurs and we evaluate
performance in terms of initial size, survival and growth by comparing them to male
entrepreneurs. More specifically, our research questions are: Do female entrepreneurs
perform better than male entrepreneurs? Which factors are more likely to affect female
entrepreneurs?
To answer these research questions we use a matched employer–employee dataset (QP
– “Quadros de Pessoal”). Our data provides detailed information on the founders and
start-ups in the Portuguese private sector between 1986 and 2012. The data also include
detailed information on the characteristics of the founders demographic, educational and
start-ups initial conditions. Also, it allows us to match founders with their ventures
characteristics.
The empirical results suggest that female entrepreneurs underperform in comparison to
male entrepreneurs. Female individuals are less likely to possess larger firms, have
12
fewer chances to survive the first 4 years, and their start-ups have fewer chances of
growing when compared to start-ups established by male entrepreneurs.
Our study has important policy implications. Women-owned businesses contribute for
economic development namely by creating jobs and contributing to the economic
growth. Understanding which factors affect growth and survival are useful to develop
better policies towards female entrepreneurs.
This study is organized as follows: Section II reviews the main literature on female
entrepreneurship and presents the hypothesis to test in this study; Section III exhibits the
data and descriptive statistics; Section IV presents the methodology and results of the
13
2.
Literature Review and Hypothesis
In this section, we review the previous literature concerning the determinants of female
entrepreneurship and their performance. We will start by making a brief description of
the main characteristics that motivate female individuals to transition into
entrepreneurship. This section is going to focus in two parts: human capital and family
factors. The following section clarifies the different aspects of start-ups performance,
focusing on the start-ups initial size, survival and growth.
2.1. Determinants of Female Entrepreneurial Activity
According to previous literature the main determinants of female entrepreneurial
activity are human capital (age, past experience and years of education) and family
factors (marriage and possession of children). This section allows us to understand the
reality of female entrepreneurs, and their reasons and concerns inherent to this choice.
Previous literature shows that age is a powerful determinant of self-employment status.
Older workers, to a certain point, are more likely to switch from wage-employment to
self-employment (Bates, 1995; Carr, 1996; Boden, 1996; Schiller and Crewson, 1997;
Thébaud, 2010).
Previous studies consider that human capital has a positive relation to entrepreneurship
transition (Davidsson and Benson, 2003). Becker (2009) states human capital can be
divided into two categories: general human capital and specific human capital. The first
is a generic knowledge or skill that is not particular to a certain task or company, which
can be accumulated through education and experience; and the second, is associated to
the individuals professional and training experience in areas related to his activity.
Researchers suggest higher levels of education and experience increase the likelihood of
14
achieve success (Schiller and Crewson, 1997; Clain, 2000; Taniguchi, 2002; Coleman,
2007; Thébaud, 2010).
Regarding family factors, previous studies show that being married and raising children
are both positively and strongly associated with self-employed females. Women with
non-professional jobs and family commitments are more likely to transition to
entrepreneurship (Carr, 1996; Bruce, 1999; Clain, 2000; Budig, 2006). Self-employed
married woman choose entrepreneurship because they need to balance work and family
commitments (Devine, 1994b; Boden, 1996; 1999; Carr, 1996; Mirchandani, 1999;
Lombard, 2001; Edwards and Field-Hendrey, 2002; Fairlie, 2007; Parker, 2009). Also,
Parker (2009) believes self-employment is associated with marriage due to the “fact that
husbands systematically contribute less to household production than females, even
when the women is working, and whether or not they are engaged in paid employment
or entrepreneurship” (Parker, 2009, p. 187). With limited time to spend in work,
part-time entrepreneurship seems an attractive choice to married women giving them
flexibility to balance work and home commitments.
McDermott (1985) finds that having a child is a distinct factor on female entrepreneurs.
Entrepreneurship is attractive to females because offers a flexible way of combining
work and domestically provide childcare (Parker, 2009). “Time spent in home-based
work may have a non-monetary benefit, such as being able to spend more time with
one’s children” (Edwards and Field-Hendrey, 2002, p. 172; Parker, 2009, p. 188). Each
additional child increases the probability of females choosing self-employment in
non-professional occupations (Connely, 1992; Edwards and Field-Hendrey, 1996; Boden,
1999; Caputo and Dolinsky, 1998; Budig, 2006). Having a child under six years old has
the greatest impact on the probability that females are self-employed, especially among
15
Table 1, further summarizes empirical evidence regarding the determinants of female
entrepreneurial activity.
2.2. Start-ups Performance of Female Entrepreneurs
Some authors suggest that start-ups established by both men and women have a similar
performance, using ROA and ROE (Watson, 2002; Watson and Robinson, 2003). In
contrast, others find that start-ups established by female entrepreneurs have slower
growth (Sexton and Robinson, 1989; Fischer et al, 1993; Srinivasan et al, 1994;
DuReitz and Henrekson, 2000; Minniti et al, 2005; Coleman, 2007), are less profitable
(Robb and Wolken, 2002), have lower sales turnover (Chaganti and Parasuraman,
1996), lower employment creation, fewer survival prospects and less income in
comparison to male entrepreneurs even when those firms are established in the
same-industry (Parker, 2009).
Some researches support female entrepreneurs prefer slower growth ventures because of
the risks associated with fast-paced growth strategies (Chaganti and Parasuraman,
1996). Other reasons include “maximum business-size threshold”, an optimal size
beyond which an entrepreneur would prefer not to expand (Cliff, 1998); adverse interest
for growth; exchange of growth for other valued business objectives (quality for
instance); absence of interest in the business; discrimination (struggle against
well-established male-dominated structure of customers, suppliers, and creditors) and
shortfall networks (Cliff, 1998; Weiler and Bernasek, 2001; Malewicki and Leitch,
2012).
Human capital influences the performance differences between male and female owned
businesses (Schiller and Crewson, 1997; Coleman, 2007; Unger et al 2008). Education
and work experience are the main drivers of profitability for female-owned businesses,
16
But as Chandler and Hanks, (1998) suggest human and financial capital are substitutes
for each other. Previous literature show female entrepreneurs have on average less years
of experience than men entrepreneurs (Loscocco et al, 1991) in either entrepreneurship
or paid employment (Aronson, 1991; Lee and Rendall, 2001).
Restricted access to capital limits growth and affects survival prospects of ventures
(Parker, 2009). Although both genders use the same sources of finance3, the amount of
credit that females receive from external sources is considerably smaller. This lack of
funding is also considered a form of discrimination (Read, 1994; Fabowale et al, 1995;
Coleman, 2000; Hokkanen, 1998; Fetsch, 2015). However, some authors, argue that
lenders discrimination is an assumption owed to limited industry knowledge and
experience (Brush et al, 2006). For others, is a result of the perception of fewer
characteristics that females own towards business success (Buttner and Rosen, 1988).
Because of their wish to run smaller businesses, female entrepreneurs prefer to use less
formal and informal equity finance than men entrepreneurs (Parker, 2009). Therefore, a
female establishes smaller firms because of lifestyle reasons, risk-aversion and absence
of financially awareness (Carter and Rosa, 1998).
Mentoring and network support are a boost for women attitudes with respect to venture
creation (Minniti et al, 2005; Fetsch, 2015), source of innovation and a facilitator of
opportunity recognition nevertheless, female entrepreneurs lack network ties compared
to men (Aldrich, 1989; Moore and Buttner, 1997; Aldrich et al, 2002; Brush, 2006).
Females start a business because of personal interests, a desire for self-fulfilment, job
satisfaction (Jurik, 1998), family considerations and flexibility of work schedules
especially with young children (Boden, 1999a). Thus, females earn less than males
because they spend less time managing and developing their businesses (Hundley,
17
2001a; Parker, 2009). In the end, this also affects start-ups performance in terms of
survival and growth.
There is evidence of gender segregation by industry and especially by occupation
(Hundley, 2001a; Weeden, 2004), these features persist as they create low profitable
ventures in female-dominated industries (Loscocco et al, 1991; Loscocco and Robinson,
1991; Brush, 1992). Start-ups of female entrepreneurs are small, consumer-oriented and
involved in traditional sector, they have lower business survival rates and fewer market
growth opportunities (Hundley, 2001a; Minniti et al, 2005), while male entrepreneurs
work in high-paying sectors, including executive, administrative, managerial and
precision artisan jobs (Hundley, 2001a)4. If size and sector of the start-up are
considered, women failure5 rates are very similar to those of men (Kalleberg and Leicht,
1991; Perry, 2002; Kepler and Shane, 2007). Therefore, it may be optimal for both
credit institutions and entrepreneurs to start with less capital (Orser et al, 2006; Parker,
2009). Thus, we expect that female entrepreneurs perform less than men in terms of
initial size, survival and growth.
Hypothesis 1: Start-ups established by female entrepreneurs are smaller than start-ups
established by male entrepreneurs.
Hypothesis 2: Start-ups established by female entrepreneurs are less likely to survive
than start-ups established by male entrepreneurs.
Hypothesis 3: Start-ups established by female entrepreneurs are less likely to grow.
4 These results were collected from the 34 nations (Argentina; Ecuador; Brazil; Jordan; Croatia; Peru;
Hungary; Poland; South Africa; Uganda; Greece; Hong Kong; Portugal; Israel; New Zealand; Singapore; Slovenia; Spain; Belgium; Australia; Italy; Denmark; Canada; Sweden; Finland; Iceland; France; Norway; Germany; Ireland; Japan; Netherlands; UK; USA) participating in the special topic report from the GEM in 2004.
18
3.
Data and Descriptive Statistics
3.1. Data
Our data come from a matched employer–employee dataset (QP - “Quadros de
Pessoal”).
QP is a mandatory survey submitted annually to the Portuguese Ministry of
Employment and Social Security by start-ups with at minimum one employee. This
database contains detailed information on more than 220,000 start-ups and 2 million
individuals per year, which basically covers all Portuguese private sector from period of
1986 to 2012. Annually, each firm reports: year of creation, geographic location, size,
industry, number of establishments, initial capital, and ownership structure. At an
individual level, the database contains information on gender, age, occupation, working
hours, and earnings per hour.
3.2. Sample
From QP, we select all start-ups established between 2000 and 2008 and we follow
them until 2012. Then, for these start-ups we identify their founders and their
background history. We choose exclusively start-ups with a sole entrepreneur and that
were working in the previous period. We exclude start-ups which we could not identify
the owner and their background history. We restrict our sample to founders aged
between 20 and 65 years old. In total we have 28,453 start-ups and sole entrepreneurs.
The sample is composed by 71 percent of male entrepreneurs (20,293) and 29 percent of
female entrepreneurs (8,160). The data in the sample allow us to study the start-ups
19
3.3. Descriptive Statistics
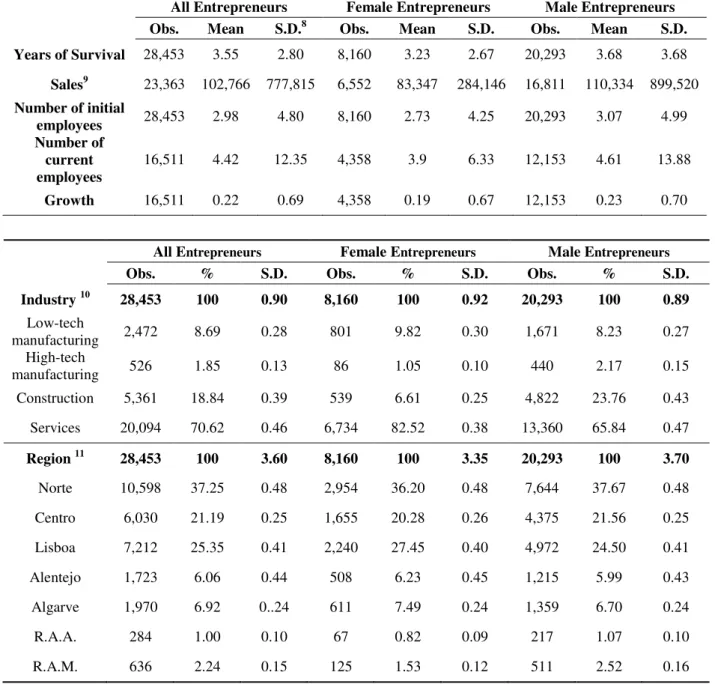
Table 2 presents the description of our variables and Table 3 summarizes the descriptive
statistics of our sample.
Start-ups in our sample are small, founded by one entrepreneur and employing on
average three workers. These start-ups survive on average four years and their first year
of sales is above 100,000€. Most companies have activities related to "Services" (70
percent), the remaining are dispersed by "Low-technology manufacturing" (9 percent),
"Construction" (19 percent) and "High-technology manufacturing" (2 percent). These
firms are mostly located in three regions “Norte” (37 percent), “Lisboa” (26 percent)
and “Centro” (21 percent).
In general both female and male entrepreneurs’ numbers grow steadily throughout the time range of this study. The founders in our sample are predominantly men (71 percent), aged approximately 38, are less likely to be foreign (7 percent) and earned prior to
establish this venture approximately 6,18€/per hour. In terms of education, 13 percent of
the founders are very low educated, 35 percent of the entrepreneurs are low educated,
29 percent have medium education and the remaining 23 percent are highly educated.
Regarding experience, 32 and 20 percent of the entrepreneurs possess previous region
experience and industry experience, respectively.
In the sample is possible to observe the differences between female and male
entrepreneurs. In general male entrepreneurs perform slightly better compared to female
entrepreneurs in terms of survival, size and growth. Firms established by male
entrepreneurs survive, on average, 4 years, whereas female established firms survive 3
years. Male entrepreneurs surpass the firm initial size (3.07) and current size (4.61)
20
entrepreneurs. In terms of firm growth, male entrepreneurs are slightly growing faster in
comparison to firms established by female entrepreneurs (0.23 versus 0.19). The yearly
volume of sales established by male entrepreneurs (110,334€) exceeds the sales value
for female entrepreneurs (83,347€). Female entrepreneurs prefer the “Services” (83
percent) and “Low-technology” (10 percent) sectors to develop their activities, while,
male entrepreneurs choose the “Services” (66 percent), “Construction” (24 percent) and
“Low-technology” (8 percent) sectors.
Female entrepreneurs are slightly younger than male entrepreneurs (37.12 versus 38.03)
and more educated. Females possess more “Medium” and “High” education, 30 and 29
percent, contrasting to male entrepreneurs, 28 and 20 percent. Male entrepreneurs have
higher region and industry experience than female entrepreneurs, 33 versus 32 percent
and 22 versus 17 percent, respectively. The majority of the entrepreneurs are Portuguese
(93 percent). Male entrepreneurs have higher earnings per hour (6.56€) than female
21
4.
Methodological Approach and Results
In this section, we evaluate the performance of female entrepreneurs. We assess the
performance by looking at the start-up initial size, survival and growth.
4.1. Size
To assess start-ups initial size, we start by estimating the following equation:
(1)
where j denotes the industry (two-digit industry code)6, r represents five NUTS regions7, y is the entry year, f is the start-up and i for individual.
The dependent variable, , is the logarithm of the firm’s initial number of
employees.
Our variable of interest is , a dummy variable equalling one if the individual is a
woman and zero if the individual is a man. According to our hypothesis, beta is
expected to be lower than zero.
is a vector of the founder’s characteristics, and includes information like age,
education, experience and nationality of the individuals. To study age we include five
dummy variables: 20 – 29 is coded one for individuals with age between 20 and 29; 30
– 39 is coded one for individuals with age between 30 and 39; 40 – 49 is coded one for
individuals with age between 40 and 49; 50 – 59 is coded one for individuals with age
6 Following CAE.Rev2.1, we categorize industry into 5 groups: Agriculture and Fishing, Low-technology, High-technology manufacturing, Services and Construction. The categories Low-Technology and High-Technology manufacturing followed the OECD definition. “High-technology industries” include the following sectors: pharmaceuticals, office and computing machinery, radio, TV and communication equipment, medical, precision and optical equipment, aircraft and spacecraft, chemicals excluding pharmaceuticals, machinery and equipment, electrical machinery and apparatus, motor vehicles and trailers, railroad and transport equipment. “Low-technology industries” include coke, refined petroleum products and nuclear fuel, rubber and plastic products, other non-metallic mineral products, basic metals, fabricated metal products except machinery and equipment, building and repairing ships and boats, food products, beverage and tobacco, textile and textile products, leather and footwear, wood, pulp, paper products, printing and publishing, and recycling.
22
between 50 and 59; and 60 – 65 is coded one for individuals with age between 60 and
65. Education is measured by four categorical variables: High education, which is a
dummy variable equalling one for founders with bachelors, masters or doctoral degrees;
Medium education, is a dummy variable equalling one for individuals reporting a high
school diploma or vocational school degree; Low education, is a dummy variable
equalling one for individuals that attended junior high school; and Very Low education,
is a dummy variable equaling one for individuals who never attended or completed the
elementary school. We include two variables to measure the Experience of the
individual: the first is, Industry experience, which equals one if the founder has previous
worked in the same 4-digit industry and zero otherwise, and County experience which
equals one if the founder has previously worked in the same county and zero otherwise.
The variable Foreign is a dummy variable corresponding to one for foreign founders
and zero for nationals.
We include entry fixed effects, to control for the macroeconomic contex,
accounts for industry fixed effects, and , for region fixed effects.
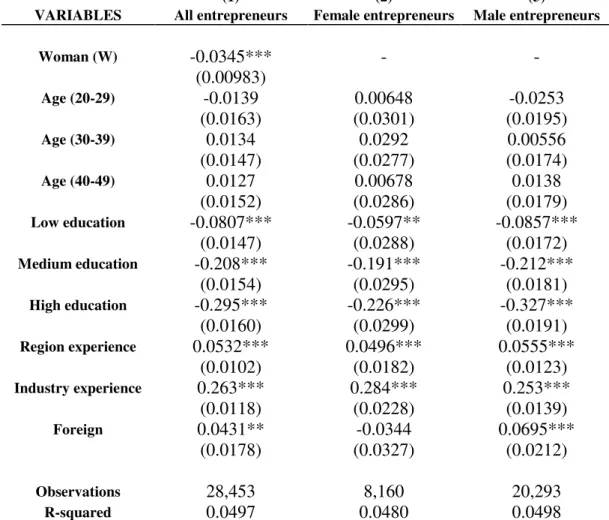
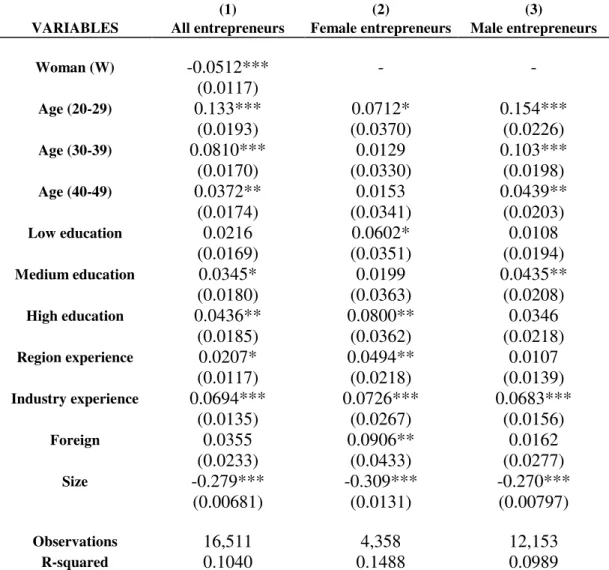
Table 4 presents the results for start-up inicial size using Ordinary Least Squares (OLS),
Langowitz and Minniti (2007) also uses this model.
On the Column (1), we present the results using the sample of all entrepreneurs, in the
Column (2) and (3) we show results for female and male entrepreneurs, respectively.
As expected, female entrepreneurs establish smaller start-ups. The size of the start-up
reduces 3.45 percent. “Industry” and “Region” experience and Education influence the
size of the start-up. While “Industry” and “Region” experience have a positive effect,
“High education” and “Medium education” negatively affect the size of the firm.
23
Education, Nationality and “Region experience” affect the size of start-ups established
by male entrepreneurs. Education has a negative effect and both Nationality and
“Region experience” have a positive relation to the size of start-ups established by male
entrepreneurs. “Industry experience” affects the size of start-ups created by female
entrepreneurs (28 percentage points).
To further control for the ablity of the individual, we add to our equation the variable
earnings per hours. Adding this variable does not change our main results. These are
presented in the appendix on Table A.3.
4.2. Survival
Next, we evaluate survival, we start by estimating a logit model, because of the specific
nature of our dependent variable. We estimate the following equation:
(2)
where j denotes the industry (two-digit industry code), r represents five NUTS regions, y is the entry year, f is the start-up and i for individual.
The dependent variable, , is a dummy variable equalling one if the start-up is still
running after four years and zero otherwise.
As mentioned before, our variable of interest is , a dummy variable equalling one if
the individual is a woman and 0 if the individual is a man. Our hypothesis suggest that
beta should be lower than zero.
is a vector of founder’s characteristics, which includes age, education, experience
and nationality, as previously explored in the latter section.
We include Sizef which is the logarithm of the initial number of employees of the
start-ups. We control for industry and region fixed effects.
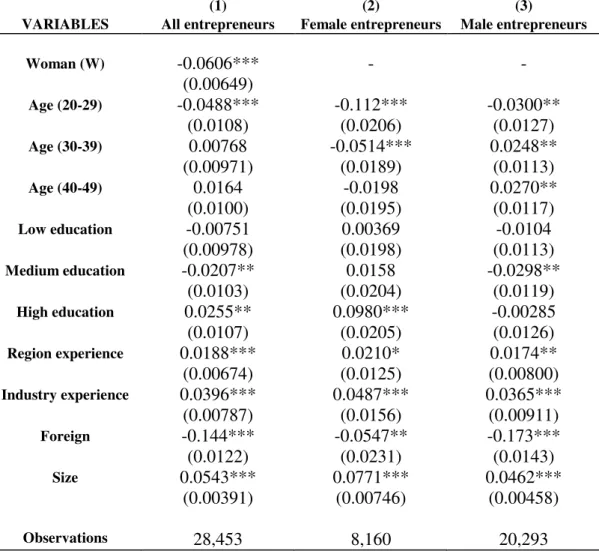
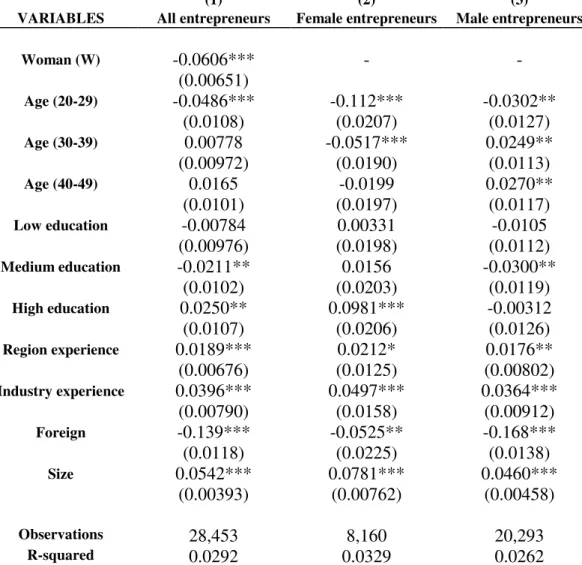
Table 5 presents the marginal effects for start-ups survival using the Logit Model,
24
the sample of all entrepreneurs, in the Column (2) and (3) we show results for female
and male entrepreneurs, respectively.
As expected, we find that female entrepreneurs are less likely to survive the first four
years. Being a women reduces the start-ups probability of survival by 6.06 percent.
Education positively affects firm survival, “High education” has a positive relationship
and is statistically significant, while “Low education” and “Medium education”
negatively affect start-ups survival. The coefficients associated with “County
experience” and “Industry experience” are both positively and statistically significant.
Also, start-ups initial size increases the survival prospects, by 5 percentage points.
Nationality affects negatively the survival of entrepreneurs and also, older entrepreneurs
are more likely to survive.
For female and male entrepreneurs, the initial size of the firm is positively and
statistically significant to the start-ups survival, in particular for females by 7 percentage
points. Also, possessing “Region” and “Industry” experience are positively and
statistically significant. For female entrepreneurs, “Industry experience” is more
significant (5 percentage points) than to male entrepreneurs (4 percentage points). Being
foreign is negatively associated for both genders and reveals to be statistically
significant for the start-ups survival, especially to male entrepreneurs (17 percentage
points). Education is positively and statistically associated to the survival in particular
for female entrepreneurs start-ups (9 percentage points) than to male entrepreneurs.
Being older is positive and significant for male survival, while being young is negative
and statistically significant for female survival.
As a robustness check, we also perform a Probit Model and a Linear Probabilistic
25
The results for these two models are presented in the appendix on Table A.1 and Table
A.2. Both models present similar results concerning firm’s survival.
To further control for the ablity of the individual, we introduce to our equation the
variable earnings per hours. Adding this variable, does not change our main results.
These are presented in the appendix on Table A.4; Table A.5 and Table A.6.
Next, we use duration models to evaluate start-ups survival. The Cox proportional
hazard model is used to investigate the effect of several variables until an event occurs.
These types of models include two parts, incidence (hazard) rate and cumulative
incidence. The Cox regression aims to estimate the hazard ratio, the ratio of incidence
and this differ from the logistic regression that directs attention to odds ratio which is
the ratio of proportions. The Cox model is popular because the estimated hazards are
always positive and it requires fewer assumptions. The logistic model, on the other
hand, is less preferred because ignores the survival times and neglects information. We
estimate the following model:
(3)
where h is the hazard function, is a vector of explanatory variables, and is the vector of coefficients to be estimated.
Before we discuss the results, it should be noted that the tables related to this model
report coefficients rather than hazard ratios. A positive coefficient means there is lower
duration, therefore, the event is more likely to happen and a negative coefficient means
higher duration, thus, the event is less likely to happen. The hazard ratios act as
multipliers of the baseline hazard per unit change of the explanatory variables. A ratio
larger than 1 increases the hazard (the chance of exit on the next time period), while a
26
Table 6, reports the coefficients of the Cox Proportional Hazard Model. We use the
explanatory variables presented earlier. The Column (1) presents the coefficients for the
whole sample of entrepreneurs, the Column (2) and (3) presents the coefficients for
female entrepreneurs and male entrepreneurs, respectively.
Female entrepreneurs start-ups are more likely to fail, in comparison to male
entrepreneurs. Older entrepreneurs with previous experience in the same region and
industry have higher survival prospects. Foreign individuals have fewer chances of
survival. Education does not affect the survival prospects, except for “Medium
education”. Start-ups with larger size have higher duration of survival.
Age affects more the survival of the start-ups. Older male entrepreneurs have more
chances of survival, and middle-aged females have fewer chances of survival.
Entrepreneurs with previous “Industry” and “County” experience have higher chances
of start-up survival, possessing “Industry experience” is particularly significant for
female entrepreneurs. Start-ups with larger size have higher duration of survival,
especially for female entrepreneurs. “Medium education” decreases the chances of
survival for male individuals and “High education” increases the chances of survival
especially to female entrepreneurs.
As predicted, this model reinforces our expectations that female entrepreneurs are less
likely to survive compared to male entrepreneurs.
To further control for the ablity of the individual, we introduce to our equation the
variable earnings per hours. Adding this variable, does not change our main results.
27
4.3. Growth
To analyse the start-ups growth, we estimate the following equation:
(4)
where j denotes the industry (two-digit industry code), r represents five NUTS regions, y is the entry year, f is the start-up and i for individual.
The dependent variable, , is the difference between the logarithm of the
number employees after the first four years and the logarithm of Initial employees of the
start-up.
Our variable of interest is , a dummy variable equalling one if the individual is a
woman and zero if the individual is a man. Acording to our hypothesis we expect beta
to be lower than zero. is a vector of the founder’s characteristicsas mentioned. We
include entry and region fixed effects.
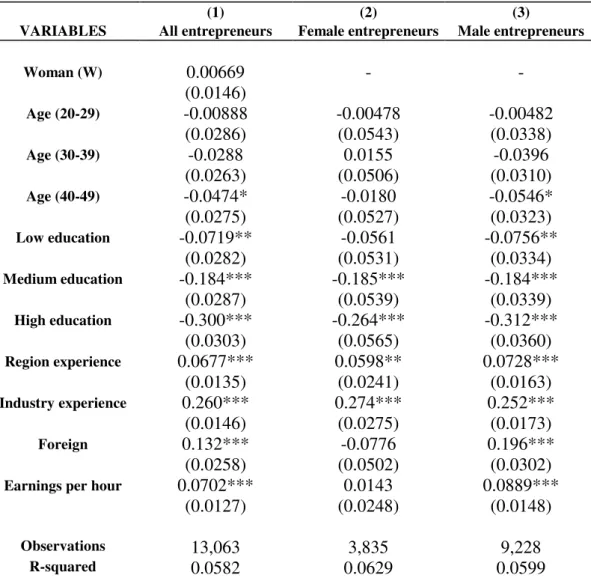
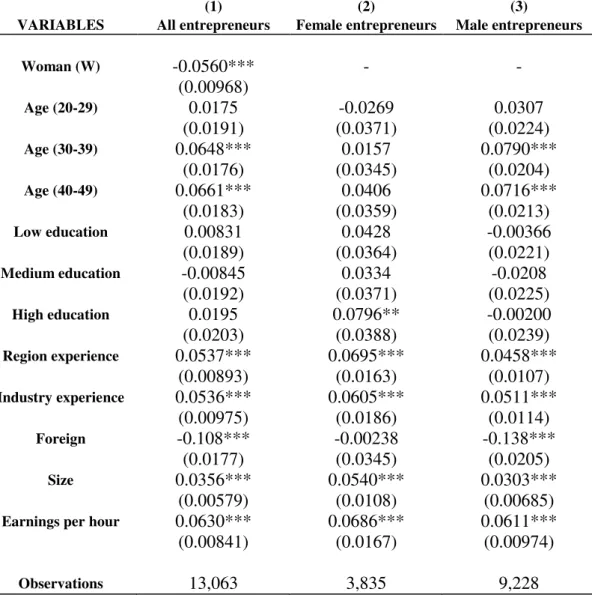
Table 7 presents our results for the start-up growth using Ordinary Least Squares
(OLS). We use the explanatory variables presented earlier. The Column (1) presents the
coefficients for the whole sample of entrepreneurs, the Column (2) and (3) presents the
coefficients for female entrepreneurs and male entrepreneurs, respectively.
As expected, the start ups established by female entrepreneurs grow slower compared to
start-ups established by male entrepreneurs, by 5 percentage points. Younger
entrepreneurs with more education and experience have higher growth prospects. The
start-ups size negatively affects growth, by 3 percentage points. “Industry experience”
“Region experience” are statistically significant and a positive influence to the firm’s
growth, by 7 and 2 percentage points respectively. Education affects positively the
28
To further control for the ablity of the individual, we introduce to our equation the
variable earnings per hours. Adding this variable, does not change our main results.
29
5.
Conclusion
The aim of this study is to evaluate the performance of female entrepreneurs. We look at
the initial size, survival and growth prospects of start-ups characteristics established by
male and female entrepreneurs between the years of 2000 until 2012 in Portugal.
Our sample is composed by 71 percent of male entrepreneurs (20,293) and 29 percent of
female entrepreneurs (8,160), in total we have 28,453 start-ups and sole entrepreneurs
aged between 20 and 65 years old.
Using a Portuguese matched employer-employee database we performed several
econometric models, a Logit, Probit, a Linear Probability and a Cox Proportional
Hazard Model to understand the statistical significance of our variables. We find that
start-ups established by female entrepreneurs are less likely to survive the first four
years, are smaller and grow slower than start-ups established by male entrepreneurs.
This is consistent with the hypothesis presented earlier, start-ups of female
entrepreneurs perform worse than those of male entrepreneurs. Our results are also
robust to controlling for earnings per hour.
Size, Education and Experience variables present statistically significant results in the
majority of the models performed and are in agreement with the literature presented.
We use a Linear Probability Model to study initial size, survival and growth and a
Logit, Probit and a model of duration, Cox Proportional Hazard model to analyse
survival. This last model is especially dedicated to this type of hypothesis since
investigates the effect of the variables until the start-ups no longer exist. The results
reinforce the results previously obtained conclusion, female entrepreneurs are still not
30
Our study suffers from a main limitation, the small time range of the dataset available.
We evaluate the start-ups established between 2000 and 2008 but it would be interesting
to evaluate how female perform before and after crisis. Also, it would be interesting to
31
6.
References
Aldrich, H. (1989). Networking among women entrepreneurs. Women Owned Business ,
103 - 132.
Aldrich, H., Carter, N., & Ruef, M. (2002). With very little help from their friends:
Gender and relational composition of nascent entrepreneurs' startup teams. Frontiers of
Entrepreneurship Research , 156-169.
Alvarez, S., & Meyer, D. (1998). Why do women become entrepreneurs? Frontiers of
Entrepreneurship Research, 63(4), 83-98.
Amit, R., & Muller , E. (1995). "Push" and "Pull" entrepreneurship. Journal of Small
Business & Entrepreneurship, 12 (4), 64-80.
Aronson, R. L. (1991). Self-employment: A labor market perspective. Ithaca, NY: ILR
Press, 24.
Bates, T. (1995). Self-employment entry across industry groups. Journal of Business
Venturing 10 , 143-156.
Becker, G. (2009). Human capital: A theoretical and empirical analysis, with special
reference to education. University of Chicago Press.
Becker, G. (1962). Investments in human capital: a theoretical analysis. Journal of
Political Economy, 70, 9-44.
Birley, S. (1989). Female Entrepreneurs- Are they really any different? Journal of Small
Business Management , 32-37.
Boden, R. (1996). Gender and Self-Employment Selection: An empirical Assessment.
32
Boden, R. (1999). Gender inequality in wage earnings and female self-employment
selection. The Journal of Social-Economics, 28, 351 - 364.
Boden, R. J. (1999a). Flexible working hours, family responsibilities and female
self-employment. American Journal of Economics & Sociology , 58, 71-83.
Bruce, D. (1999). Do husband matter? Married women entering self-employment. Small
Business Economics, 13, 317 - 329.
Bruin, A. d., Brush, C. G., & Welter, F. (2007). Advancing a Framework for Coherent
Research on Women's Entrepreneurship. Entrepreneurship Theory and Practice ,
323-339.
Brush, C. G. (1992). Research on Women Business Owners: Past Trends, A New
Perspective, and Future Directions. Entrepreneurship Theory and Practice , 16, 5-30.
Brush, C. G. (2006). Women entrepreneurs: a research overview, in M. Casson, B.
Yeung, A. Basu and. The Oxford Handbook of Entrepreneurship , 611-628.
Brush, C., & & Bird, B. (1996). Leadership vision of successful women entrepreneurs:
Dimensions and characteristics. Frontiers of Entrepreneurship .
Brush, C., & Cooper, S. (2012). Female Entrepreneurship and economic development:
An international perspective. Entrepreneurship & Regional Development, 24 , 1-6.
Brush, C., Carter, N., Gatewood, E., Greene, P., & Hart , M. (2006). Growth-oriented
women entrepreneurs and their businesses: A global research perspective. Cheltenham,
U.K.: Elgar.
Budig, M. J. (2006). Gender, Self-Employment, and Earnings: The Interlocking
33
Budig, M. J. (2006a). Gender, Self-Employment, and Earnings: The Interlocking
Structures of Family and Professional Status. Gender & Society, 20 (6), 725 - 753.
Budig, M. J. (2006). Intersections on the road to self-employment: gender, family and
occupational class. Social Forces, 84 (4), 2223 - 2239.
Buttner, E. H., & Rosen, B. H. (1988). Bank loan officers’ perceptions of characteristics
of men, women and successful entrepreneurs. Journal of Business Venturing (3) ,
249-258.
Bygrave, W. D., & Hofer, W. C. (1991). Theorizing about entrepreneurship.
Entrepreneurship theory and Practice, 16(2), 13-22.
Caputo, R., & Dolinsky, A. (1998). Women Choice to Persue Self-Employment: The
Role of Financial and Human Capital of Household Members. Journal of Small
Business Management, 36(3), 8-17.
Carr, D. (1996). Two Path to Self-Employment? Woman and Men's Self-Employment
in the United States,1980. Work and Occupations, 23 (1), 26 - 53.
Carter, N., & Allen, K. (1997). Size-determinants of women-owned businesses: Choices
or barriers to resources. Entrepreneurship and Regional Dvelopment, 9 (3), 211-220.
Carter, S., & Rosa, P. (1998). The financing of male- and female-owned businesses.
Entrepreneurship & Regional Development, 10, 225-241.
Catley, S., & Hamilton, R. (1998). Small business development and gender of owner.
Journal of Management Development, 17 (1), 75-82.
Chaganti, R. (1986). Management in Women-Owned Enterprises. Journal of Small
34
Chaganti, R., & Parasuraman, S. (1996). A study of the impacts of gender on business
performance and management patterns in small businesses. Entrepreneurship Theory
and Practice, 21, 73-75.
Chandler, G. N., & Hanks, S. H. (1998). An examination of the substitutability of
founders’human and. Journal of Business Venturing (13) , 353–369.
Clain, S. H. (2000). Gender Differences in Full-Time Self-Employment. Journal of
Economics and Business, 52 (6), 499-513.
Cliff, J. E. (1998). Does one size fit all? Exploring the relationship between attitudes
towards growth, gender, and business size. Journal of Business Venturing , 13 (6), 523 -
542.
Coate, S., & Tennyson, S. (1992). Labor market discrimination, imperfect information,
and self-employment. Oxford Economic Papers 44(2) , 272-288.
Coleman, S. (2000). Access to capital and terms of credit: A comparison of men and
women-owned small businesses. Journal of Small Business Management, 38(3), 37-52.
Coleman, S. (2007). The role of human and financial capital in the profitability and
growth of women-owned small firms. Journal of Small Business Management , 45 (3),
303 - 319.
Connely, R. (1992). Self-Employment and Providing Child Care. Demography, 29,
17-29.
Cowling, M. (2000). Are entrepreneurs different across countries? Applied Economics
35
Davidsson, P., & Benson, H. (2003). The role of social and human capital among.
Journal of Business Venturing 18 , 301-331.
Devine, T. J. (1994a). Changes in Wage-and-Salary Returns to Skill and the Recent
Rise in Female Self-Employment. The American Economic Association , 108-113.
Devine, T. J. (1994b). Characteristics of self-employed women in the United States.
Monthly Labor Review, 117, 20-34.
Drucker, P. (1985). Innovation and Entrepreneurship: Practice and Principles. New
York, USA: Harper Business.
DuReitz, A., & Henrekson, M. (2000). Testing the female underperformance
hypothesis. Small Business Economics, 14(1), 1-10.
Edwards, L., & Field-Hendrey, E. (2002). Home-based work and women’s labour force
decisions. Journal of Labour Economics, 20, 170 - 200.
Edwards, L., & Field-Hendrey, E. (1996). Home-Based Workers: Data from the 1990
Census of Population. Monthly Labor Review, 119, 26.
Fabowale, L., Orser, B., & & Riding, A. (1995). Gender, structural factors, and credit
terms between Canadian small businesses and financial institutions. Entrepreneurship
Theory and Practice, 19(4), 41-65.
Fairlie, R. W. (2007). Entrepreneurship among disadvantaged groups: Women,
minorities and the less educated. In The Life Cycle of Entrepreneurial Ventures , 3,
36
Fairlie, R., & Woodruff, C. (2007). Mexican Entrepreneurship: A Comparison of
Self-employment in Mexico and United States. In Mexican Immigration to the United States
, 123-158.
Fay, M., & Williams, L. (1993). Gender bias and the availability of business loans.
Journal of Business Venturing, 8 (4), 409 - 430.
Fetsch, E. (2015, 02 16). Why the Lack of Women Leaders is a Problem for Businesses.
Retrieved 02 18, 2015, from Kauffman Foundation:
http://www.kauffman.org/blogs/growthology/2015/02/why-the-lack-of-women-leaders-is-a-problem-for-businesses
Fischer, E. M., Reuber, R. A., & Dyke, L. S. (1993). A theoretical overview and
extension of research on sex, gender, and entrepreneurship. Journal of Business
Venturing, 8 (2), 151 - 168.
Flabbi, L., Macis, M., Moro, A., & Schivardi, F. (2014). Do Female Executives Make a
Difference? The Impact of Female Leadership on Gender Gaps and Firm Performance.
Gaglio, C., & Katz, J. (2001). The psychological basis of opportunity identification:
Entrepreneurial alertness. Small Business Economics, 16, 95 - 111.
Gartner, W. B. (1985). A Conceptual Framework for Describing the Phenomenon of
New Venture Creation. The Academy of Management Review, 10 (4), 696 - 706.
GEM. (2012). 2012 Women's Report. Babson College.
Goffee, R., & Scase, R. (1987). Entrepreneurship in Europe: The Social Processes.
37
Greene, P., Brush, C., Hart, M., & Saparito, P. (1999). Exploration of the venture
capital industry: Is gender an issue? Frontiers of Entrepreneurship , 168-181.
Gundry, L. K., & Welsch , H. P. (2001). The ambitious entrepreneur: High growth
strategies of women-owned enterprises. Journal of Business Venturing , 16 (5), 453 -
470.
Gustaffson, B., & Kjulin, U. (1994). Time use in child care and housework and the total
cost of children. Journal of Population Economics, 7, 287 - 306.
Heilman, M., & Chen, J. (2003). Entrepreneurship as a solution: the allure of
self-employment for women and minorities. Human Resource Management Review, 13, 347
- 364.
Hildebrand, V. A., & Williams, D. R. (2003). Self-employment and caring for children:
evidence from Europe. IRISS Working Paper, 2003-2006.
Hisrich, R., Brush, C., Good , D., & DeSouza, G. (1997). Performance in
entrepreneurial ventures: Does gender matter? Frontiers of Entrepreneurship , 238-239.
Hokkanen, P., Lumme, A., & Autio, E. (1998). Gender-based non-differences in bank
shopping and credit terms. Frontiers of Entrepreneurship, .
Hundley, G. (2000). Male/Female Earnings Differences in Self-Employment: The
Effects of Marriage, Children, and, the Household Division of Labor. School of
Industrial & Labor Relations Review, 54 (1), 95 - 114.
Hundley, G. (2001). Why Women Earn Less Than Men in Self-Employment. Journal of
38
Hundley, G. (2001a). Why women earn less than men in self-employment. Journal of
Labor Research, 22, 817-829.
Jurik, N. (1998). Getting away and getting by: the experiences of self-employed
homemakers. Work and Occupations, 25 (11), 7-35.
Kalleberg, A., & Leicht, K. (1991). Gender and organizational performance:
Determinants of small business survival and success. Academy of Management Journal
, 34 (1), 136 - 161.
Kepler, E., & Shane, S. (2007). Are male and female entrepreneurs really that
different? . Retrieved from The Office of Advocacy Small Business Working Papers:
http://www.sba.gov/
Kihlstrom, R., & Laffont, J. (1979). A general equilibrium entrepreneurial theory of
firm formation based on risk aversion. Journal of Political Economy, 87 (4), 719 – 748.
Langowitz, N., & Minniti, M. (2007). The entrepreneurial propensity of women.
Entrepreneurship Theory & Practice, 31 (3), 341 - 364.
Langowitz, N., & Minniti, M. (2007). The entrepreneurial propensity of women.
Entrepreneurship and Practice, 37 (3), 341 - 365.
Leahy, K., & Eggers, J. (1998). Is gender still a factor in entrepreneurial leader
behavior? Frontiers of Entrepreneurship .
Lee, M. A., & Rendall, M. S. (2001). Self-employment disadvantage in the working
lives of blacks. Population Research and Policy Review (20) , 291-320.
Levesque, M., & Minniti, M. (2006). The effect of aging on entrepreneurial behavior.
39
Licht, A. (2007). The entrepreneurial spirit and what the law can do about it.
Comparative Labor Law and Policy Journal, 28, 817 - 862.
Lombard, K. V. (2001). Female self-employment and demand for flexible, nonstandard
work schedules. Economic Inquiry, 39, 214 - 237.
Loscocco, K. A., & Robinson, J. (1991). Barriers to Women's Small-Business Success
in the United States. Gender & Society, 5 (4), 511 - 532.
Loscocco, K. A., Robinson, J., Richard, H. H., & John K., A. (1991). Gender and Small
Business Success: An Inquiry into Women's Relative Disadvantage. Social Forces, 70
(1), 65 - 85.
Malewicki, D., & Leitch, C. (2012). Female & Male Entrepreneurs perceived value of
formal networks: are there differences? Journal of Small Business Strategy , 22(1),
1-20.
Marlow, S. (1997). Self-employed women - New opportunities, old challenges?
Entrepreneurship and Regional Development, 9, 199-210.
McDermott, K. (1985). The 80's Decade of Women Entrepreneurs. D&B Reports , 14 -
16.
Minniti, M., & Naudé, W. (2010). What do we know about the patterns and
determinants of female entrepreneurship across countries? European Journal of
Development Research, 22(3), 277-293.
Minniti, M., Arenius, P., & Langowitz, N. (2005). The 2004 Global Entrepreneurship
Monitor Special Topic Report: Women in Entrepreneurship. Center for Woman
40
Mirchandani, K. (1999). Feminist Insight on Gendered Work: New Directions in
Research on Women and Entrepreneurship. Gender, Work and Organzation, 6 (4),
224-235.
Monitor, G. E. (2012). Global Entrepreneruship Monitor 2012 Women's Report.
Moore, D., & Buttner, E. (1997). Women Entrepreneurs: Moving beyond the Glass
Ceiling. Thousand Oaks, CA: Sage Publications Inc.
Orser, B. J., Riding, A. L., & Manley, K. (2006). Women entrepreneurs and financial
capital. Entrepreneurship Theory & Practice, 30 (5).
Parker, S. C. (2009). The economics of entrepreneurship. Cambridge University Press.
Perry, S. (2002). A comparison of failed and non-failed small businesses in the United
States. Journal of Developmental Entrepreneurship, 7, 415 - 428.
Read, L. (1994). Raising finance from banks: A comparative study of the experiences of
male and female business owners. Frontiers of Entrepreneurship Research , 361-372.
Renzulli, L. A., Aldrich, H., & Moody, J. (2000). Family Matters: Gender, Network,
and Entrepreneurial Outcomes. Social Forces, 79 (2), 523 - 546.
Reynolds, P. D., Bygrave, B., & Hay, M. (2003). Global entrepreneurship monitor
report. Kansas City, MO: E. M. Kauffmann Foundation.
Robb, A., & Wolken, J. (2002). Firm, Owner, and Financing Characteristics:
Differences between Female- and Male-owned Small Businesses. Working paper .
Robinson, P., & Sexton, E. A. (1989). The Economic and Demographic Determinants of
41
Rosa, P., & Hamilton, D. (1994). Gender and ownership in UK small firms.
Entrepreneurship Theory and Practice, 18, 11 - 27.
Schiller, B., & Crewson, P. (1997). Entrepreneurial Origins: A Longitudinal Inquiry.
Economic Inquiry, 35(3), 523 - 531.
Sexton, D., & Bowman-Upton, N. (1990). Female and male entrepreneurs:
Psychological characteristics and their role in gender related discrimination. Journal of
Business Venturing, 5, 29 - 36.
Sexton, E. A., & Robinson, P. (1989). The Economic and Demographic Determinants of
Self-Employment. Frontiers of Entrepreneurship Research , 28-42.
Srinivasan, R., Woo, C., & Cooper, A. (1994). Performance determinants for male and
female entrepreneurs. Frontiers of Entrepreneurship Research , 43-56.
Taniguchi, H. (2002). Determinants of Women Entry into Self-Employment. Social
Science Quarterly, 83(3), 875 - 893.
Thébaud, S. (2010). Gender and Entrepreneurship as a Career Choice: Do
self-assessment of Ability Matter? Social Psychology Quarterly, 73(3), 288 - 304.
Unger, J. M., Rauch, A., Frese, M., Rosenbusch, N., & Steinmetz, H. (2008). Human
Capital and Entrepreneurial Success: A Meta-Analytic Review and Path Analysis.
Academy of Management Annual Meeting. Anaheim, CA.
Vinnicombe, S. (1987). Drawing out the Differences between Male and Female
Working Styles. Women in Management Review, 7(2), 5-16.
Walker, E., & Brown, A. (2004). What Sucess Factors are Important to Small Business
42
Watson, J. (2002). Comparing the performance of male- and female-controlled
businesses: Relating outputs to inputs. Entrepreneurship Theory and Practice , 26(3),
91-100.
Watson, J., & Robinson, S. (2003). Adjusting for risk in comparing the performances of
male- and female-controlled SMEs. Journal of Business Venturing, 18 (6), 773 - 788.
Weeden, K. A. (2004). Profiles of Change: Sex Segregation in the United States
1910-2000. Occupational Ghettos: The Worldwide Segregation of Men and Women , 131 -
178.
Weiler, S., & Bernasek, A. (2001). Dodging the glass ceiling? Networks and the new
wave of women entrepreneurs. The Social Science Journal, 38(1), 85 - 103.
Wellington, A. (2006). Self-Employment: the new solution for balacing family and
43
7.
Tables
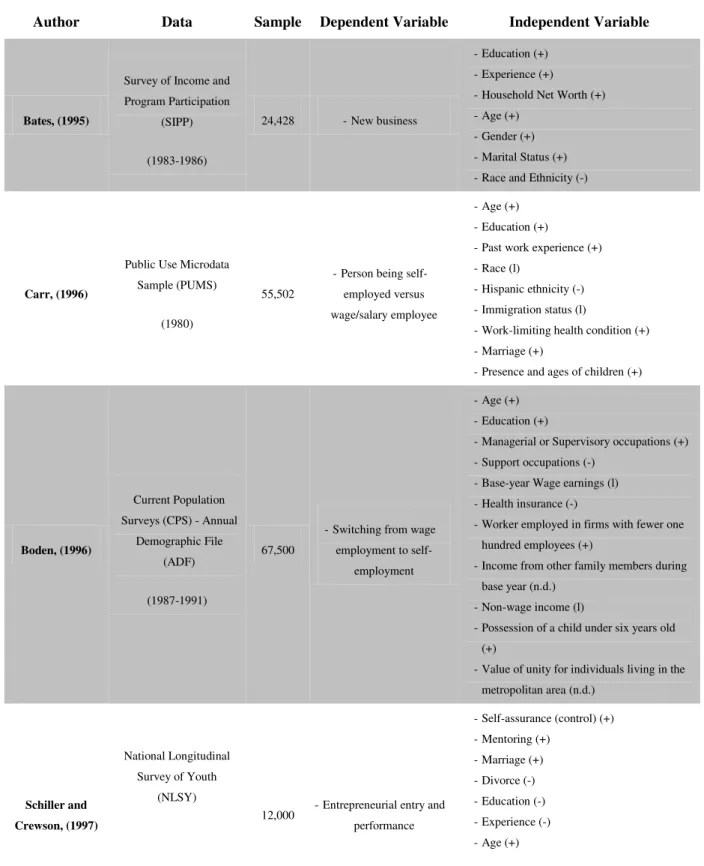
Table 1: Literature Review Summary
Author Data Sample Dependent Variable Independent Variable
Bates, (1995)
Survey of Income and Program Participation
(SIPP)
(1983-1986)
24,428 -New business
-Education (+) -Experience (+)
-Household Net Worth (+) -Age (+)
-Gender (+) -Marital Status (+) -Race and Ethnicity (-)
Carr, (1996)
Public Use Microdata Sample (PUMS)
(1980)
55,502
-Person being self-employed versus wage/salary employee
-Age (+) -Education (+)
-Past work experience (+) -Race (l)
-Hispanic ethnicity (-) -Immigration status (l)
-Work-limiting health condition (+) -Marriage (+)
-Presence and ages of children (+)
Boden, (1996)
Current Population Surveys (CPS) - Annual
Demographic File (ADF)
(1987-1991)
67,500
-Switching from wage employment to
self-employment
-Age (+) -Education (+)
-Managerial or Supervisory occupations (+) -Support occupations (-)
-Base-year Wage earnings (l) -Health insurance (-)
-Worker employed in firms with fewer one hundred employees (+)
-Income from other family members during base year (n.d.)
-Non-wage income (l)
-Possession of a child under six years old (+)
-Value of unity for individuals living in the metropolitan area (n.d.)
Schiller and
Crewson, (1997)
National Longitudinal Survey of Youth
(NLSY)
12,000 -Entrepreneurial entry and performance
-Self-assurance (control) (+) -Mentoring (+)
44
Bruce, (1999)
Panel Study of Income Dynamics (PSID)
(1979-1991)
3,330 -Married women transition to self-employment
-Age (+) -Marriage (+)
-Educational attainments (-) -Part-time work (-) -Husband’s race (-)
-Husband’s labour earnings (+)
-Number of children under eighteen years old in the household (+)
-Husband’s self-employment experience (+)
Boden, (1999)
Current Population Surveys (CPS)
(1987-1992)
100,000
-Switching from wage employment to
self-employment
-Experience (+) -Education (+)
-Base year wage earnings (-)
-Income by other family members during base year (n.d.)
-Non-wage income (+)
-Possession of a child under six years old (+)
-Number of employees in the base year (n.d.)
-Gender differences in base year earnings (+)
Clain, (2000)
Public Use Microdata Sample (PUMS)
(1990)
64,682 -Gender differences in full-time self-employment
-Marriage (+) -Spouse’s income (+) -Race (+)
-Education (+) -Age (+)
-Residence in central city location (n.d.) -Mobility limitations (n.d.)
-Fluent in English (n.d.)
-Being a Female and possesses a child (n.d.) -Geographic location (+)
-Individual occupation (+)
-Individual has a service occupation (+)
Hundley, (2001)
Michigan Panel Study of Income Dynamics
(PSID)
(1989-1990)
659
-Annual earnings in self-employment -Average hourly earnings in
self-employment
-Race (n.d.) -Nearest City (n.d.) -Disability (n.d.) -Marriage (n.d.) -Education (+) -Experience (-)
45
Taniguchi,
(2002)
National Longitudinal Survey of Youth
(NLSY)
(1979-1993)
19,312
-Rate at which women move from
non-employment to employment (either
self-employment or wage employment)
-Cumulative work experience (weeks) (+) -Occupation (+)
-Part-time status (0)
-Education (years) (self-employment (0); wage-employment (+))
-Marital status (+)
-Number and ages of children (child under six years old (0); child equal or above six years old (+))
-Previously self-employment (+) -Age (-)
-Number of jobs held (+)
Hildebrand and Williams, (2003) European Community Household Panel (ECHP) survey (1994-1996) 60,000
-Self-employment status -Time spent caring for
children
-Number of hours per week spent looking after children (+)
-Education (l)
-Married with spouse present (+) -Number of kids in the household (+) -Kids with less than twelve years old (+)
Wellington, (2006) (cont.) Current Population Surveys (CPS) (1977-1999) 27,365
-Characteristics of Working young Married white
women
-Child under six (+)
-Number of children under eighteen in household (0)
-Age (+) -Education (-) -Health-insurance (-)
National Longitudinal Survey (NLS)
(1977-1987)
3,532
-Child under six (+)
-Number of children under eighteen in household (+)
-Education (+)
-Expectations on having more children (+) -Personality (control) (+)
Additionally tests on NLSY:
-Total number of jobs held (+) -Tenure with employer (-) -Health insurance (-) -Maternity leave (-) National Longitudinal
Survey of Youth (NLSY)
(1987-1996)
2,152
Budig, (2006a) National Longitudinal
Survey of Youth (NLSY)
(1979-1998)
12,686 -Natural logarithm of hourly earnings
-Marriage (+)
-Number of children residing in the home (+)
-Number of years of experience (+) -Years of current job tenure (+) -Education (+)
46
(cont.)
-Weekly hours (+) -Annual weeks work (+) -Industrial-sector categories (+) -Age (n.d.)
-Rural Area (n.d.) -Region of residence (n.d.)
Langowitz and Minniti, (2007) Global Entrepreneurship Monitor (GEM) (2001) 24,131
-Nascent Entrepreneurs -Necessity vs Opportunity
Entrepreneurs
-Gender (+) -Age (+) -Work status (+) -Education (+) -Fear failure (-)
-Acquaintance with entrepreneurs (+) -Knowledge of opportunities near their
home's area (+) -Experience (+)
Thébaud, (2010)
Global Entrepreneurship Monitor (GEM)
(2001-2005)
15,242 -Gender differences in self-assessment
-Gender (+) -Age (+) -Education (+) -Workforce status (+)
-Personal Financial resources (-) -Network resources (l)
This table provides a summary of the empirical evidence on the determinants of female entrepreneurship based on existing literature.
47
Table 2: Description of the Variables
Variables Description
Panel A – Start-ups Characteristics Start-up Size
The Size is the logarithm of initial number of employees in the start-up.
Start-up Survival The Survival is computed by, subtracting the year of exit and the year of entry of the start-up.
Dummy variable, equalling 1 if the start-up survived the first four years; and 0 otherwise
Start-up Growth
The Growth is computed by, subtracting the logarithm of the number employees after the first 4 years and the logarithm of Initial employees of the start-up.
Panel B – Founders Characteristics
Founders gender Dummy variable, equalling 1 for woman; and 0 for male entrepreneurs.
Founders Age
The age at which the entrepreneurs established the start-ups. With this variable we construct five dummy variables.
Age 20- 29 is coded 1 for individuals with age between 20 and 29;
Age 30- 39 is coded 1 for individuals with age between 30 and 39;
Age 40- 49 is coded 1 for individuals with age between 40 and 49;
Age 50- 59 is coded 1 for individuals with age between 50 and 59;
Age 60- 65 is coded 1 for individuals with age between 60 and 65;
and 0 otherwise.
Founders education level
Founder education at the time of establishing the start-up. With this variable we construct four dummy variables
High education is a dummy variable corresponding to 1 for founders
with bachelors, masters or doctoral degrees;
Medium education is a dummy variable corresponding to 1 for
individuals that attended high school or vocational school degree;
Low education is a dummy variable corresponding to 1 for individuals
that attended junior high school;
Very low education is a dummy variable corresponding to 1 for
individuals that never attended or completed the elementary school; and 0 otherwise.
Founders experience
Founder industry or regional experience at the time of establishing the start-up. With this variable we construct two dummy variables.
Industry experience is a dummy variable which corresponds to 1 if
founders have previous work experience in the industry;
Region experience is a dummy variable which corresponds to 1 if the
founders have previously worked in the same county; and 0 otherwise.
Founders earnings per hour Are the last earnings per hour which the entrepreneur received when the start-up was established. Logarithm of the earnings of the entrepreneurs in the start-up.