Carlos Pestana Barros & Nicolas Peypoch
A Comparative Analysis of Productivity Change in Italian and Portuguese Airports
WP 006/2007/DE _________________________________________________________
João Carlos Lopes & João Ferreira do Amaral
The Structure and Evolution of Production,
Employment and Human Capital in Portugal: an
Input-Output Approach
WP 24/2013/DE/UECE _________________________________________________________
De pa rtme nt o f Ec o no mic s
W
ORKINGP
APERSISSN Nº 0874-4548
School of Economics and Management
The Structure and Evolution of Production, Employment and
Human Capital in Portugal: an Input-Output Approach
João Carlos Lopes* and João Ferreira do Amaral**
* ISEG, Lisboa University (UL) and Research Unit on Complexity and Economics
(UECE)
** ISEG, Lisboa University (UL) and Research Unit on Complexity and Economics
(UECE)
October 2013
Abstract. The main purpose of this paper is to analyse the structure and evolution of
production, employment and human capital in Portugal, using an inter-industry approach. A descriptive analysis of the sector composition of gross output, value added and employment is made, followed by a quantification of changes in relative labour productivity and primary input content of final demand components. Next, the evolution of employment multipliers is quantified, as well as the structure of labour force qualifications by sector. Although remarkable improvements have been achieved in the past, the low educational levels of its workers, on average, remains one the main vulnerabilities of Portugal in the global and knowledge economy of our days. In this context, the main contribution of the paper is the quantification of human capital requirements of final demand changes by component. Using an input-output approach combining sector productivities and labour qualifications, output multipliers and final demand structure, it is possible to quantify the growth in employment by level of qualification resulting from a unitary growth of private and public consumption, investment and exports. This exercise is made for 1995 and 2008, using input-output domestic flow tables from INE and DPP and employment qualifications from Quadros de Pessoal database.Keywords: Employment, Human Capital, Input-Output Analysis, Portugal
2
The Structure and Evolution of Output, Employment and
Human Capital in Portugal: an input-output approach
1. Introduction
The main purpose of this paper is to quantify the changes in the structure of economic
activity, employment multipliers and human capital requirements of final demand
components in the Portuguese economy, in the period 1995-2008, within an
input-output framework.
The evolution of output, value added and employment structure by sectors in Portugal
illustrates the significant changes in the last years, with a relative decay of agriculture,
mining and (almost all) manufacturing activities and a reinforcement of utilities,
construction and private and public services (Lopes, 2012).
These changes were common to most developed economies due to the globalization
process and the emergence of new competitors, mainly China, but in Portugal they were
accentuated by the inadequate adjustment to the adoption in 1999 of a strong currency,
the Euro (Amaral, 2013). For an interesting analysis of these trends at a regional level
see Martins and Barradas (2009).
A negative consequence of this process was the slowdown (in fact, almost the standstill)
of average productivity growth, due to the lower efficiency of the sectors that were
reinforced after Portugal had begun to prepare for membership in the Economic and
Monetary Union (Leão et al, 2011; Reis, 2013). The majority of these sectors are
marked by low-skilled labour and weak productivity growth, as is shown in this paper.
Another consequence was the significant increase in external dependency, measured in
this paper by the quantification of the direct and indirect import content of final demand
components, namely private consumption, investment and exports. The Leontief model
is particularly indicated for this analysis, because it pays attention not only to the direct
3 dependencies associated to the interindustry flows (Leontief, 1951). In Portugal, the
import content of final demand has grown significantly between 1995 and 2008.
On top of this comes one of the main structural vulnerabilities of the Portuguese
economy, i.e. the low level of its labour force qualifications although remarkable
improvements have been achieved in the last decades (see Alves et al, 2010).
An important contribution of this paper is the quantification of the human capital
requirements of final demand changes by component. It is an input-output approach
combining sectoral productivities and labour qualifications, output multipliers and final
demand structure. It allows the quantification of growth in employment by level of
qualification resulting from a unitary growth of private consumption, public
consumption, investment and exports.
The rest of the paper is organized as follows. In the next section the theoretical and
methodological framework is presented and discussed. In section 3, an application to
the Portuguese case in two years, 1995 and 2008, is made. After presenting the data
sources - input-output domestic flow tables from the Portuguese Statistics Institute
(INE) and Departmento de Prospectiva e Planeamento (DPP) and employment
qualifications from Quadros de Pessoal – a descriptive analysis of the sectoral structure
of output, value added and imports is made, as well as a brief comparison of sectoral
productivities in both years. Then, primary input contents of final demand components
are quantified, followed by a quantitative assessment of employment multipliers and
sectoral employment qualifications. The empirical part of the paper ends with the
quantification of employment by level of qualification associated with each final
demand component increase. Finally, in section 4 some concluding remarks are made.
2. Theoretical and methodological framework
In order to assess the impact on employment by level of qualification of changes in the
different components of final demand (private consumption, public consumption,
4 The first is the construction of E, the matrix representing the educational structure of
labour force. This matrix has a dimension (l x n), with l the levels of education and n the
number of sectors.
Secondly, a diagonal (n x n) matrix P of the sectoral average productivities is
considered. The diagonal elements of this matrix are the ratios of gross output and
employment (in number of workers) of the n sectors of the economy.
The next step concerns the Leontief inverse matrix, L, of output multipliers, which, as it
is well known, results from the solution of the Leontief system: A x + y = x, where x is
the column vector of gross outputs of the n sectors of the economy, y is the final
demand vector and A is the technical (intermediate input) coefficient matrix. Provided
that the Simon-Hawking conditions are fulfilled, this system has always a positive
(meaningful) solution, given by: y = (I-A)-1 x. The so-called Leontief inverse (I-A)-1 is
commonly represented as L, and its generic element lij is an output multiplier giving the
increase in sector i’s gross output when the final demand direct to j sector has a unitary
increase. This is the basic result of the Leontief model, with many useful applications
since the important works of the 1950’s of Rasmussen (1956), Chenery and Watanabe
(1958) and Hirschman (1958). For a clear and rigorous explanation of the model see
Miller and Blair (2009). Recent applications to Portugal are, among others, Reis and
Rua (2006), Lopes et al (2011) and Amaral et al (2012).
The last component needed is yk, the (n x 1) vector of the structure of each final demand
component, with k varying in private consumption, public consumption, investment and
exports.
Then, we can obtain the product zk = ET (P)-1 L yk, which is a column vector of
dimension l, giving the employment by level of qualification necessary to fulfill one
unity of final demand component k.
It is an interesting analysis to compare the different components of z, when the final
demand components k are changing. This is the main result of the empirical section of
5 format, namely pre-multiplying the Leontief inverse by the raw vector of sectoral
employment coefficients. The generic element of this (raw) vector of multipliers gives a
useful information, the employment created in the economy when the final demand
directed to a specific sector has a unitary increase.
Also important, although not directly linked to employment or qualifications, is the
so-called Gama matrix, which gives the primary input contents (wages, profits, indirect
taxes and imports) of the final demand components (private and public consumption,
investment and exports). This is a (4 x 4) matrix, calculated according to the following
formula:
Gama = av L ay + az,
in which av is the (4 x n) matrix of primary input vertical coefficients, ay is the (n x 4)
vertical coefficients of final demand components directed to (domestic) sectors and az is
the (4 x 4) matriz of vertical coefficients of the so-called fourth quadrant of the
input-output table, with the first two raw null (wages and profits) and positive values in the
last two raw, corresponding to indirect taxation and imports with direct incidence on
final demand components.
3. Structure and evolution of Portuguese economy: 1995-2008
In this section a detailed empirical analysis is made of the Portuguese economy at
sectoral level and its evolution over the period 1995-2008, using several indicators for
25 industries. The analysis covers gross output value, value added, employment, labour
productivity, primary input content of final demand, employment multipliers, labour
force qualifications and the employment content of the different components of final
demand, e.g. private consumption, public consumption, investment and exports.
Two main databases are used. The first is the (domestic flow) input-output tables of
DPP with data from INE. The detailed description of these tables is made in Dias et al
6 matrices, and this has conditioned the sectoral aggregation made in this paper, in order
to make both sources compatible. The 25 resulting sectors are shown in Appendix 1.
The second source of data is the so-called Quadros de Pessoal, a large database
collected on an annual basis about the Portuguese firms and its workers, provided by the
Ministry of Solidarity and Social Security. It covers people working in the private
business sector (around 3.3 million workers, in 2009), excluding liberal professionals.
This database was used to build the matrix of labour force qualifications by sector, for
the years 1995 and 2008. It must be noticed that in the cases of agriculture and public
service sectors the data covered by Quadros de Pessoal is very low, and so the
corresponding results must be read with due caution.
3.1 Descriptive analysis of Output, Value Added and Employment
Starting with a brief description of the sectoral evolution of the Portuguese economy in
the period 1995-2008, the main trends, already mentioned, are the relative loss of
importance of tradable sectors (agriculture, mining and manufactures) and the
reinforcement of utilities, construction, real estate and services at general, both private
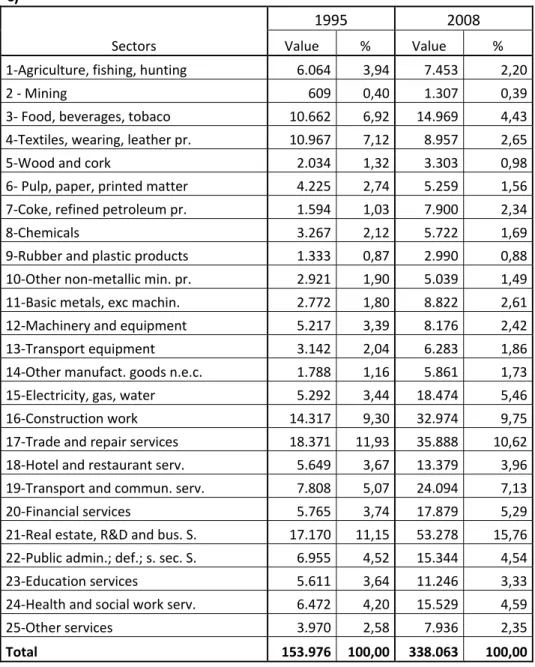
and public. This is true in the case of (gross) output value (Table 1), value added (Table
2) and employment (Table 3).
In 1995, the rank of sectors in terms of gross output has in the top five positions Trade
and repair services; Real estate and business services; Construction; Textiles, wearing
and leather products and Food, beverages and tobacco products. In 2008, Real estate
and Trade change positions with Construction very close to Trade. Transport and
communication services and Utilities reinforce its relative weight substituting Textiles
and Food products.
The two most significant value added generating sectors in 1995 are Trade (14,7%) and
Real estate (14%), at a large distance from all the others. Next, come Public
administration (7,8%), Construction (6,7%) and Education services (6,4%). The
reinforcement of Real estate after this year was overwhelming, attaining 22,3% of all
7 limitations, this sector includes also R&D and other business services, but these are very
less relevant components compared with real estate activities).
Table 1: Gross output value (domestic) at basic current prices (106
€)
Sectors
1995 2008
Value % Value %
1‐Agriculture, fishing, hunting 6.064 3,94 7.453 2,20
2 ‐ Mining 609 0,40 1.307 0,39
3‐ Food, beverages, tobaco 10.662 6,92 14.969 4,43
4‐Textiles, wearing, leather pr. 10.967 7,12 8.957 2,65
5‐Wood and cork 2.034 1,32 3.303 0,98
6‐ Pulp, paper, printed matter 4.225 2,74 5.259 1,56
7‐Coke, refined petroleum pr. 1.594 1,03 7.900 2,34
8‐Chemicals 3.267 2,12 5.722 1,69
9‐Rubber and plastic products 1.333 0,87 2.990 0,88
10‐Other non‐metallic min. pr. 2.921 1,90 5.039 1,49
11‐Basic metals, exc machin. 2.772 1,80 8.822 2,61
12‐Machinery and equipment 5.217 3,39 8.176 2,42
13‐Transport equipment 3.142 2,04 6.283 1,86
14‐Other manufact. goods n.e.c. 1.788 1,16 5.861 1,73
15‐Electricity, gas, water 5.292 3,44 18.474 5,46
16‐Construction work 14.317 9,30 32.974 9,75
17‐Trade and repair services 18.371 11,93 35.888 10,62
18‐Hotel and restaurant serv. 5.649 3,67 13.379 3,96
19‐Transport and commun. serv. 7.808 5,07 24.094 7,13
20‐Financial services 5.765 3,74 17.879 5,29
21‐Real estate, R&D and bus. S. 17.170 11,15 53.278 15,76
22‐Public admin.; def.; s. sec. S. 6.955 4,52 15.344 4,54
23‐Education services 5.611 3,64 11.246 3,33
24‐Health and social work serv. 6.472 4,20 15.529 4,59
25‐Other services 3.970 2,58 7.936 2,35
Total 153.976 100,00 338.063 100,00
Source: INE and authors' calculations
In the second position of the value added rank is now Trade and communication
services, with a slight relative decay to 12,4%, followed again at a large distance by
Public administration (7,1%). A sector clearly gaining weight in these years is Financial
services, entering to the fourth position of the rank (6,95%). In the fifth position (almost
8 Table 2: Value added, at basic current
prices (106 €)
Sectors
1995 2008
Value % Value %
1‐Agriculture, fishing, hunting 3.677 5,00 3.111 1,99
2 ‐ Mining 364 0,50 553 0,35
3‐ Food, beverages, tobaco 2.560 3,48 3.184 2,03
4‐Textiles, wearing, leather pr. 3.572 4,86 3.021 1,93
5‐Wood and cork 645 0,88 768 0,49
6‐ Pulp, paper, printed matter 1.439 1,96 1.710 1,09
7‐Coke, refined petroleum pr. ‐88 ‐0,12 428 0,27
8‐Chemicals 996 1,35 1.373 0,88
9‐Rubber and plastic products 390 0,53 835 0,53
10‐Other non‐metallic min. pr. 1.157 1,57 1.679 1,07
11‐Basic metals, exc machin. 856 1,16 2.495 1,59
12‐Machinery and equipment 1.387 1,89 2.190 1,40
13‐Transport equipment 666 0,91 1.099 0,70
14‐Other manufact. goods n.e.c. 610 0,83 2.186 1,40
15‐Electricity, gas, water 2.609 3,55 4.306 2,75
16‐Construction work 4.920 6,69 10.624 6,79
17‐Trade and repair services 10.798 14,68 19.339 12,36
18‐Hotel and restaurant serv. 1.928 2,62 7.066 4,51
19‐Transport and commun. serv. 4.492 6,11 10.450 6,68
20‐Financial services 4.243 5,77 10.879 6,95
21‐Real estate, R&D and bus. S. 10.276 13,97 34.888 22,29
22‐Public admin.; def.; s. sec. S. 5.764 7,84 11.076 7,08
23‐Education services 4.707 6,40 9.630 6,15
24‐Health and social work serv. 3.724 5,06 8.811 5,63
25‐Other services 1.871 2,54 4.790 3,06
Total 73.562 100,00 156.494 100,00
Source: INE and authors' calculations
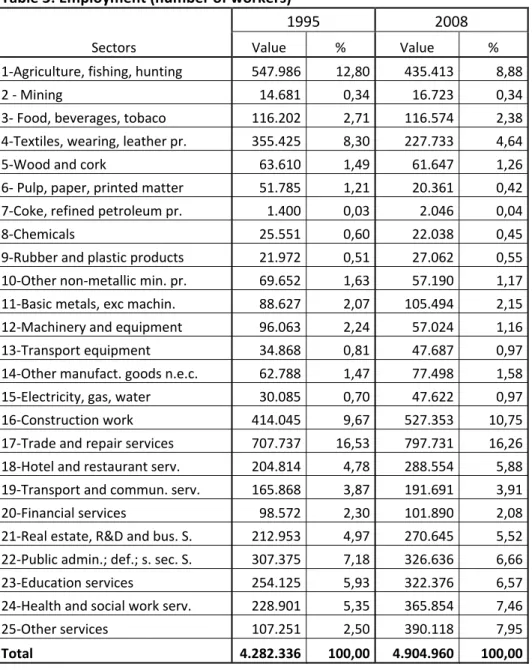
In terms of employment, measured by the number of workers, “Trade and repair
services” is largely the dominant sector in both years (more than 16%). In 1995,
Agriculture is still the second employer sector with almost 13%, and the fourth is
another traditional sector, “Textiles, wearing and leather products” (8,3%) after
“Construction” with 9,7%. Public administration closes the top five employment rank,
9 Between 1995 and 2008, although loosing significantly in absolute and relative terms
(4%) Agriculture is still the third employer sector, after Construction that increases to
almost 11%. As was mentioned before, the destruction of employment in agriculture,
textiles and other manufacturing sectors was accompanied by a strong employment
creation in all the service sectors, private and public.
Table 3: Employment (number of workers)
Sectors
1995 2008
Value % Value %
1‐Agriculture, fishing, hunting 547.986 12,80 435.413 8,88
2 ‐ Mining 14.681 0,34 16.723 0,34
3‐ Food, beverages, tobaco 116.202 2,71 116.574 2,38
4‐Textiles, wearing, leather pr. 355.425 8,30 227.733 4,64
5‐Wood and cork 63.610 1,49 61.647 1,26
6‐ Pulp, paper, printed matter 51.785 1,21 20.361 0,42
7‐Coke, refined petroleum pr. 1.400 0,03 2.046 0,04
8‐Chemicals 25.551 0,60 22.038 0,45
9‐Rubber and plastic products 21.972 0,51 27.062 0,55
10‐Other non‐metallic min. pr. 69.652 1,63 57.190 1,17
11‐Basic metals, exc machin. 88.627 2,07 105.494 2,15
12‐Machinery and equipment 96.063 2,24 57.024 1,16
13‐Transport equipment 34.868 0,81 47.687 0,97
14‐Other manufact. goods n.e.c. 62.788 1,47 77.498 1,58
15‐Electricity, gas, water 30.085 0,70 47.622 0,97
16‐Construction work 414.045 9,67 527.353 10,75
17‐Trade and repair services 707.737 16,53 797.731 16,26
18‐Hotel and restaurant serv. 204.814 4,78 288.554 5,88
19‐Transport and commun. serv. 165.868 3,87 191.691 3,91
20‐Financial services 98.572 2,30 101.890 2,08
21‐Real estate, R&D and bus. S. 212.953 4,97 270.645 5,52
22‐Public admin.; def.; s. sec. S. 307.375 7,18 326.636 6,66
23‐Education services 254.125 5,93 322.376 6,57
24‐Health and social work serv. 228.901 5,35 365.854 7,46
25‐Other services 107.251 2,50 390.118 7,95
Total 4.282.336 100,00 4.904.960 100,00
10
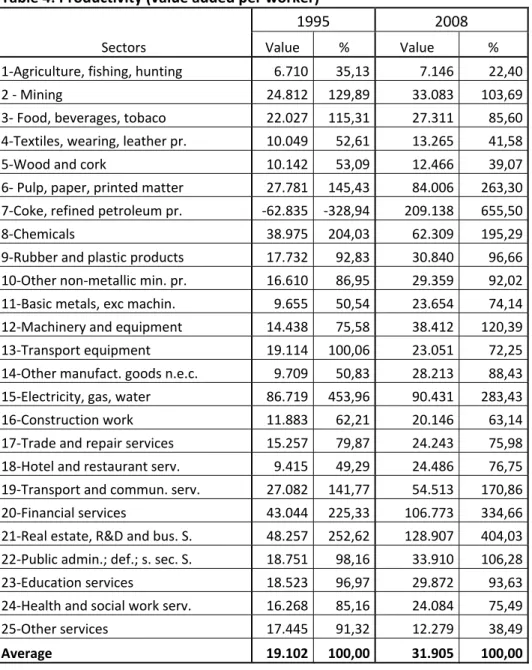
3.2 Labour productivity and primary input contents of final demand components
An important indicator of the sectoral economic performance and efficiency is the
labour productivity, in this case measured by value added by worker. In Table 4 the
absolute and relative (to the average of the economy) numbers are shown, for 1995 and
2008. In 1995, the most productive sectors are Electricity, gas and water, Real estate,
R&D and business services, Financial services, Chemicals and Pulp, paper and printed
matter. The less productive sectors are Agriculture, fishing and hunting, Hotel and
restaurant services, Basic metals, except machinery, Textiles, wearing and leather
products and Wood and cork products.
Table 4: Productivity (value added per worker)
Sectors
1995 2008
Value % Value %
1‐Agriculture, fishing, hunting 6.710 35,13 7.146 22,40
2 ‐ Mining 24.812 129,89 33.083 103,69
3‐ Food, beverages, tobaco 22.027 115,31 27.311 85,60
4‐Textiles, wearing, leather pr. 10.049 52,61 13.265 41,58
5‐Wood and cork 10.142 53,09 12.466 39,07
6‐ Pulp, paper, printed matter 27.781 145,43 84.006 263,30
7‐Coke, refined petroleum pr. ‐62.835 ‐328,94 209.138 655,50
8‐Chemicals 38.975 204,03 62.309 195,29
9‐Rubber and plastic products 17.732 92,83 30.840 96,66
10‐Other non‐metallic min. pr. 16.610 86,95 29.359 92,02
11‐Basic metals, exc machin. 9.655 50,54 23.654 74,14
12‐Machinery and equipment 14.438 75,58 38.412 120,39
13‐Transport equipment 19.114 100,06 23.051 72,25
14‐Other manufact. goods n.e.c. 9.709 50,83 28.213 88,43
15‐Electricity, gas, water 86.719 453,96 90.431 283,43
16‐Construction work 11.883 62,21 20.146 63,14
17‐Trade and repair services 15.257 79,87 24.243 75,98
18‐Hotel and restaurant serv. 9.415 49,29 24.486 76,75
19‐Transport and commun. serv. 27.082 141,77 54.513 170,86
20‐Financial services 43.044 225,33 106.773 334,66
21‐Real estate, R&D and bus. S. 48.257 252,62 128.907 404,03
22‐Public admin.; def.; s. sec. S. 18.751 98,16 33.910 106,28
23‐Education services 18.523 96,97 29.872 93,63
24‐Health and social work serv. 16.268 85,16 24.084 75,49
25‐Other services 17.445 91,32 12.279 38,49
Average 19.102 100,00 31.905 100,00
11 In 2008, the most productive sector, at a large distance from all the others, is Coke,
refined petroleum products (note that the negative number for this sector in 1995 is
probably due to the way taxes where considered in the national accounts). Next come
Financial services and Real estate, R&D and business services. Electricity, gas and
water decays from the first to the fourth place and Pulp, paper and printed matter
maintain the fifth place in the productivity rank. On the other side, Agriculture keeps
the last place, and loose significantly for the average productivity, from approximately
one third to one fifth. Relative loosing sectors are also Wood and cork products (now
the second worst) and Textiles, wearing and leather products. Construction maintains its
relative productivity, around 60% of the average, but is now the fourth worst sector, due
to the relative improvement of Basic metals except machinery, from 50% to 74% of the
average.
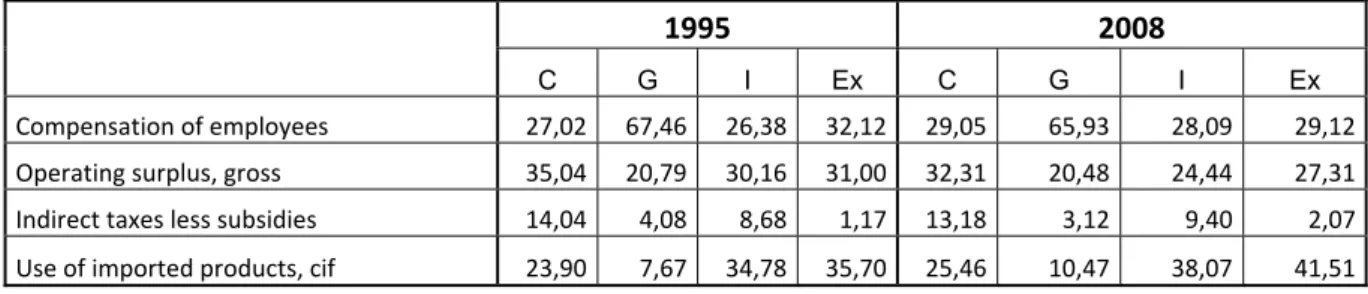
An interesting analysis of the structure and evolution of an economy is given by the
primary input contents of final demand components, the so-called Gama matrix (see
Table 5).
Table 5: Gama Matrix ‐ Primary Input contents of Final Demand Components (%)
1995 2008
C G I Ex C G I Ex
Compensation of employees 27,02 67,46 26,38 32,12 29,05 65,93 28,09 29,12
Operating surplus, gross 35,04 20,79 30,16 31,00 32,31 20,48 24,44 27,31
Indirect taxes less subsidies 14,04 4,08 8,68 1,17 13,18 3,12 9,40 2,07
Use of imported products, cif 23,90 7,67 34,78 35,70 25,46 10,47 38,07 41,51
Source: INE and authors' calculations
One of the most significant structural vulnerabilities of the Portuguese economy is its
large external dependency, patent here in a great import content of final demand,
particularly Exports and Investment. Unfortunately, it is clearly seen in Table 5 that this
weakness has been accentuated between 1995 and 2008, in all the final demand
components, but particularly in the case of Exports, from 36 to 41,5%, and in the case
of Investment, from 35% to 38%. The import content of Consumption is lower,
although showing a slight tendency of increase, from 24 to 25,5%, and the same is true
12 The wage content of Consumption and Investment grows a little in this period, and the
opposite happens in the case of Exports and Public Consumption. In the last case, of
course, this is the main component, with around two thirds.
The operating surplus content, around 30-35% in the private components of final
demand, decays in all cases, which is a worrying trend for the economic health of
Portuguese companies. The indirect taxation content, in turn, is low and relatively
constant in this period.
3.3 Employment Multipliers, Qualifications and Final Demand Components
The productive technology of each sector and the linkages between sectors determine
the importance of each sector in what concerns employment, in the sense that for
increasing production in a given sector more labor force is needed either directly or
indirectly - in this case for producing the inputs needed to increase the production in the
sector.
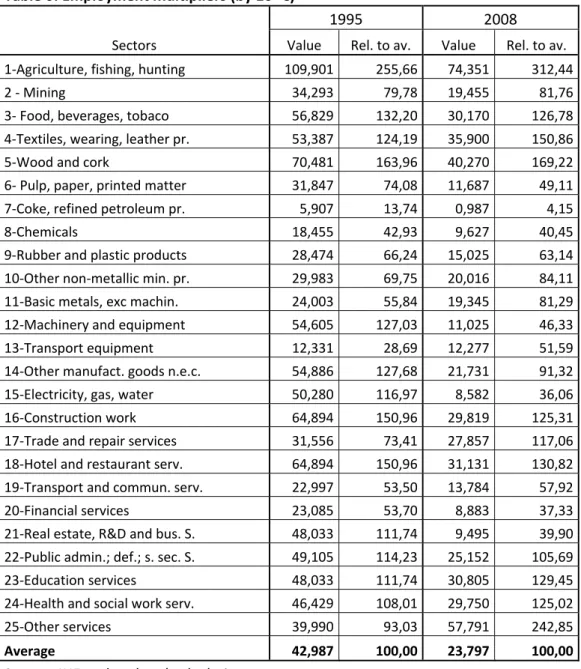
An important indicator of the employment potential of aggregate and sectoral output
changes is the so-called employment multiplier, giving the growth in employment
directly and indirectly generated by a unitary increase in final demand of each sector.
Looking at the values in Table 6, the main conclusion to be drawn is the substantial
decrease in these multipliers, for two reasons. First of all, this is because inflation
reduces the real effects of a given nominal final demand value. Secondly, because the
employment content of production is reduced when an economy grows and develops,
due to the substitution of labour for capital. Combining these two effects on average a
million euro increase in final demand created 43 jobs in 1995 and only 24 in 2008. If we
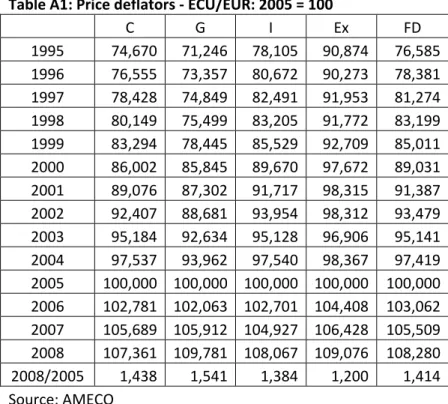
work with 2008 final demand value at constant prices of 1995 (using the deflators
shown in Table A1) the number of jobs created is 33,6 (See Table A2), and so the factor
substitution effect is responsible for -22% in employment creation (-9,4/43).
A comparison of relative employment multipliers by sector, allows us to conclude that
they are large and increasing in Agriculture, (Other) Services, Wood and cork, Textiles,
13 beverages and tobacco, Hotel and restaurant services, and Public Administration, have
large but declining multipliers. The lowest relative multipliers are those of Coke and
refined petroleum products (a very capital intensive sector, of course), Electricity, gas
and water (with a significant decay from 117% to 36% of the average), Financial
services, Real estate, Chemicals and Pulp, paper and printed matter.
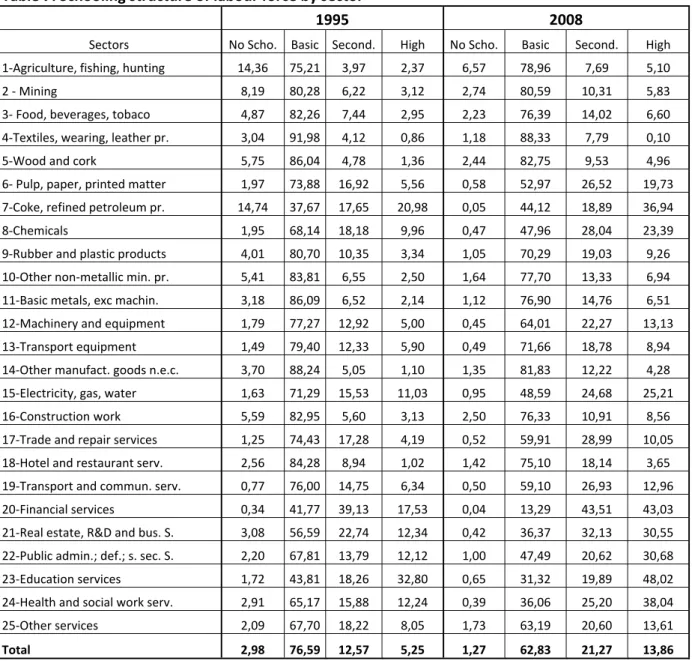
Another important subject is the evolution of the qualification of the labour force, given
by the workers’ education levels. The first thing to note in this case is that for the
overall economy there was a very rapid increase in the content of secondary and high
school in employment, in the thirteen years from 1995 to 2008 (see Table 7).
Table 6: Employment multipliers (by 106 €)
Sectors
1995 2008
Value Rel. to av. Value Rel. to av.
1‐Agriculture, fishing, hunting 109,901 255,66 74,351 312,44
2 ‐ Mining 34,293 79,78 19,455 81,76
3‐ Food, beverages, tobaco 56,829 132,20 30,170 126,78
4‐Textiles, wearing, leather pr. 53,387 124,19 35,900 150,86
5‐Wood and cork 70,481 163,96 40,270 169,22
6‐ Pulp, paper, printed matter 31,847 74,08 11,687 49,11
7‐Coke, refined petroleum pr. 5,907 13,74 0,987 4,15
8‐Chemicals 18,455 42,93 9,627 40,45
9‐Rubber and plastic products 28,474 66,24 15,025 63,14
10‐Other non‐metallic min. pr. 29,983 69,75 20,016 84,11
11‐Basic metals, exc machin. 24,003 55,84 19,345 81,29
12‐Machinery and equipment 54,605 127,03 11,025 46,33
13‐Transport equipment 12,331 28,69 12,277 51,59
14‐Other manufact. goods n.e.c. 54,886 127,68 21,731 91,32
15‐Electricity, gas, water 50,280 116,97 8,582 36,06
16‐Construction work 64,894 150,96 29,819 125,31
17‐Trade and repair services 31,556 73,41 27,857 117,06
18‐Hotel and restaurant serv. 64,894 150,96 31,131 130,82
19‐Transport and commun. serv. 22,997 53,50 13,784 57,92
20‐Financial services 23,085 53,70 8,883 37,33
21‐Real estate, R&D and bus. S. 48,033 111,74 9,495 39,90
22‐Public admin.; def.; s. sec. S. 49,105 114,23 25,152 105,69
23‐Education services 48,033 111,74 30,805 129,45
24‐Health and social work serv. 46,429 108,01 29,750 125,02
25‐Other services 39,990 93,03 57,791 242,85
Average 42,987 100,00 23,797 100,00
14 In 1995, 17,8 % of the employed labour force attained secondary or high schooling and
this percentage almost doubled in 2008 to 35.1%. This is an evolution that is generally
verified among all the sectors, even for agriculture that however still shows in 2008 a
relative high percentage of non-school workers in its employment (6.6%). Agriculture
and Mining were the only sectors that increased the proportion of basic grade but this is
actually a progress since this increase was compensated by a decline in non-school
labour force.
Table 7: Schooling structure of labour force by sector
1995 2008
Sectors No Scho. Basic Second. High No Scho. Basic Second. High
1‐Agriculture, fishing, hunting 14,36 75,21 3,97 2,37 6,57 78,96 7,69 5,10
2 ‐ Mining 8,19 80,28 6,22 3,12 2,74 80,59 10,31 5,83
3‐ Food, beverages, tobaco 4,87 82,26 7,44 2,95 2,23 76,39 14,02 6,60
4‐Textiles, wearing, leather pr. 3,04 91,98 4,12 0,86 1,18 88,33 7,79 0,10
5‐Wood and cork 5,75 86,04 4,78 1,36 2,44 82,75 9,53 4,96
6‐ Pulp, paper, printed matter 1,97 73,88 16,92 5,56 0,58 52,97 26,52 19,73
7‐Coke, refined petroleum pr. 14,74 37,67 17,65 20,98 0,05 44,12 18,89 36,94
8‐Chemicals 1,95 68,14 18,18 9,96 0,47 47,96 28,04 23,39
9‐Rubber and plastic products 4,01 80,70 10,35 3,34 1,05 70,29 19,03 9,26
10‐Other non‐metallic min. pr. 5,41 83,81 6,55 2,50 1,64 77,70 13,33 6,94
11‐Basic metals, exc machin. 3,18 86,09 6,52 2,14 1,12 76,90 14,76 6,51
12‐Machinery and equipment 1,79 77,27 12,92 5,00 0,45 64,01 22,27 13,13
13‐Transport equipment 1,49 79,40 12,33 5,90 0,49 71,66 18,78 8,94
14‐Other manufact. goods n.e.c. 3,70 88,24 5,05 1,10 1,35 81,83 12,22 4,28
15‐Electricity, gas, water 1,63 71,29 15,53 11,03 0,95 48,59 24,68 25,21
16‐Construction work 5,59 82,95 5,60 3,13 2,50 76,33 10,91 8,56
17‐Trade and repair services 1,25 74,43 17,28 4,19 0,52 59,91 28,99 10,05
18‐Hotel and restaurant serv. 2,56 84,28 8,94 1,02 1,42 75,10 18,14 3,65
19‐Transport and commun. serv. 0,77 76,00 14,75 6,34 0,50 59,10 26,93 12,96
20‐Financial services 0,34 41,77 39,13 17,53 0,04 13,29 43,51 43,03
21‐Real estate, R&D and bus. S. 3,08 56,59 22,74 12,34 0,42 36,37 32,13 30,55
22‐Public admin.; def.; s. sec. S. 2,20 67,81 13,79 12,12 1,00 47,49 20,62 30,68
23‐Education services 1,72 43,81 18,26 32,80 0,65 31,32 19,89 48,02
24‐Health and social work serv. 2,91 65,17 15,88 12,24 0,39 36,06 25,20 38,04
25‐Other services 2,09 67,70 18,22 8,05 1,73 63,19 20,60 13,61
Total 2,98 76,59 12,57 5,25 1,27 62,83 21,27 13,86
Note: the totals for each sector and the whole economy are not 100% because the education level of a small number of workers is unknown.
15 On the other side, the sectors with the most qualified labour force are, as expected,
Education services, Financial services, Health and social work services, Coke and
refined petroleum products, Public Administration, defence and social security services,
Real estate, R&D and business services, Electricity, gas and water and Chemicals.
In what concerns the human capital content of the components of the final demand it is
interesting to compare exports with domestic demand components. It is a well
established consensus that one of the effects of globalization is to foster innovation (and
therefore investment in human capital) in the export oriented sectors. This may be true
for the direct needs of exports in human capital. But it is not necessarily true when we
consider also the indirect needs, that is to say, the needs of human capital, of the sectors
that produce inputs for the production of exported products.
The interesting thing to note is that for Portugal exports were in 1995 the component of
final demand with the lowest needs both directly and indirectly of secondary + high
school grades and the progress was modest till 2008 (see Table 9). Adding secondary
and high grades, exports changed their position with investment but with a small
difference.
There is therefore no indication that the stimulus to competitiveness and concomitant
investment in human capital due to globalization had a more significant impact in the
Portuguese economy for the period 1995-2008 than domestic demand.
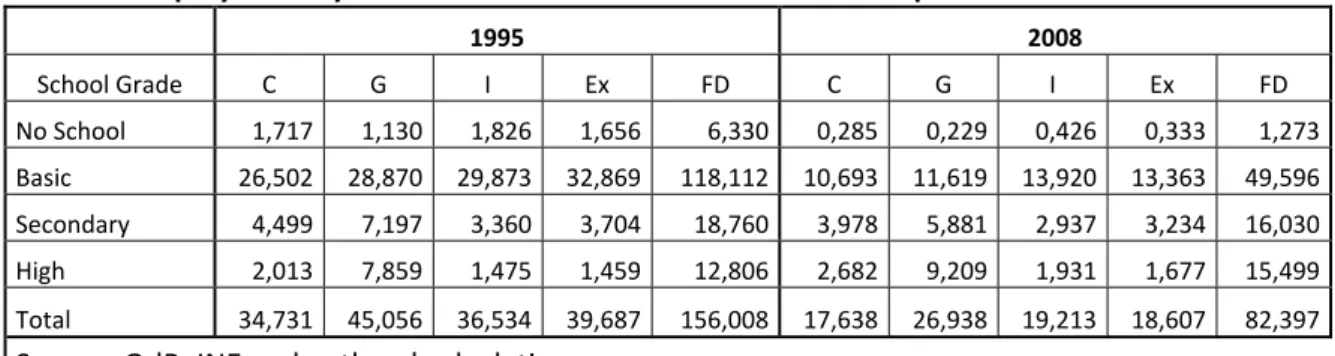
In fact, Public Consumption is by far the final demand component with a large impact
on employment creation as a whole and on more qualified jobs, both in the case of total
(direct plus indirect) effects (see Tables 8 and 9, and Table A.3 for final demand
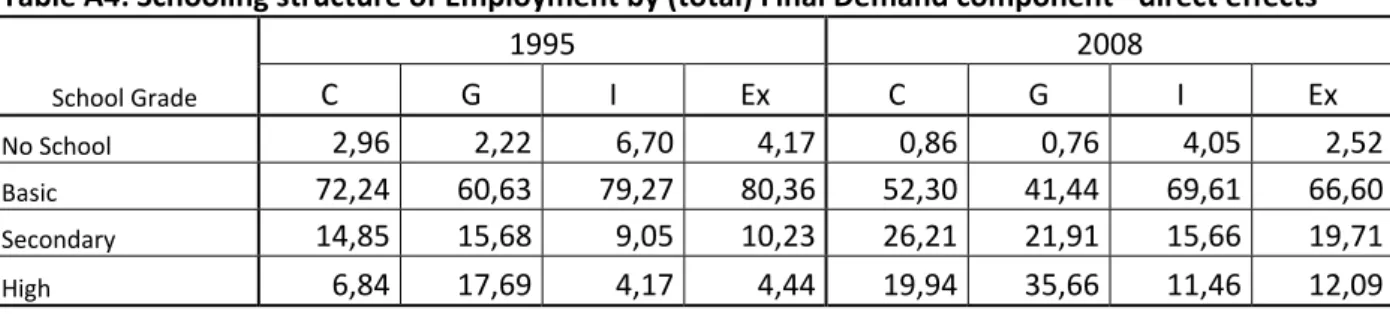
constant price values), as in the case of (only) direct effects (see Table A.4, in Appendix
2). This is an expected result, giving the final demand structure of employment by
school grade, presented in Table 10. For example, of all the workers with high grade
qualifications, around 60% are public employees, slightly above this value in 1995 and
only marginally bellow in 2008. And the second most qualified sector is Private
Consumption, not Investment or Exports, which is a worrying signal, in terms of
efficiency and external competitiveness of the Portuguese economy in a globalized and
16 Table 8: Employment by 106 € directed to each Final Demand component
1995 2008
School Grade C G I Ex FD C G I Ex FD
No School 1,717 1,130 1,826 1,656 6,330 0,285 0,229 0,426 0,333 1,273
Basic 26,502 28,870 29,873 32,869 118,112 10,693 11,619 13,920 13,363 49,596
Secondary 4,499 7,197 3,360 3,704 18,760 3,978 5,881 2,937 3,234 16,030
High 2,013 7,859 1,475 1,459 12,806 2,682 9,209 1,931 1,677 15,499
Total 34,731 45,056 36,534 39,687 156,008 17,638 26,938 19,213 18,607 82,397
Source: QdP; INE and authors' calculations
Table 9: Schooling structure of Employment by Final Demand component
1995 2008
School Grade C G I Ex FD C G I Ex FD
No School 4,94 2,51 5,00 4,17 4,06 1,62 0,85 2,22 1,79 1,54
Basic 76,31 64,07 81,77 82,82 75,71 60,62 43,13 72,45 71,82 60,19
Secondary 12,95 15,97 9,20 9,33 12,02 22,55 21,83 15,28 17,38 19,45
High 5,80 17,44 4,04 3,68 8,21 15,21 34,19 10,05 9,01 18,81
Total 100,00 100,00 100,00 100,00 100,00 100,00 100,00 100,00 100,00 100,00
Source: QdP; INE and authors' calculations
Table 10: Final Demand structure of Employment by School Grade (%)
1995 2008
School Grade C G I Ex FD C G I Ex FD
No School 27,13 17,86 28,85 26,16 100,00 22,38 17,98 33,45 26,19 100,00
Basic 22,44 24,44 25,29 27,83 100,00 21,56 23,43 28,07 26,94 100,00
Secondary 23,98 38,36 17,91 19,74 100,00 24,82 36,69 18,32 20,17 100,00
High 15,72 61,37 11,52 11,39 100,00 17,31 59,42 12,46 10,82 100,00
Total 22,26 28,88 23,42 25,44 100,00 21,41 32,69 23,32 22,58 100,00
Source: QdP; INE and authors' calculations
3.4 Human capital, labour productivity and efficiency: a macroeconomic approach
An interesting macroeconomic result can be drawn from the previous sectoral analysis,
if we could obtain an aggregate index of human capital used in production from the
calculations made so far. The most natural way of doing this is starting from the number
years of schooling, s, weighting each school grade by the minimum number of years
17 Let us consider: No school - 0 years; Basic - 6 years; Secondary - 12 years; High - 16
years. Assuming these number of years and using the elements of the last line in table 7
we get that the average number of years needed to produce final demand in 1995 was:
s = 0.030x0 + 0.766x6 + 0,126x12+0.053x16 = 7.0 years. And for 2008, we have: s =
0.013x0 + 0.628x6 +0,213x12+ 0.139x16 = 8.5 years.
That means that the years of schooling increased 1.6% annually between 1995 and
2008. In the same period, according to Table 11, the annual rate of growth of labour
productivity was 1,23%, so that we can conclude that this increase was lower than the
growth of the years of schooling.
Table 11: GDP per person employed in Portugal (constant prices) 1995 26,543
2008 31,122 Source: AMECO
Consider now the approach of Barro and Lee (2010) where h, that is, human capital is
an exponential function of the number of years of schooling: h = eθs. Starting from a
Cobb-Douglas constant returns function the following equation for the GDP per worker
is given by
ln y = ln A + αln k + (1-α)θs
where y is GDP per worker, k is the stock of physical capital per worker and s the years
of education of the labor force.
Since there is no indication that for the Portuguese economy k /y declined between 1995
and 2008, that is that the derivative (ln k)´ was lower than (ln y)’ this may signal that
there was a decay in total factor productivity.
4. Concluding remarks
This paper studies the structure and evolution of production, employment and human
18 available. The inter-industry approach used is useful for uncovering the main
macroeconomic trends in this period.
Starting with a descriptive analysis of the sector composition of gross output, value
added and employment, the main conclusion to be highlighted is the relative decay of
tradable (agriculture, mining and most manufacturing) sectors and the reinforcement of
non tradable (utilities and service) sectors.
Next, a quantification of changes in relative labour productivity points to a decay in
traditional sectors (agriculture, wood and cork products, textiles and construction work)
and an upgrade of dynamic sectors as coke and refined petroleum products, financial
services, electricity, gas and water and pulp, paper and printed matter.
As about the evolution of employment multipliers, the main conclusion is a substantial
decrease in its values, not only explained by the price effects of calculations in current
prices, but also because of the real employment content of production decay, expected
when an economy grows and develops, due to the substitution of labour for capital, and
confirmed for the Portuguese case using constant price final demand values.
One of the most important indicators studied in this paper was the structure of labour
force qualifications by sector. Although remarkable improvements have been achieved
in the past, the low educational levels of its workers, on average, remains one the main
vulnerabilities of Portugal in the global and knowledge economy of our days. In this
context, the main contribution of the paper is the quantification of human capital
requirements of final demand changes by component.
Using an input-output approach combining sector productivities and labour
qualifications, output multipliers and final demand structure, it is possible to quantify
the growth in employment by level of qualification resulting from a unitary growth of
private and public consumption, investment and exports.
An interesting conclusion is that in the Portuguese case exports were in 1995 the
component of final demand with the lowest needs both directly and indirectly of
19 therefore no indication that the stimulus to competitiveness and concomitant investment
in human capital due to globalization had a more significant impact in the Portuguese
economy for the period 1995-2008 than domestic demand.
On the other hand, public consumption is by far the final demand component with a
large impact on employment creation as a whole and on more qualified jobs, both in the
case of total (direct plus indirect) as in the case of only directed effects. And the second
“most qualified” sector is private consumption, not investment or exports, which is a
worrying signal in terms of efficiency and external competitiveness of the Portuguese
economy in a globalized and knowledge intensive world.
The paper ends with another worrying, macroeconomic, result. After building an
aggregate index of human capital used in production from the sectoral calculations of
the previous sections, an increase of 1.6% annually between 1995 and 2008 emerges.
However, in the same period the annual rate of growth of labour productivity was only
around 1,2%, which signals a weak global (or average) efficiency of the Portuguese
economy in the last fifteen years, possibly due to a slight but continued decay of total
factor productivity.
The data used in the paper are the input-output domestic flow tables from INE and DPP
for the years 1995 and 2008 and employment qualifications from Quadros de Pessoal
database. Additionally, the construction of price deflators necessary for calculating final
demand and labour productivity values at constant prices, was based on AMECO series.
Aknowledgment.
We thank the financial support from national funds given by theFCT (Fundação para a Ciência e a Tecnologia). This paper is part of the Strategic
20
References
Alves, N., M. Centeno and A. Novo (2010), Investment in Education in Portugal:
Returns and Heterogeneity, Economic Bulletin, Banco de Portugal, Spring.
Amaral, J. F. (2013), Porque Devemos Sair do Euro, Lua de Papel, Lisboa.
Amaral, J. F., J. Dias and J. C. Lopes (2012), A new kind of production and value added
multiplier for assessing the scale and structure effects of demand shocks in
input-output frameworks, Annals of Regional Science, 49(1): 103-115.
Barro, R. and J. W. Lee (2010), A new data set of educational attainment in the world,
1950-2010, NBER Working Paper nº 15902.
Chenery, H.B. and T. Watanabe (1958), International Comparisons of the Structure of
Production, Econometrica, 26, 487-521.
Dias A. M., Lopes E. and Félix R. (2001) Estimação de um Sistema de Matrizes para
1995 na Óptica da Produção Efectiva, Documento de Trabalho do Departamento
de Prospectiva e Planeamento, Lisboa.
Dias, A. M. (2009), Sistema Integrado de Matrizes Input-Output para Portugal, 2008
Documento de trabalho. Lisboa, Departamento de Prospectiva e Planeamento e
Relações Internacionais.
Hirshman, A. O. (1958), The Strategy of Economic Development. Yale University Press,
New Haven, CT.
Leão, P. and A. Palacia-Vera (2011), Can Portugal Escape Stagnation without Opting
Out from the Eurozone?, Working Paper No. 664.
Leontief, W. (1951), The Structure of the American Economy, 1919-1939, 2nd ed. New
21 Lopes, J. C. (2012), High Employment Generating Sectors in Portugal: an Interindustry
Approach, International Journal of Latest Trends in Finance and Economic
Sciences, 2(2): 125-135.
Lopes, J. C., J. F. Amaral and J. Dias (2011), External dependency, value added
generation and structural change: an interindustry approach, Notas Económicas,
33,6-19.
Martins N. and S. Barradas (2009), Dinâmicas Territoriais de Crescimento 1995-2006,
Documento de Trabalho nº 9/2009, DPP
Miller, R. E. and Blair, P. D. (2009), Input-Output Analysis: Foundations and
Extensions, Second edition. New York: Cambridge University Press.
Rasmussen, P. N. (1956), Studies in Intersectoral Relations. North-Holland,
Amsterdam.
Reis, H. and A. Rua (2006), An Input-Output Analysis : Linkages vs Leakages,
Working Papers, 17 | 2006, Banco de Portugal.
Reis, R. (2013), The Portuguese Slump-Crash and the Euro-Crisis, Brooking Panel on
Economic Activity, forthcoming, Spring 2013, accessed July 20, 2013, available at:
22
Appendix 1: List of the sectors used in section 3
1- Agriculture, fishing and hunting 2 - Mining
3 - Food, beverages and tobacco
4 - Textiles, wearing and leather products
5 - Wood and products of wood and cork (except furniture) 6 - Pulp, paper and printed matter
7 - Coke, refined petroleum products and nuclear fuels 8 - Chemicals, chemical products and man-made fibers 9 - Rubber and plastic products
10 - Other non-metallic mineral products
11 - Basic metals and metal products, except machinery 12 - Machinery and equipment
13 - Transport equipment
14 - Other manufactured goods n.e.c. 15 - Electricity, gas and water
16 - Construction work 17 - Trade and repair services 18 - Hotel and restaurant services
19 - Transport and communication services 20 - Financial services
21 - Real estate, R&D and business services
22 - Public administration and defence services; compulsory social security services 23 - Education services
23
Appendix 2: Auxiliary Tables
Table A1: Price deflators ‐ ECU/EUR: 2005 = 100
C G I Ex FD
1995 74,670 71,246 78,105 90,874 76,585
1996 76,555 73,357 80,672 90,273 78,381
1997 78,428 74,849 82,491 91,953 81,274
1998 80,149 75,499 83,205 91,772 83,199
1999 83,294 78,445 85,529 92,709 85,011
2000 86,002 85,845 89,670 97,672 89,031
2001 89,076 87,302 91,717 98,315 91,387
2002 92,407 88,681 93,954 98,312 93,479
2003 95,184 92,634 95,128 96,906 95,141
2004 97,537 93,962 97,540 98,367 97,419
2005 100,000 100,000 100,000 100,000 100,000
2006 102,781 102,063 102,701 104,408 103,062
2007 105,689 105,912 104,927 106,428 105,509
2008 107,361 109,781 108,067 109,076 108,280
2008/2005 1,438 1,541 1,384 1,200 1,414
24 Table A2: Employment multipliers (by 106 € ‐ constant prices 1995)
Sectors
1995 2008
Value
Rel. to
av. Value
Rel. to av.
1‐Agriculture, fishing, hunting 109,901 255,66 105,121 312,44
2 ‐ Mining 34,293 79,78 27,507 81,76
3‐ Food, beverages, tobaco 56,829 132,20 42,656 126,78
4‐Textiles, wearing, leather pr. 53,387 124,19 50,758 150,86
5‐Wood and cork 70,481 163,96 56,936 169,22
6‐ Pulp, paper, printed matter 31,847 74,08 16,523 49,11
7‐Coke, refined petroleum pr. 5,907 13,74 1,395 4,15
8‐Chemicals 18,455 42,93 13,611 40,45
9‐Rubber and plastic products 28,474 66,24 21,244 63,14
10‐Other non‐metallic min. pr. 29,983 69,75 28,300 84,11
11‐Basic metals, exc machin. 24,003 55,84 27,351 81,29
12‐Machinery and equipment 54,605 127,03 15,588 46,33
13‐Transport equipment 12,331 28,69 17,358 51,59
14‐Other manufact. goods n.e.c. 54,886 127,68 30,725 91,32
15‐Electricity, gas, water 50,280 116,97 12,133 36,06
16‐Construction work 64,894 150,96 42,160 125,31
17‐Trade and repair services 31,556 73,41 39,386 117,06
18‐Hotel and restaurant serv. 64,894 150,96 44,015 130,82
19‐Transport and commun. serv. 22,997 53,50 19,488 57,92
20‐Financial services 23,085 53,70 12,559 37,33
21‐Real estate, R&D and bus. S. 48,033 111,74 13,425 39,90
22‐Public admin.; def.; s. sec. S. 49,105 114,23 35,561 105,69
23‐Education services 48,033 111,74 43,554 129,45
24‐Health and social work serv. 46,429 108,01 42,062 125,02
25‐Other services 39,990 93,03 81,708 242,85
Average 42,987 100,00 33,645 100,00
25
Table A3: Employment by 106 € directed to each (total) Final Demand component (constant prices 1995)
1995 2008
School Grade C G I Ex FD C G I Ex FD
No School 1,717 1,130 1,826 1,656 6,330 0,402 0,353 0,589 0,400 1,744
Basic 26,502 28,870 29,873 32,869 118,112 15,081 17,904 19,260 16,040 68,285
Secondary 4,499 7,197 3,360 3,704 18,760 5,611 9,062 4,063 3,882 22,618
High 2,013 7,859 1,475 1,459 12,806 3,783 14,190 2,671 2,013 22,657
Total 34,731 45,056 36,534 39,687 156,008 24,876 41,509 26,584 22,334 115,303
Source: QdP; INE and authors' calculations
Table A4: Schooling structure of Employment by (total) Final Demand component ‐ direct effects
School Grade
1995 2008
C G I Ex C G I Ex
No School 2,96 2,22 6,70 4,17 0,86 0,76 4,05 2,52
Basic 72,24 60,63 79,27 80,36 52,30 41,44 69,61 66,60
Secondary 14,85 15,68 9,05 10,23 26,21 21,91 15,66 19,71
High 6,84 17,69 4,17 4,44 19,94 35,66 11,46 12,09