Mestrado em ECONOMETRIA APLICADA E PREVISÃO
ECONOMETRIC ANALYSIS OF PRIVATE
MEDICINES EXPENDITURE IN PORTUGAL
MÓNICA SOFIA INÁCIO DUARTE INÊS
Orientação
NICOLETTA ROSATI
Constituição do Júri
JOSÉ M. M. PASSOS (Presidente)
MIGUEL R. A. GOUVEIA (Vogal)
NICOLETTA ROSATI (Vogal)
Resumo
O Serviço Nacional de Saúde Português estabelece que o acesso a cuidados de saúde deve depender essencialmente das necessidades clínicas. Condicionado nas necessidades individuais, o acesso e utilização de medicamentos não deveria depender de factores económicos como rendimento, classe social, nível de educação ou o acesso a farmácias ou postos de vendas de medicamentos. Utilizando dados das últimas duas realizações do Inquérito Nacional de Saúde (1995/96 e 1998/1999), este estudo testa a existência de inequidades nas despesas com medicamentos, condicionadas na necessidade, relacionadas com o rendimento, com a densidade de farmácias e com possuir seguro de saúde privado ou relacionado com o local de trabalho. Foi aplicado um modelo em duas partes. Para a probabilidade individual de efectuar despesas com medicamentos, foi adoptado um estimador LOGIT modificado para acomodar a dupla natureza dos zeros da variável dependente e que permitisse assimetria. Para modelar as despesas positivas com medicamentos foram utilizadas as propriedades da pseudo verosimilhança através da utilização de um modelo de Poisson. Não se detectou má especificação do modelo em duas partes e concluiu-se que existem inequidades na despesa privada com medicamentos relacionadas com a existência de seguro de saúde privado ou relacionado com o local de trabalho, o rendimento e a densidade de farmácias.
Classificação JEL: C21, C5, I18
Abstract
The Portuguese National Health System states that access to health care should depend mainly on need. Conditional on need, access to pharmaceuticals should not depend on socio-economic factors such as income, social class, education or geographical factors such as the access to pharmacies. This study uses data from the last two waves of National Health Survey (1995/1996 and 1998/1999) and focuses on equity issues testing for the existence of insurance inequalities, income-related and pharmacies density related inequalities. A two-part model was adopted. To model the probability of occurrence of medicines private expenditure, a modified LOGIT model was specified accounting for the double nature of the zeros of the dependent variable and asymmetry. In the second part a Poisson pseudo maximum likelihood estimator was adopted. No misspecification was detected in the two-part model. The main results showed inequity in Portuguese private medicines expenditures with respect to supplementary health insurance (private and job related), income and pharmacies density.
JEL classification: C21, C5, I18
INDEX
1. INTRODUCTION... 9
2. PORTUGUESE HEALTH CARE SYSTEM... 12
2.1. REGULATION OF THE PHARMACEUTICAL MARKET... 12
2.2. MEDICINES EXPENDITURE... 17
3. DATA AND VARIABLES... 19
3.1. PORTUGUESE NATIONAL HEALTH SURVEY... 19
3.1.1. VARIABLE DEFINITIONS... 22
3.2. EXTERNAL DATA... 36
3.3. SUMMARY STATISTICS... 37
4. EMPIRICAL MODEL... 42
4.1. ECONOMETRIC SPECIFICATION... 42
4.2. ONE-PART MODEL... 47
4.3. TWO-PART MODEL... 50
4.4.1 PART ONE... 51
4.4.2 PART TWO... 54
4.4.3 INFERENCE WITH 2PM... 55
4.4. ESTIMATION RESULTS... 57
5. CONCLUSION... 69
APPENDIX A... 71
TABLE INDEX
Table 1. PNHS areas and relevant research variables ... 20
Table 2. Private expenditure on medicines – euro. (N= 97767) ... 23
Table 3. Private expenditure on medicines (euro) by sub-sample. Individuals aged 18 years and older... 25
Table 4. Summary statistics of non-need variables (N=41601) ... 38
Table 5. Summary statistics of need variables (N=41601) ... 40
Table 6. Summary statistics of dependent variable and major research variables (N=41601) ... 41
Table 7. 2PM, estimation results. Non-need variables. ... 60
Table 8. 2PM, estimation results. Need and major research variables... 63
Table 9. Average partial effects, major research variables. ... 67
FIGURE INDEX Figure 1. Portuguese NHS medicines expenditure. Primary care setting... 17
Figure 2. Histogram of non-zero private medicines expenditure (N=23475). Individuals with 18 years of age and older. ... 23
Figure 3. Histogram of the logarithm of non-zero private medicines expenditure. Self-respondents versus Proxy-respondents. Individuals with 18 years of age and older. ... 25
Figure 4. Histogram of individual’s age years. Self-respondents with 18 years of age and older. ... 30
Figure 5. Histogram of number of school years. Self-respondents with 18 years of age and older. 33 Figure 6. ‘S’ curve, model specification with asymptote. ... 52
Figure 7. 2PM Part One: age-band estimated coefficients. ... 61
ABREVIATIONS AND DEFINITIONS
Abbreviation Definition
2PM Two-part model
ADSE Insurance plan that covers Portuguese civil servants
APE Average partial effect
BMI Body mass index
CAR Coarseness at random
EU European Union
GPML Gamma pseudo-maximum-likelihood
ICD-9-CM International classification of diseases, 9th Revision, clinical modification INE Portuguese national statistical institute
INFARMED Portuguese regulatory agency for medicines
JRHS Job-related health system
LAU Local administrative units (for statistics)
LPM Linear probability model
MAR Missing at random
NHS National health system
NLS Non-linear least squares
NUTS Territorial units for statistics
OECD Organisation for economic co-operation and development
OLS Ordinary least squares
OTC ‘Over the counter’ medicine
PHI Private Health Insurance
PNHS Portuguese national health survey
PPML Poisson pseudo-maximum-likelihood
SAMS Insurance plan that covers Portuguese bank employees
sd Standard deviation
WHO World Health Organization
ZIM Zero inflated models
ACKNOWLEDGEMENTS
Access to Portuguese National Health Survey is gratefully acknowledged. Portuguese National Health Survey explanations were kindly provided by Carlos Dias (ONSA - National Observatory of Health).
Special thanks are due to Prof. Nicoletta Rosati for the dedicated supervision and to Prof. Montezuma Dumangane for the clarification of some specification issues. Thanks are also due to Félix Bernardo, Filipa Duarte-Ramos, Kathrin Schneider, Marta Soares, Pedro Saramago, Teresa Bago d'Uva and Tiago Lopes for their constructive comments and suggestions. Finally, I am grateful to my family for their unconditional support.
This research has also benefited from participation in the “Applied Health Economics” course under the Marie Curie Training Program - June 2006, hosted by the Health, Econometrics and Data Group/University of York. Attendance, travel and accommodation expenses were funded by the European Union.
Previous analysis were presented under the title “Pseudo-Panel Data Framework: Evidence from the National Health Survey – Portugal” at the 22nd International Conference on Pharmacoepidemiology & Therapeutic Risk Management held in Lisbon, Portugal, August 2006.
Comme un fou se croit Dieu,
nous nous croyons mortels.
1. INTRODUCTION
The Portuguese pharmaceutical sector is currently undergoing a legislative reform in the supply and financing of medicines. The sustainability of the Portuguese pharmaceutical sector is endangered by increased access to health care and supply of services, and by the increasing costs of the health resources. The political imperatives underneath these changes are wide ranging and include the ultimate desire to sustain public expenditure on medicines while benefiting from higher efficacy/safety for more recent and expensive medicines. It is also believed that the cost-sharing formula between patients and the National Health System (NHS) should be improved in order to deliver optimal utilisation of medicines, more according to individual health needs. Recent government decisions point at the pharmaceutical market as a primary target of policy control/regulation aiming at a reduction in health care expenditure. Facing these difficulties, prices have been reduced and NHS cost-sharing formula with patients has been modified recently.
The Portuguese National Health System states that access to health care should depend on need. Conditional on need, the utilization of medicines should not depend on socio-economic factors such as income, social class, education, or geographical factors such as the access to pharmacies and medical doctors. There is horizontal inequity when health care utilisation is shaped by non-need variables
and if there is still scope for inequality. Hence, studies focused on the expenditure on medicines are of great importance to identify the determinants of private expenditure and detect the existence of inequity.
This study has two main motivations.
1. The first motivation is to contribute to current knowledge, within the current Portuguese Health System reform process, through the study of private medicines expenditure in Portugal, using the most recent data available from Portuguese National Health Survey (PNHS). Within this evaluation it is also possible to account for the supply of health services, in particular, density of pharmacies, at area of residence level, a factor that is often excluded from analyses mainly due to the lack of data, and has increased importance under current Portuguese pharmaceutical market reforms. Alongside income-related inequity and geographical-related inequity are estimated. To our knowledge, it is the first study to model Portuguese individual private expenditure with medicines.
2. The second motivation is clearly analytical, revisiting an economist’s old and increasingly frequent problem: how to obtain consistent estimates, under unknown forms of heterogeneity. Nonlinear models are common in health economics since measures of outcomes are often based on limited dependent variables. This research faces the challenge of adopting the most appropriate econometric specification in order to avoid inconsistent estimators of the model parameters, aware that the extent of the inconsistencies will depend both on the specific characteristics of the sample and the model adopted.
2. PORTUGUESE HEALTH CARE SYSTEM
The Portuguese National Health System (NHS), established in 1979 (Law 56/1979), constituted a crucial step towards the pursuit of equity, introducing the universal coverage for health care, nearly free1, financed by general taxation. The Portuguese government statement of equity is compatible with the principle of ‘‘equal opportunity for those in equal need’’ (Pereira, 1990).
Most of Portuguese NHS patients are registered with a general practitioner, who can diagnose diseases, prescribe medicines and manage chronic conditions. General practitioners acts like ‘gatekeeper of the system’ and only prescribed medicines are reimbursed by the NHS. Since 1994, the NHS also reimburses prescriptions from private doctors. Medicines private expenditure is deductible up to 30% under the Portuguese Taxation System.
The pharmaceutical market is complex and has some country-specific features. This chapter gives some insights on Portuguese regulation, expenditure and financing of medicines in order to enlighten the underlying process that generates individual private expenditure on medicines.
2.1. REGULATION OF THE PHARMACEUTICAL MARKET
The economic regulation of the pharmaceutical market in Portugal focuses mainly in distribution, prices and reimbursement.
Distribution
1
Drugs restricted to medical prescription are only sold in pharmacies but in 2005 the government has approved the sales of ‘over the counter’ (OTC2) medicines in other licensed establishments such as supermarkets special areas and health related commercial areas (Law 134/2005).
Ownership of pharmacies (for restricted medical prescription drugs) is limited to pharmacists, and licensing of new establishments is issued by INFARMED (Portuguese regulatory agency for medicines) based on a maximum number of pharmacies per inhabitants, being the geographic distance to existing pharmacies also a criteria.
However, the Portuguese government is at the moment undergoing reforms to liberalize ownership of pharmacies and increase the current number of pharmacies by 300 new units (Portuguese Government, 2006) and extend the pharmacies opening hours from 40 to 55 hours per week (Law 53/2007).
Prices
The revenue of pharmacies and wholesalers in the sale of prescription medicines (as proportion of the market price) is limited and regulated by the Ministry of Economy, as well as the maximum market price authorized, bounded by the minimum of the prices established in Spain, Italy and France (Law 29/90).
Recently, the medicines price mechanism suffered changes with the inclusion of Greece in the group of reference price countries and the use of the average price to set the upper bound of Portuguese price (Law 65/2007).
Nevertheless, the government regulated a compulsory global down pricing of 6% in September 2005 (Law 618-A/2005) and a second global down pricing of 6% by
2
January 2007 (Law 30-B/2007 and Law 2496/2007), which was justified with the sustainability of global Portuguese expenditure with medicines.
Reimbursement
Once the Ministry of Economy has established the maximum market price, NHS reimbursement is discussed at Ministry of Health/INFARMED who can require an economic evaluation study of the medicine (Law 19064/1999) in order to allow a more informed decision.
In some circumstances, NHS reimbursement can be conditioned by the total number of individuals to be treated or reimbursement only occurs if the medicine Portuguese market price is reduced. A positive decision from INFARMED will make the medicine drug reimbursed by the NHS.
National Health System
The medicines reimbursement scheme of the Portuguese National Health System is essentially structured on the therapeutic indications of each drug medicine (Law 1474/2004), yielding five basic levels3 of reimbursement: 100, 95, 70, 40 and 20 percent.
The 95% reimbursement level was introduced in 2005, when the 100% reimbursement level was shortened in order to keep only life-saving medicines. The 20% reimbursement level is defined as transitory (Law 205/2000) and it was introduced in 2000 with the aim of accommodate drug medicines with less efficacy/effectiveness evidence.
3
As established in the 2007 Portuguese Budget (Portuguese Government, 2006), three of the five reimbursement levels of NHS were reduced recently from 70, 40 and 20 percent to 69, 37 and 15 percent respectively.
Since 1992, and to overcome some recognized income-related inequality in medicines utilization, the Portuguese government introduced a special reimbursement status for the elderly with retirement funds below minimum national wage, adding up to 15% to the basic medicines reimbursement rate (Law 118/1992). Alongside to this special group, Portuguese National Health System introduced over the years an exemption reimbursement status characterized with full reimbursement (100%) to all primary care medicines needed by patients with major particular clinical diseases such as lupus, paramyloidosis, thalassaemia, sickle cell disease or haemophilia.
Job-Related Health Systems
A non-trivial part of the Portuguese population benefits from double health care expenditures coverage. This pattern of coverage is due to the maintenance of Job-Related Health Systems (JRHS) of health coverage established in the previous social insurance system, prior to 1979. Many of these systems are financed by public funds.
The JRHS provide medicines co-payments on the following format i) medicines direct co-payment4 instead of NHS reimbursement, ii) medicines co-payment following the NHS reimbursement or iii) co-payment of medicines that are not currently reimbursed by the NHS and that would be hardly affordable as private expenditure.
4
Private Health Insurance
The private health insurance (PHI) is often understood as a possible approach of addressing some health system challenges given its position as an alternative source of health care financing.
Colombo and Tapay (2004) refer that “private health insurance presents both opportunities and risks for the attainment of health system objectives and it has also given rise to considerable equity challenges in many countries”.
Indeed, increased access to private insurance can promote greater health care utilisation (Jones, 2007) mainly due to:
i) Moral hazard effect: the level of utilization is greater when insurance decreases the private out-of-pocket cost of health care. ii) Risk reduction effect: the chosen level of utilization is greater
under the financial certainty created by insurance.
iii) Access effect: insurance may provide access to expensive medical technologies that would not be affordable otherwise. These three factors will be jointly analyzed as the insurance effect on utilisation.
The study by Jones et al. (2007) on the impact of supplementary private health insurance on the number of specialist visits reported a positive insurance effect, concluding that private insurance contributes to ‘pro-rich’ inequality. The research used data from the European Community Household Panel for Ireland, Italy, Portugal, Spain and the UK.
2.2. MEDICINES EXPENDITURE
Over the last years, the Portuguese government applied several policies intended to sustain public expenditure on medicines.
According to the INFARMED statistical information on medicines (INFARMED, 2001), the per capita annual expenditure has greatly increased: between 1995 and 1999 it grew from 165.27€ to 235.99€, about 70.7€ per capita. After reforms implemented in recent years, the pharmaceutical market reached a total of 3105 million euros in 2005, equivalent to 294.29€ per capita. In ten years, the total annual medicines expenditure per capita increased 78%.
The Portuguese National Health Service is financed mainly through general taxation and as depicted in Figure 1 is facing increasing expenditure on medicines.
0 200 400 600 800 1.000 1.200 1.400 1.600 19 80 19 81 19 82 19 83 19 84 19 85 19 86 19 87 19 88 19 89 19 90 19 91 19 92 19 93 19 94 19 95 19 96 19 97 19 98 19 99 20 00 20 01 20 02 20 03 20 04 20 05 20 06 E u ro s ( m illion s )
Figure 1. Portuguese NHS medicines expenditure. Primary care setting. Source: General Health Department (DGS 1980-1994) and Infarmed (1995-2006).
expenditure and a proportion of this expenditure was covered a posteriori by private health insurance schemes. However, in 1997, private insurance accounted for only 1.7% of total private financing health sources (Gouveia Pinto and Aragão, 2004). Recent data (Vaz et al. 2006) pointed out that nearly 20% of the total expenditure on medicines occurs without any direct cost-sharing scheme (NHS, JRHS our PHI) and as out-of-pocket expenditure. Portugal is identified as having one of the highest ratios of private - public financing of health care in the EU (Pereira, 1999).
Barros (1998) investigated the ‘black box of health care expenditure growth determinants’ in 24 OECD countries and concluded that health system characteristics often reported as determinants of health expenditures such as aging population, type of health system and the existence of gatekeepers are found to be non-significant. Gouveia Pinto and Teixeira (2002) points out that the Portuguese increasing pharmaceutical expenditure is mostly due to the prices of new pharmaceuticals. Oliveira and Gouveia Pinto (2005) analysed the content and impact of policies designed to reform the Portuguese health system between 1979 and 2002 and concluded that, despite the great improvement in health outcomes, the Portuguese health system is barely achieving its goals, mainly in terms of the equity of access and utilisation. Therefore, two important research questions arise:
What are the determinants of medicines expenditure? Can we disentangle between different types of inequity?
3. DATA AND VARIABLES
The research results depend upon the econometric model specification chosen and the list of covariates used. In order to investigate horizontal inequity it is essential to differentiate between need variables, which shape the use of health care and non-need variables that in equitable systems, should not affect it. Underlying the research is a set of value judgements about the factors that reflect
need and the factors that reflect non-need. It is recognised that different value judgements may influence results about the existence of inequity (Morris, 2005).
In the first section of this chapter the Portuguese National Health Survey is described. In the second section the definition of the variables used in the econometric model specification is explained.
3.1. PORTUGUESE NATIONAL HEALTH SURVEY
The Portuguese National Health Survey (PNHS) is jointly carried out by the Health Ministry, National Institute of Health ‘Dr. Ricardo Jorge’, National Observatory of Health and the National Statistical Institute. Four national rounds have been completed until present: 1986/1987, 1995/1996, 1998/1999 and 2005/20065.
Unfortunately micro data from the most recent survey (2005/2006) is not yet available for research due to the ongoing data validation process.
Table 1 presents the major research areas covered by PNHS, over its waves. The second column reports some of the main variables included in the models. It can be perceived that this survey has great richness of information on health status, health care use and lifestyles. Dental Health related questions were only available on the 1998/1999 wave.
5
Table 1. PNHS areas and relevant research variables
PNHS wave
Area Relevant Research Variables 1986/ 1987
1995/ 1996
1998/ 1999
Socio-demographic Gender, age, area of residence,
education, employment status x x x
General health status Weight and height 2
, self-assessed
health3, insurance coverage x x
Acute illness or injury Number of days with daily activities
limited due to illness or injury x x x
Longstanding illness Type of daily limitations and health
condition associated x x x
Chronic conditions
Specific chronic conditions such as diabetes, asthma, bronchitis, allergy, high blood pressure, back pain with
medical/nursing diagnose confirmation
x x x
Health care use Medical visits, use of sleeping pills x x x
Dental health x
Health care expenditure and income
Expenditure on medicines and household
total net monthly income x x x
Tobacco Use Smoker behaviour x x x
Food intake and drink
behaviour Drinking behaviour x x x
Children Health1 x x x
Physical Activity2 Practise of exercise x x
1 – Less than 5 years of age
2 – Respondent with 18 years of age and older 3 – Self-respondent with 15 years of age and older
Some of the variables of the first national survey were measured in different scales from those used in the subsequent waves and information on other variables was not even collected (e.g. private insurance). Therefore, 1986/1987 data was not included in this research. The 1995/1996 and 1998/1999 waves of the Portuguese National Health Survey were collected during May 1995 - April 1996 and October 1998 - September 1999, respectively.
The sample was representative of the five regions6 of continental Portugal: Norte, Centro, Lisboa and Vale do Tejo, Alentejo and Algarve. The island regions of Açores and Madeira were excluded from both surveys. Households were selected randomly from the 1991 population census, with local interviewers asked to follow pre-determined instructions (Ministério da Saúde, 1998).
Sampling rates were adjusted in each part of the year, in order to incorporate seasonal differences (Ministério da Saúde, 2001). The samples included participants who lived in private households (collective housing, e.g., hospitals and retirement houses were excluded).
Face to face structured interviews were held with all individuals who lived in the selected household, including non-family members. An appointed member of the household was asked to provide information on behalf of absent household members at the time of the interview. Little is known about non-respondents and external sources of data are not available to assess the representativeness of the sample. The overall response rate was 88% in 1995/1996 and 82% in 1998/1999. The Health Ministry validated the answers by repeating the interview in 10% of the initial sample (Ministério da Saúde, 2001).
The PNHS data set has been subject to a number of empirical studies by researchers (Giraldes, 2003; Marques-Vidal and Dias, 2005a; Marques-Vidal and Dias, 2005b; Vidal and Dias, 2006; Vidal, 2006a; Marques-Vidal, 2006b) although the majority of these projects are analyses focused on lifestyles, routines or epidemiologic measures such as disease prevalence estimation. Given the richness of information, health economics research making use of PNHS data is very interesting. Recent research conducted by Barros et al.
(2005) use the 1998/1999 PNHS data in order to estimate the impact of health
6
insurance coverage beyond National Health Insurance on the demand for several health services. Lourenço and Ferreira (2004) have analysed the income effect on the demand for dental health care and Lourenço et al. (2006) have focused on health care utilization (number of visits).
3.1.1. VARIABLE DEFINITIONS
Empirical analyses of demand for health care have mostly used reduced form equations as specification models for health care utilisation, depending on need, socio-economic variables, and demographic characteristics (Jones, 2007a). Van Doorslaer et al. (2004) and Jones et al. (2007) specify models for medical care, which include insurance plan, health status, socio-economic and demographic variables. Empirical studies of drug utilisation, such as Grootendorst (1995) and Street et al. (1999), control for age, eligibility for reimbursement, insurance status, health status, employment and demographic variables. Following these examples explanatory variables related to morbidity (clinical need), socio-economic status, and demographic characteristics were selected in order to characterize Portuguese individual medicines expenditure.
Dependent variable
The dependent variable (Y) results from the question on the expenditure on medicines in the 2 weeks before the survey. The data was originally measured in
escudos (former Portuguese currency, until the introduction of the European currency, in 2002: 1 euro = 200,482 escudos) and then converted into euros. The PNHS 1995/1996 data on Y was updated to 1999 global health prices, using the medicines and pharmaceutical products price index (INE, 2006): between 1996 and September 1999, prices of medicines increased 4.2%.
expenditure on medicines in this short period: 76% had no expenses and only 10% report positive expenditure above 19.96 euros. Table 2 shows detailed statistics on private expenditure on medicines.
Table 2. Private expenditure on medicines – euro. (N= 97767) Y summary statistics
Mean 5.62 €
Minimum 0 €
Maximum 1647.60 €
Standard Deviation 16.70
Variance 278.73 Skewness 17.45
On average, respondents reported 5.62 euros (sd 16.70 euros) of expenditure on medicines in the two weeks preceding the survey. Figure 2 shows a positively skewed empirical distribution of the nonzero realizations of Y, with 99% of PHNS respondents reporting a positive expenditure inferior to 72.76euros.
0 20 40 60 80 10 0 Pe rc e n t (% )
0 500 1000 1500 2000
Private Medicines Expenditure (euro)
X X X X X X X X X
0 20 40 60 80 10 0 Pe rc e n t (% )
0 500 1000 1500 2000
Private Medicines Expenditure (euro)
X X X X X X X X X
Figure 2. Histogram7 of non-zero private medicines expenditure (N=23475). Individuals with 18 years of age and older.
7
The most important determinant of expenditure on medicines is like to be the need for those medicines, which was accounted for with a wide range of health indicators available in the PNHS pooled data set.
Proxy respondents
The PNHS information about children or absent household members at the time of the interview was obtained from other appointed household member. Within the respondents over 15 years of age, the self-response rate was 69.89% in the PNHS pooled data. Other surveys that allowed proxy respondents were exploited in empirical models such as in Grootendorst (1995), Street et al. (1999) and Morris et al. (2005). Here a dummy variable was coded for control of this large number of proxy response: PROXRESP equals 1 if the individual do not give the answer, 0 if self-response.
The PNHS sample strategy presents several problems. The major identified issue is the existence of measurement error in the dependent variable. Although it may be possible that a proxy respondent is able to characterize socio-economic-demographic characteristics of absent household members, it is rather unlikely that the proxy respondent provides accurate information on private medicines expenditure or in crucial covariates such as need-variables.
For simplicity, the group of individuals whose responses were given by other household member will be here onwards named “Proxy-respondents”.
Table 3. Private expenditure on medicines (euro) by sub-sample. Individuals aged 18 years and older. Y summary statistics Self respondents Proxy respondents
Mean 7.65€ 4.78€
Minimum 0€ 0€
Maximum 1647.60€ 748.20€
Standard Deviation 19.64 15.41
Variance 385.63 237.39
Skewness 18.74 10.15
As reported in Table 3, the unconditional mean of private expenditure on medicines is 37.5% lower in the proxy-respondents sub-sample. Moreover, the histogram of the logarithm of non-negative values of Y depicted in Figure 3, indicates that the proxy-respondents sub-sample suffers from heaping. The logarithm scale was chosen to show the histograms due to the large skewness of the dependent variable (Figure 2).
0 5 10 15 P er c ent ( % )
-5 0 5 10
Ln (Private Medicines Expenditure) Self-respondents 0 5 10 15 P er c ent ( % )
-5 0 5 10
Ln (Private Medicines Expenditure) Proxy-respondents
Figure 3. Histogram of the logarithm of non-zero private medicines expenditure. Self-respondents versus Proxy-respondents. Individuals with 18 years of age and older.
and Augustin, 2003). Wolff and Augustin (2003) and Bernardo (2007) have analyzed the impact of dependent heaped duration data in non-linear models concluding that disregarding these measurement errors will result in asymptotically biased estimators.
Therefore, in this research, the econometric models will concentrate on the sub-sample of PNHS self-respondents as approached by Barros et al. (2005) and Lourenço and Ferreira (2004).
The PNHS sampling scheme uses households as primary sampling units; once a household is included in the sample, all individuals in that family are interviewed. Since there is at least one self-respondent individual in each family, none of the initially chosen families is excluded from the analysis of self-respondents, maintaining the validity of the sampling process of the PNHS.
Need Variables
Acute Illness
A set of dummy variables is used to capture whether the individual is hampered by any health condition. This variable results from the question about the number of days in the last 2 weeks with limitations in daily activities due to illness or injury. The answer was coded as:
• NOTHAMP if the individual reported zero days;
• MILDHAMP if the individual reported less than 4 days;
• MODHAMP if the individual reported 4 to 13 days;
• SEVHAMP if the individual reported 14 days (maximum coded).
SEVHAMP category was coded to capture health conditions coded in the upper bound of the number of days with limitations in daily activities due to illness or injury that can be more severe than temporary illness.
Specific Illnesses and Chronic Conditions
Information on specific cause of illness in the last two weeks, the cause of having at least one medical visit in the three months preceding the survey and the cause of having ear/eye complaints or verbal communication limitations was included. The underlying cause of these limitations was coded in both PNHS waves under the International Classification of Diseases, 9th Revision, Clinical Modification (ICD-9-CM8).
Other survey information on specific chronic diseases such as asthma, diabetes, bronchitis, allergies, high blood pressure, back pain, urinary tract complaints and sleeping disturbances (proxy question was taking medication to sleep) was also included according to their classification under ICD-9-CM.
The variable ACCIDENT equals 1 if the observed health limitation was due to accident, 0 otherwise. If it is not the accident case, a set of dummies variables was created to capture the individual specific co-morbidities. Each dummy equals 1 if observed health limitation is related to a specific ICD-9-CM category, 0 otherwise. This set of dummies is not mutually exclusive and the individuals can report different number of co-morbidities. Given some less frequent morbidities reported such as “Infectious and Parasitic Diseases”, “Neoplasm”, “Blood and Blood-Forming Organs”, "Complications of Pregnancy and Childbirth ", "Skin and Subcutaneous Tissue", "Congenital Anomalies" and "Certain Conditions of the Perinatal Period", the variable Other Diseases is an aggregate dummy that equals
8
1 if observed health limitation is related to one of the above health conditions, 0 otherwise.
Medical Visits
Reported morbidities measures are used to capture the individual need from medicines but it can be reasonable to admit that some unobserved component on morbidity is positively correlated with individuals past visits to medical doctors. Moreover, general practitioners acts like gatekeepers in the Portuguese health system and medicines expenditure is often the consequence of a medical prescription. Alongside these arguments, an indicator of whether the individual had at least one visit to a doctor in the previous 3 months (VISITMD) was included in the set of need variables.
Self-Reported General Health
Self-assessed health (SAH) was measured on a five-point scale ranging from ‘‘very good’’ to ‘‘very poor”. SAH is a simple subjective measure of health that gives an ordinal ranking of self-perceived health status. Health economics literature refers self-assessed health as a major health outcome (Jones, 2004). This variable has also been shown to be a powerful predictor of mortality (Idler and Kasl 1995; Idler and Benyamini 1997). SAH has been extensively used in previous researches of the relationship between health and use of medical care (Grootendorst, 1995; Van Doorslaer, 2004; Morris, 2005; Barros, 2005) and between health and socioeconomic status and lifestyles (Contoyannis and Jones, 2004; Balia and Jones, 2007).
Healthy Lifestyles
appropriate to account for individual lifestyles. Lifestyles were considered as a set of behaviours, which can influence health and the need for medicines. Four indicators of whether the individual has healthy lifestyles were included in the covariate set:
• NOALCOHOL equals 1 if the individual has not consumed alcohol9 in the last year or at utmost does it one time per week, 0 otherwise;
• NOOBESE equals 1 if the individual has a body mass index (BMI10) lower than 25 kg/m2, 0 otherwise;
• EXERCISE equals 1 if the individual currently practises physical exercise or has daily activities with physical effort such as walking, climbing/descending stairs and carrying heavy objects, 0 otherwise;
• NOSMOKER equals 1 if the individual currently does not smoke tobacco, 0 otherwise.
Non Need Variables
Gender
The sex of the individual is considered using the dummy variable FEMALE, in order to account for sex-specific health care requirements and preferences. A common result in studies of health care utilisation is that women use it more frequently, even after controlled for need. The determinants of health care, or its effects, can also vary by gender (Grootendorst, 1995; Bago d’Uva, 2005; Morris, 2005), which could also motivate splitting the analysis.
Age
If the morbidity measures are not as accurate as desired to capture all of the individual need from health care, some authors argue that the age factor (AGYRS)
9
Alcohol includes wine, beer, brandy, liquors and whisky or gin. 10
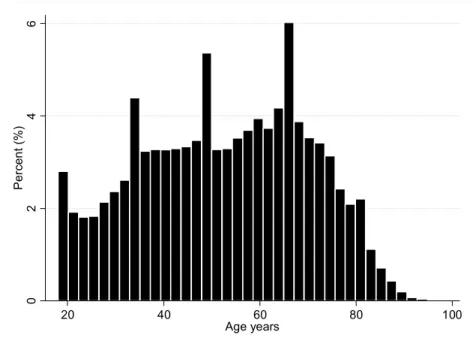
can account for this ‘imperfect measurement of health status’ (Bago d’Uva, 2005). However, as depicted in Figure 4, the PNHS variable age has abnormal11 concentrations at some values: the distribution of the reported age has strong spikes which certainly result from measurement error.
This phenomenon is common in survey data and is referred in the literature as age heaping: e.g. respondents often approximate their true age using some digit preference (Heitjan and Rubin, 1990). Hence, the age variable can suffer from several types of coarseness. In a study concerning children from Tanzania, Heitjan and Rubin (1990) were confronted with age peeks at six month multiples and used multiply imputed data in order to accomplish their research without having to confront the interfering issues of heaped age.
0
2
4
6
Pe
rc
e
n
t (
%
)
20 40 60 80 100
Age years
Figure 4. Histogram of individual’s age years. Self-respondents with 18 years of age and older.
11
Another issue concerning age years and medicines expenditure is that children’s pathways to care are distinct from those of adults (Deb and Holmes, 2000): usually they do not take their own decisions regarding health care utilisation and hence it was decided to include in the model sample only individuals aged 18 years and older.
Therefore, in order to attenuate the age heaping effect, age is here represented by seven categories:
• AGE1824 equals 1 if 18 ≤ AGYRS ≤ 24, 0 otherwise;
• AGE2534 equals 1 if 25 ≤ AGYRS ≤ 34, 0 otherwise;
• AGE3544 equals 1 if 35 ≤ AGYRS ≤ 44, 0 otherwise;
• AGE4554 equals 1 if 45 ≤ AGYRS ≤ 54, 0 otherwise;
• AGE5564 equals 1 if 55 ≤ AGYRS ≤ 64, 0 otherwise;
• AGE6574 equals 1 if 65 ≤ AGYRS ≤ 74, 0 otherwise;
• AGE75 equals 1 if AGYRS ≥ 75, 0 otherwise.
This approach allows for a flexible relationship between age and medicines expenditure, without impose a linear or polynomial function, while it attenuates the major age spikes observed in the histogram.
Portuguese Region (area of residence)
Individual drug expenditures, even conditional on need and other factors, can differ between geographical regions due to differences such as medical prescription patterns or attitudes towards health care expenses. Continental Portugal was divided into five main geographical regions with a mean population of 1943469 residents (range 375841 to 3621210) in the year 1999. The variable region of residence12 was represented by five categories LISBOAVT, CENTRO, NORTE, ALENTEJO and ALGARVE using a set of mutually exclusive set of dummies.
Marital status
Marital status has been incorporated in previous studies of the use of medical health care (Manning and Mullahy, 2001; Bago d’Uva, 2005). The individual marital status is here considered with a set of dummies: SINGLE, WIDOW, DIVSEP and MARRIED. DIVSEP equals 1 if the respondent reports divorced or separated, 0 otherwise.
Education
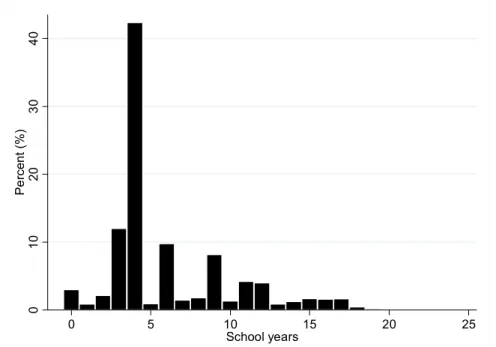
The total number of completed school years (SCHLYRS) is frequently used to control for education in models for health care use. Figure 5 shows the empirical distribution of the number of completed school years reported in the PNHS sample. As depicted, the PNHS variable number of completed school years has high concentrations at particular values: the percentage distribution showed spikes at 3, 6 and 9 completed school years and a very strong spike at 4 completed school years. The Portuguese mandatory number of school years changed through the last decades from four to nine years. Hence, these spikes can account for the behavioural pattern related to the Portuguese mandatory education.
12
0
10
20
30
40
Pe
rc
e
n
t (%
)
0 5 10 15 20 25
School years
Figure 5. Histogram of number of school years. Self-respondents with 18 years of age and older.
Therefore, formal education was included in the model using the PNHS question on graduate level achieved where education is measured by a set of dummies: NOSCHL for children not yet in school, individuals unable to read or write and individuals with basic skills in reading and writing, BASICSCHL for basic school (until 9th grade), SECSCHL for secondary school (10th to 12th grade) and GRADSCHL for university degree or more.
Employment status
PNHS respondents were asked whether they have worked in the two weeks before the survey and the non-working cause was recorded. Employment status is here measured by a set of dummies: EMPLOYED, UNEMPLOYED, RETIRED, DISABLED and OTHERUNEMP.
dummy equals 1 if the respondent was not working and was currently unemployed or searching for the first employment.
RETIRED equals 1 if the respondent was not working and is retired, waiting for retirement or has a retirement fund. DISABLED equals 1 if the respondent was not working and is disabled. DISABLED also incorporate individuals who reported long standing severe physical limitations such as being confined to bed, to a wheel chair or to their own house.
OTHERUNEMP equals 1 if the respondent was not working and his ‘employment status’ was keeping house, student, undertaking military service, living from rents or interests or was not working due to other unspecified reasons.
Time Variable
A time dummy was also incorporated in the covariates set: T1 equals 1 if the individual participated in the 1998/1999 survey, 0 otherwise.
T1 can account for the changes between 1996 and 1999 in the set of medicines prescribed for each health condition that embrace e.g. the on-going replacement of old-less-expensive medicines by new medicines, with more safety and efficacy but usually at higher prices. The time variable can also capture the effect of multiple events that affect the prescription, use and expenditure with medicines. Some pharmacotherapeutic guideline’s changes such as the reduction in critical limits of glycaemia to undertake pharmacologic treatment with antidiabetics or the reduction of cholesterol levels in prescription guidelines to initiate the treatment with statins.
Major research variables
The effects of factors such as income, pharmacies density and additional health insurance (private or job-related) on conditional expected value of Portuguese private medicines expenditure are a major research interest.
Health Insurance
The potential effect of health insurance on demand for health care was taken into account using information about additional voluntary insurance coverage: PHI=1 if the individual is covered by a private health insurance plan, 0 otherwise. It should be noticed that the PNHS information does not make it possible to differentiate between private insurance purchased voluntarily by the individual or a private health insurance plan provided by the employer. The dummy variable JRHI=1 measures whether the individual is covered by a specific Portuguese job-related health insurance plan such as ADSE13, SAMS13 or others.
Income
The income variable is derived from the disposable income of the whole household (i.e. after deductions for income tax and mandatory national insurance). Total household income includes all net monetary income received by the household members during the previous month. It includes income from work, private non-work income such as interests or rents, pensions and other direct social transfers received (e.g. children social support).
The information was collected according ten household income bands of different widths. The last income category is an open-end top band. The approach of Morris
et al. (2005) was followed in order to compute individual income from the PNHS household income bands.
13
The median level of household income within each band was the chosen measure of household income for all individuals within each band. The mean and standard deviation parameters of the log normal distribution were determined by minimising the sum of squared differences between actual and generated numbers of a log normal distribution in each band. The average income was calculated as the value of half the cumulative density within each band.
The estimate of household income for each individual whether adult or child was then equivalised to allow for differences in household size and composition using the Organization for Economic Co-operation and Development (OECD) modified scale. This scale gives a weight of 1 to the first adult, 0.5 to any other household member aged 14 and over, and 0.3 to each child under 14 in the household. The modified OECD scale replaced the original OECD scale (first adult person weight of 1.0, additional adult 0.7, children 0.5), which had been extensively used and was known previously as the Oxford scale.
The PNHS1995/1996 equivalised income was updated to 1999 prices making use of the consumer price index (INE, 2006) that registered a 10,40% increase between years 1996 and 1999. The natural logarithm of the equivalised income (LNINC) was chosen to be the income measure, like in other health care use econometric studies (Van Doorslaer, 2004; Morris, 2005).
3.2. EXTERNAL DATA
Supply of health services can still be determinant in medicines utilisation but it is often excluded from empirical analysis, mainly due to lack of data. To account for access to health services, the data set was augmented with external information on pharmacies and pharmacies extensions14 density (PHD) at LAU 115 level.
14
Currently and as regulated by INFARMED a pharmacy is open to cover at least 4000 inhabitants. In 1999, Continental Portugal was divided into 278 districts, with a mean population of 34954 residents (range 1904–580436) and a mean number of 10 pharmacies (range 1–340 pharmacies) per district.
Pharmacies density
Pharmacies density was incorporated in the models by the number of pharmacies
per 4000 inhabitants. The data on the number of pharmacies, pharmacies extensions and population statistics at district level was obtained from Portuguese National Statistical Office. The lowest density (0.4 pharmacies per 4000 inhabitants) was obtained in the Fafe district, with 5 pharmacies that supply drug medicines to 51597 inhabitants. However, the Crato district has 5 pharmacies and a lower current number of inhabitants: 4356.
3.3. SUMMARY STATISTICS
responses are coded as “missing values” in the PNHS dataset. Non-responses occur when an individual responds to the survey as a whole but does not answer to a particular question. If observations with missing values are systematically different from those who respond to the question then we have potential sample selection bias. However, if the missing values occur at random (MAR), the observations with missing values for at least one of the variables used in the model could be dropped without major inference repercussions.
The final data set includes 41601 individual self-respondents records observed in the pooled PNHS sample. For clarity of presentation, the summary statistics for the variables included in the econometric models are presented by three subsets of
15
variables: non-need variables (Table 4), need variables (Table 5) and dependent variables plus major research variables (Table 6).
Table 4. Summary statistics of non-need variables (N=41601)
Group Variable Variable
Proportion
Gender Female 0.613
Age1824 0.065
Age2534 0.119
Age3544 0.160
Age4554 0.171
Age5564 0.194
Age6574 0.187
Age
Age ≥ 75 0.103
Lisboa and Vale do Tejo 0.259
Centro 0.211
Norte 0.280
Alentejo 0.143
Portuguese Region
Algarve 0.107
Married 0.732
Single 0.122
Widow 0.120
Marital Status
Divorced or separated 0.026
No school 0.222
Basic school (until 9th grade) 0.641 Secondary school (10th to 12th grade) 0.065 Education
Graduate school (university degree or more) 0.072
Employed 0.484
Otherunemp (includes keeping house, student, undertaking military service, living from rents or interests and other)
0.194
Unemployed 0.043
Retired 0.278
No n Need V a ri ab les Employment
Disabled (also includes individuals being confined to bed, to a wheel chair or to their own house)
0.001
Other
Time (1999 wave) T1 0.505
dummy variable were included for each category. Jointly, the omitted categories highlighted in the tables by grey shading, define the ‘reference individual’.
The reference individual is self-respondent, male, between 18 and 24 years old, live in the Lisboa and Vale do Tejo region, is employed, married, has only basic skills in reading and writing, has not been hampered by his health condition in the last two weeks, has not visited a medical doctor in the past three months, has very good SAH, practises exercise, does not smoke tobacco, is not obese, does not consume or consumes alcohol prudently, has been surveyed in the 1995/1996 wave and does not have private insurance or any job-related insurance.
Table 4 shows that 61.3 per cent of the self-respondents sample are women and that the individuals between 55 and 64 age years are the largest group, with 19.4 per cent of the sample. Most of the respondents live in the Norte region (28 per cent) and the majority are married (omitted category) followed by those who are single (12.2 per cent) at the time of the survey. A large proportion of the sample has education qualifications until the 9th grade (64.1 per cent) and is employed (omitted category, 48.4 per cent) followed by those who are retired (27.8 per cent). From the self-respondents, 50.5 per cent has responded to the survey in the 1998/1999 wave.
69.7 practises exercise, 83.3 per cent does not smoke and 61.1 per cent does not consume alcohol or does it prudently.
Table 5. Summary statistics of need variables (N=41601)
Group Variable Variable Proportion
Not hampered (0 days) 0.875 Mildly hampered (0 < days ≤ 3) 0.056 Moderately hampered (3 < days ≤ 13) 0.031 Acute Illness (number of days in
the last 2 weeks with limitations in daily activities due to illness or
injury)
Severely hampered (14 days) 0.038
Accident 0.017
Endocrine and Metabolic 0.087 Mental Disorders 0.019
Nervous System 0.034
Circulatory System 0.275 Respiratory System 0.166 Digestive System 0.064 Genitourinary System 0.097 Musculoskeletal System 0.553 Symptoms and Signs 0.249 Injury and Poisoning 0.148 Illnesses and Chronic Conditions
(ICD-9M classification)
Other Diseases 0.057
Visit medical doctor Visitmd 0.599
Very Good 0.025
Good 0.269
Fair 0.433
Poor 0.220
Self-Assessed Health (SAH)
Very Poor 0.054
Exercise 0.697
Non obese 0.472
Non smoker 0.833
Need
V
a
ri
a
b
les
Healthy Lifestyles
Non alcohol heavy behaviour 0.611
Table 6. Summary statistics of dependent variable and major research variables (N=41601)
Group Variable
Variable
Mean (Std. Dev.)
or proportion Min Max
Y - private medicines expenditure
in the last 2 weeks (euro). 7.607 (19.763) 0.00 1647.60
D
e
pe
nde
nt
Va
ri
a
b
le
DY, equals 1 if Y ≥ 0, 0 otherwise. 0.314 (0.464) 0 1
Job-related health insurance JRHI 0.164 0 1
Private health insurance PHI 0.044 0 1
Equivalised income Income (euro) 374.107 (253.035) 40.30 1966.33
Logarithm equivalised income LNINC 5.739 (0.599) 3.70 7.58
M
a
jo
r Research
V
a
ri
ab
le
s
Pharmacies density PHD (number pharmacies/ 4000
inhabitants) 1.301 (0.597) 0.39 4.09
4. EMPIRICAL MODEL
Econometric analysis of the determinants of expenditure on private expenditures on medicines is relevant and crucial given the current reforms the Portuguese NHS is undergoing. Conditional on individual need and other socio-economic and demographic factors, this research has three main objectives:
i) To test for income-related inequity; ii) To test for pharmacies density inequity; iii) To identify the existence of insurance effects.
In order to achieve these purposes through an econometric framework it is necessary to use a consistent estimator, to be able to make valid inference about the parameters of interest.
In the first section of this chapter, the model specifications are discussed and in the last section the estimation results are presented.
4.1. ECONOMETRIC SPECIFICATION
Health economists know a priori that many outcomes of interest require non-standard empirical methods. Examples are health care expenditures, length-of-stay, health care use and others. Manning and Mullahy (2001) characterize such data by:
i) Non-negative measurements of the outcomes;
ii) Positively skewed empirical distribution of the nonzero realizations; iii) Nontrivial fraction of zero outcomes.
data conditions, nor have they provided an algorithm for choosing among the alternatives (Santos Silva and Tenreyro, 2006).
Non-negative measurements and positively skewed empirical distribution
The pattern exhibited by private medicines expenditures is non-trivial to analyse given that we deal with a continuous non-negative variable with a skewed positives distribution, as showed in Figure 2 which reveals the long and heavy right tail of the empirical distribution. Classical econometric methods, such as OLS are clearly inappropriate. The literature on count data modelling deals frequently with patterns similar to this and solutions are encountered. However, given the non-integer characteristic of the dependent variable, a suitable specification is a challenging question.
Nontrivial fraction of zero outcomes
It is worth mentioning the large proportion of zero observations in the data sample: 68.78% of the self-respondents report zero expenditures with medicines in the previous 2 weeks. This high proportion cannot be ignored in the analysis and it represents an additional study challenge.
The large fraction of zero outcomes in the sample can be due to the time frame in PNHS instrument, which can be too short to capture all private expenditure on medicines taken in that period. Part of the zero values can actually correspond to healthy individuals and be captured by the model, but other zeros can refer, for instance, to individuals that suffer from chronic conditions. For e.g. individuals with heart disease (undertaking daily medications) can purchase their drug medicines for three months or more (three monthly packages) and hence can report zero expenditure in the last two weeks.
per cent reimbursement) was not included as a covariate due to lack of information. Hence, individuals that purchased medicines with 100 per cent reimbursement or individuals suffering from diseases with exemption status (100 per cent reimbursement to all medicines) can also report zero expenditure, for all the time frame considered. INFARMED statistics report 6.4% and 7.8% as the proportion of drug medicines reimbursed at 100% by the NHS in the years 1996 and 1999.
Summarising, zero expenditure can either be due to a healthy condition, or to a illness that implies purchase of medications for periods longer than 2 weeks or entitlement to full reimbursement. Therefore, zero outcomes can have different natures:
i) Zero medicines expenditures due to healthy conditions and remaining socio-economic-demographic characteristics;
ii) Zero outcomes due to the inability of the PNHS question to capture existent positive expenses;
iii) Zero outcomes due to the Portuguese reimbursement schemes (not controlled for).
Therefore, the chosen econometric specification cannot ignore the different nature of the zero private medicines expenditure and should, in fact, explicitly account for these data characteristics. However, given the available data, the zeros from nature ii) and iii) cannot be identified separately and these zeros will be jointly mentioned as “extra zeros” and the “double nature of the zero outcomes” will justify the models used.
Zero Inflated Models
However, this research focuses on private medicines expenditure (Y), a continuous dependent variable and hence a methodological challenging and crucial question arises:
Given the need to incorporate a fraction of extra zeros, which econometric specification should be modified in order to accommodate this data specificity?
Consider health care demand measured in terms of private medicines expenditure (Y), which is assumed to depend on a set of observable exogenous16 explanatory variables, denoted by the vectorx. Let us denoteπ the fraction of extra zeros.
The central research questions involve the conditional expected value, denoted
byE
[ ]
Y x , and its associated partial effects( )
[ ]
xx Y E x
∂ ∂ =
δ . The effects of factors
such as income (LNINC), pharmacies density (PHD) and private health insurance (PHI) on conditional expected value of Portuguese private medicines expenditure are of major interest in this study.
Density functions for non-negative continuous random variables such as Lognormal, Gamma, and Weibull exclude zero from their support. Moreover, continuous densities do not allow a positive mass at any peculiar value in their supports such as the zero value (Deb and Trivedi, 2002). Thus, in the continuous case, there exists no density that can account specifically for the fraction π of extra zeros. Consequently, it is not possible to devise a continuous version of the zero inflated Poisson (ZIP), popular econometric specification for data with large fraction of zero counts. For this same reason, in a mental disorders expenditures determinants study, Deb and Holmes (2000) extend a finite mixture model, in the
16
continuous case, only to the sample of individuals with strictly positive expenditures.
A recent research of Santos Silva and Tenreyro (2006) implemented a set of experiments to model a continuous variable in order to study alternative estimators under different forms of heteroskedasticity with the presence of rounding errors in the dependent variable. They proposed a Poisson pseudo-maximum-likelihood estimator (PPML) to model bilateral trade. The idea of using the Poisson framework to obtain consistent estimates is very attractive and will be assessed to incorporate the degenerate fraction π of zeros.
Another econometric strategy to deal with excess zeros problem have been two-part models (2PM) or hurdle models extensively applied in the past (Grootendorst, 1995; Street, 1999; Lourenço and Ferreira, 2004) to model skewed outcomes data, usually with large amounts of zero observations. Here, the process that determines the binary decision is different from the process that determines the amount of expenditure once the hurdle is crossed (Deb and Trivedi, 1997). In the case of health care use, the motivation for two-part models comes from the ‘principal-agent’ theory of demand, which suggests that the individual initially chooses whether to seek treatment, but once in treatment it is the physician who determines the medicines to be taken.
Hence, two major and competing econometric strategies will be here considered to account for the π extra zeros in the data sample:
• One-part model: PPML;
4.2. ONE-PART MODEL
The fundamental propriety of the private medicines expenditure conditional mean is thatE
[ ]
Y x must clearly be positive:E[ ]
Y x >0, since all observations of y are non-negative. Therefore, the popular Ordinary Least Squares (OLS) estimator will not be considered in the one-part specification discussion.However, the log OLS specification, widely used in empirical studies, is the benchmark for strictly positive expenditure data and for the second part of 2PM specifications (Street, 1999; Lourenço and Ferreira, 2004). In this empirical application, estimating the parameters of interest by OLS using log-linear model is actually unfeasible given the zero values of pharmaceutical expenditure for more than 60% of the individuals.
Given the basic propriety of conditional mean, E
[ ]
Y x >0, a natural starting (Mullahy, 1998) stochastic model can be formulated as,(
iβ)
εii x
y =exp + (1)
with yi≥0 for i=1,2,…, N, whereE
[ ]
εi x =0. For notation simplicity, the index i is dropped from here onwards.[ ]
Y x( )
xVar =σ2υ (2)
where υ
( )
x is the variance function. Manning and Mullahy (2001) enunciated someparticular forms of υ
( )
x that originates special cases,i) υ
( )
x =1, the homoskedastic nonlinear regression model (variance of y conditional onx is given only by σ2and it is unrelated tox); ii) υ( )
x =k1µ( )
x;β , the ‘Poisson-like’ structure where k1>0 and thevariance is proportional to the mean, which is itself a function of x;
iii) υ
( )
x =k2(
µ( )
x;β)
2, the ‘Gamma-like’ structure where k2>0 andthe standard deviation is proportional to the mean.
Poisson Pseudo-Maximum-Likelihood
Santos Silva and Tenreyro (2006) analyzed several estimators to model the continuous variable bilateral trade, including log-linear OLS, non-linear least squares (NLS), gamma pseudo-maximum-likelihood (GPML) and the new proposed Poisson pseudo-maximum-likelihood (PPML). These authors pointed out that, under the assumption that Var
[ ] [ ]
Y x ∝EY x , the parameters β could be estimated solving the first-order conditions,(
)
[
exp]
01
=
∑ −
=
n
i i i i
x x
y β (3)
which is numerically equivalent to the Poisson pseudo-maximum-likelihood estimator, extensively used in count data empirical modelling since the summation on the left-hand side of equation (3) has expectation zero ifE
[ ]
Y x =exp( )
xβ .to be Poisson distributed or even integer. This is a very interesting econometric strategy to model non-integer data such as expenditures, since it is consistent, reasonably efficient under a wide range of heteroskedasticity patterns as tested by Santos Silva and Tenreyro (2006) and straightforward to implement. Windmeijer et al. (2006) applied this estimator to model schizophrenia expenditures in a cost-efectiveness study.
The PPML model should be modified to add the inflate parameter π accounting for the degenerated distribution onY =0, making use of the following set of mixture probabilities denoted asPM,
(
0 , ,)
(
1)
(
0 ,)
0Pr = = + − = =
= Y x P Y x y
PM β π π π β
(
, ,)
(
1)
(
,)
1,2,3,...Pr = = − = =
= Y yx P Y yx y
PM β π π β
(4)
In the case of count data, maximum-likelihood estimation allows identification of both parameters π andβ. However, to use pseudo-maximum-likelihood results we need to specify the conditional expected value, which in this case is given by
[
Y x β π]
(
π) ( )
xβ(
(
π)
xβ)
E , , = 1− exp =expln1− + (5)
It is clear that if a constant term is present in the linear combinationxβ , this cannot be identified separately from the term ln
(
1−π)
therefore, in the case of non-count data, the zero-inflated Poisson cannot be used; otherwise the π proportion cannot be identified.however, it cannot be used due to the double nature of the zero values present in the data, since we are interested in estimatingπ.
Another option is to use Non Linear Least Squares (NLS), since it is an asymptotically valid estimator for the equation (5). It is defined by
[ ]
= ∑[
−(
−) ( )
]
=n
i
x yi
1
2
exp 1
min arg ˆ ,
ˆ π π β
β (6)
However, this estimator can be very inefficient as it ignores the heteroskedasticity that is present in this type of data. The NLS estimator is optimal when the variance of y conditional onx is given by a constant, hence unrelated tox. In practise, this
is an unrealistic hypothesis and the form of Var
[ ]
Y x is usually unknown17. This estimator it is not frequently used in empirical applications due to its considerable inefficiency.A one-part specification will not satisfy the purposes of this research namely the estimation of the extra fraction of zeros by an estimator consistent in the presence of heteroskedasticity and efficient. Hence, the option for a two-part specification is considered.
4.3. TWO-PART MODEL
Another common choice for data with large amounts of zero outcomes has been two-part models (Mullahy, 1998) where a two-part regression is performed, first modelling the binary outcome and then the non-zero values in a standard linear regression.
17