EFFECT OF SIZE, TOASTING DEGREE AND TIME OF
EXTRACTION ON THE VOLATILE COMPOSITION OF A
MODEL WINE SOLUTION TREATED WITH AMERICAN
OAK CHIPS
NÚRIA FERRÉ BORONAT
Dissertation to obtain the degree of
European Master of science of Viticulture and Enology
Advisor: Prof. LUCA ROLLE – Università degli studi di Torino
Assistant: Prof. JORGE RICARDO DA SILVA – Universidade de Lisboa
Jury:
President: Carlos Manuel Antunes Lopes (Phd), Associate Professor with habilitation,
at Instituto Superior de Agronomia, Universidade de Lisboa.
Members: Luca Rolle (Phd), Professor at Universitá degli Studi di Torino; Manuel José
de Carvalho Pimenta Malfeito Ferreira (Phd), Assistant Professor, with aggregation at
Instituto Superior de Agronomia, Universidade de Lisboa; Sofia Cristina Gomes
Catarino (Phd), Invited Assistant Professor at Instituto Superior de Agronomia,
Universidade de Lisboa.
2
AKNOWLEDGEMENTSI would like to express my deepest appreciation to all those who provided me the possibility to complete this report. A special gratitude to my two supervisors Luca Rolle and Jorge Ricardo da Silva, whose contribution in stimulating suggestions and encouragement helped me to coordinate my project.
Furthermore I would also like to acknowledge with much appreciation the crucial role of the staff of DISAFA Food Science and Technology, who gave the permission to use all required equipment and the necessary materials to complete the task. A special thank to Matteo Pollon, who let me be part of this project and shared with me all his knowledge. I have to appreciate the suggestions and comments given by Sofia Cristina Gomes Catarino, Carlos Manuel Antunes Lopes and Manuel José de Carvalho Pimenta Malfeito Ferreira as well as all the people from Montpellier SupAgro, Universidade de Lisboa and Università degli studi di Torino who helped me in this paper.
3
ABSTRACTThe volatile compounds released by different types of oak chips differing in size and toasting degree were studied using a model wine solution. The volatile composition on three different stages of a simulated extraction was analyzed. Thirty-two diverse oak related volatile compounds were found using a GC/MS. The concentration of all compounds increased during the extraction time. The light toast chips reported higher concentrations of lactones (35% of the total compounds concentration). The lactones were diminishing their concentration while the toast degree was increasing reporting approximately 0,58% of the total amount of compounds in the high toast chips. Intensive toasting degrees conferred greater quantities of benzenic and furanic compounds. Benzenic compounds were always found in larger amounts than the rest and its concentration in volume was increasing as the toasting degree was intensifying. The benzenic compounds comprise the 61% of the total amount of compounds in light toast and their concentration increased up to 94% in high toast. The size factor did not interfere on the quantity of aroma compounds released by the oak chips according to Principal Component Analysis results. The toasting degree had an influence on the type and quantity of oak derived compounds.
KEY WORDS: American oak chips, volatile composition, GC-MS, toasting.
RESUMO
Estudaram-se os compostos voláteis libertados em soluções modelo tipo vinho com diferentes tipos de aparas de madeira diferindo no tamanho e grau de tosta. A composição volátil em três estágios diferentes de uma extração simulada foi analisada. Trinta dois distintos compostos voláteis relacionados com a madeira foram identificados e quantificados por GC/MS. A concentração de todos os compostos aumentou ao largo do tempo. As aparas de tosta ligeira originam maiores concentrações de lactonas (35% da concentração total). As lactonas diminuíam enquanto o grau de tosta crescia com aproximadamente um 0,58% da quantidade total de compostos em tosta alta. A tosta intensa conferisse maiores quantidades de compostos benzênicos e furânicos. Os compostos benzênicos eram sempre encontrados em quantidades maiores que o resto e a sua concentração em volume aumentava enquanto o grau de tosta aumentava. Os compostos benzênicos eram o 61% dos compostos totais em tosta ligeira e a sua concentração aumentou até 94% em tosta alta. O tamanho não interferiu na quantidade de compostos aromáticos liberados pelas aparas. O grau de tosta teve influência sobre o tipo e a quantidade dos compostos provenientes da madeira de carvalho.
4
RESUMO ALARGADOO uso de alternativos de madeira em vinho tem aspectos positivos que podem resolver algumas das desvantagens relatadas com o uso de barricas de carvalho. As alternativas de madeira conferem compostos voláteis e não voláteis semelhantes aos das barricas de carvalho e permitam introduzir compostos derivados da madeira para vinhos com baixo potencial de envelhecimento. A procuração de alternativas de carvalho causou uma mudança na indústria do vinho especialmente nos países do “novo mundo”. Os mais antigos produtores, como a Itália, também incorporaram essas alternativas no processo de fábrica de vinhos. Varias empresas como o AEB group (Brescia, Itália) estão produzindo alternativos de carvalho e outras madeiras investindo em pesquisa para avaliar o seu impacto em enologia.
De acordo com o presente trabalho, foram estudados em soluções modelo tipo vinho oito modalidades com aparas de carvalho. As aparas de tosta ligeira originaram uma maior quantidade de lactonas. As lactonas são encontradas em concentrações mais altas em aparas em comparação com os barris de carvalho, portanto, um aroma a madeira e coco ,mais forte pode ser detectado em vinhos tratados com aparas de tosta ligeira. A madeira de América também é conhecida como uma maior quantidade desses compostos.
As aparas de carvalho estudadas forneceram grandes quantidades de compostos benzénicos, sendo a vanilina e o siringaldeído, as duas moléculas com os valores mais altos. Os compostos benzénicos aumentaram sua concentração, consequentemente, de leve a alto grau de tosta no caso das aparas de pequenos tamanhos. O comportamento de aparas de grande tamanho foi ligeiramente diferente, com maiores concentrações de compostos benzénicos na modalidade de tosta media. Esses compostos conferem o aroma a baunilha. Os compostos furanicos estão presentes, embora em concentrações mais baixas. Esses resultados podem ajudar na escolha das aparas mais apropriadas dependendo do estilo de vinho desejado.
O factor tamanho das aparas não afectou a quantidade de compostos voláteis libertados pelas aparas de carvalho. O grau de tosta tem influência no tipo e quantidade de compostos voláteis e conseguintes aromas com origem na madeira de carvalho encontrados nas diferentes modalidades realizadas. O tempo da maceração pode influenciar o volume de compostos voláteis, pois aumenta enquanto a maceração avança.
5
TABLE OF CONTENTS
1. INTRODUCTION ... 7
1.1. THE USE OF OAK IN WINEMAKING ... 7
1.1.1. The oak origin and the species used in winemaking ... 7
1.1.2. Natural and artificial wood seasoning ... 8
1.1.3. Wine chemical modifications occurring during ageing ... 9
1.1.4. Advantages and disadvantages of using oak ... 9
1.2. THE USAGE OF OAK CHIPS AS AN ALTERNATIVE TO WOOD BARRELS... 10
1.2.1. The origin of oak wood alternatives addition ... 11
1.2.2. Literature review regarding oak chips ... 11
1.3. OAK WOOD VOLATILE COMPOUNDS ... 12
1.3.1. Reactions affecting oak wood volatile compounds during toasting ... 13
1.3.2. Volatile compounds found in oak chips ... 14
1.4. AIM OF THE WORK ... 14
2. MATERIALS AND METHODS ... 15
2.1. OAK CHIPS ... 15
2.2. MODEL WINE SOLUTION ... 17
2.3. EXPERIMENTAL DESIGN ... 17
2.3.1. Schema of the experimental procedure followed in laboratory ... 17
2.3.2. Details and explanation of the experimental design ... 19
2.4. CHEMICAL ANALYSIS ... 20
2.4.1. Extraction of volatile compounds ... 20
2.4.2. Gas-chromatography analysis ... 23
2.5. STATISTICAL ANALYSIS ... 24
3. RESULTS AND DISCUSSION ... 25
3.1. INFLUENCE OF THE TIME OF EXTRACTION ON THE VOLATILE COMPOUNDS CONCENTRATION ... 25
3.2. INFLUENCE OF THE TOASTING DEGREE ON THE VOLATILE COMPOUNDS RELEASED ... 29
3.3. MULTIVARIATE DATA ANALYSIS ... 33
4. CONCLUSIONS ... 37
6
LIST OF FIGURES AND TABLESTable 1. Composition of American and European oaks. Table extracted from Gunther (1986). ________ 13 Table 2. Values of the height, length and depth of medium+ and light toast small chips. ____________ 15 Table 3. Size measuraments (height, length and depth) for medium+ toast and medium toast large chips. ___________________________________________________________________________________ 16 Table 4. Schema of the experimental procedure followed during the experiment. ___________________ 20 Table 5. Name and distribution of the volatile compounds found during all the experiment. _________ 25 Table 6. Volatile compounds concentration in three different days of a simulated extraction. _________ 28 Table 7. Sum of the total amount of volatile compounds found on day 18 on large and small size chips.. 30 Table 8. Variance percentage of the 7 PC explained by the stadistical program PAST. ______________ 33 Table 9. Data submited to Principal Component Analysis ____________________________________ 34
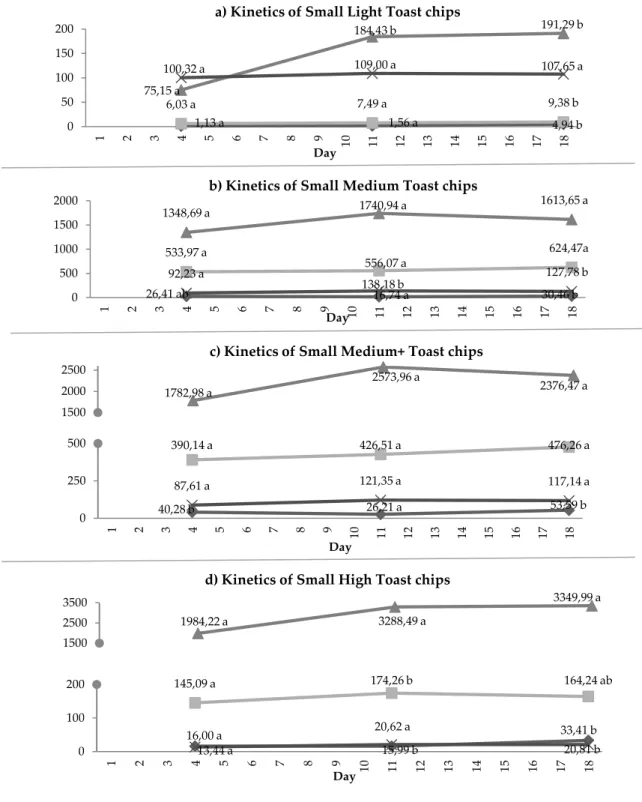
Fig. 1a. Kinetics of the small size chips studied, representing the evolution of the four groups of
compounds during the 18 days of the simulated extraction. ___________________________________ 26 Fig. 1b. Kinetics of the large size chips studied, representing the evolution of the four groups of
compounds during the 18 days of the simulated extraction.. ___________________________________ 27 Fig. 2. Histograms showing the results of the four different types of toasts studied. ________________ 31 Fig. 3 Hierarchical clustering ___________________________________________________________ 35 Fig. 4 Scatter plot of the two principal components showing the dispersion of the 8 different factors. __ 35 Fig. 5 Projection of the variables into the two first principal components of the PCA. ______________ 36
7
1. INTRODUCTION1.1. THE USE OF OAK IN WINEMAKING
Oak has been used in winemaking for centuries. First oak barrels were used as simple storage containers. Over time, people started to appreciate the oak flavor and the stricter that it conferred in wines. Nowadays, there is large information and research regarding the use of oak and how it affects wine profile.
Among white oaks, there are several species suitable for winemaking. However, two of them are more distinguished for wine proposals; the French (Quercus petraea L.) and the American oak (Quercus alba L.,). Frequently French oak is described as more subtle and spicy, offering textures of satin or silk. American oak tends to be stronger in flavor, often described as cream, vanilla, or coconut, resulting in wines with creamy texture. Many volatile compounds are found in natural wood, but only some of them are reported to be characteristic for the sensory analysis. The two isomers of the lactones are described as responsible for the oak flavor. Vanillin is considered the only lignin aldehyde with the capacity of changing the aroma perception. The smoky and spice aromas are attributed to small free phenols such as eugenol and guaiacol (Cutzach et al. 1997) .
The use of oak barrels has some disadvantages which have been partially solved by the incorporation of oak derived products (oak chips, staves, powder, etc.). These innovative goods are becoming popular and accepted by consumers and winemakers. Their goal is to incorporate oak flavors and oak derived compounds on wine, while expending fewer resources, decreasing the time of ageing and the stock space needed for it, and decreasing the wine losses by evaporation.
1.1.1. The oak origin and the species used in winemaking
Oak wood has been used in winemaking industry in order to enhance wine structure and gain complexity. Wine stored in oak barrels is also developing a good phenolic composition that allows color stability while decreases the astringency and bitterness perception. There are several factors influencing the oak composition and therefore the wine characteristics. The geographical origin and the wood specie are influencing on the wine organoleptic properties. The oak spieces more used in winemaking are the European Quercus robur L. and Quercus Petraea L. coming mostly from French forests, and the Quercus alba L., also denominated American oak (Mosedale et al. 2001).
8
French oak has been understood as the most valuable and appreciated oak for barrel confection. On account of the increasing demand of French oak, other types and countries are providing white oaks. Is the case of eastern European countries such as Hungary and Romania.In nature there are other oak species reported as possible alternatives for wine making purposes. It is the case of chestnut tree (Castanea sativa Mill.), the false acacia (Robinia pseudoacacia L.), and cherry (Prunus avium L.). Other uncommon names are (Fraxinus excelsior L.) and (Fraxinus vulgaris), the mulberry (Morus alba L. and Morus nigra L.), beechwood (Fagus sylvatica L.), and wood from the wetland tree alder (Alnus glutinosa L.). All these oak species could be used for making wine ageing barrels other derivates such spirits or vinegars (Kyraleou et al. 2015). Nowadays the International Organization of Vine and Wine (OIV) does not allow the use of these oaks for wine making purposes (Sanz et al. 2012)
1.1.2. Natural and artificial wood seasoning
Wood seasoning is very important for reducing its humidity, bitterness, astringency and for enhancing the aromatic compounds found in oak. Green wood cannot be used for wine ageing due to a high percentage of water and an excess of displeasing bitter polyphenolic compounds (ellagitannins, cumarins, etc.)(Fernández de Simón et al. 2010).
Natural seasoning usually undergoes a variable time from 18 to 36 months. During this period wood suffers a maturation transformation, a decrease in quantity of undesirable compounds, and a change of the chemical composition. The resulting wood has less hydrosoluble polyphenolic substances, causing a diminution of bitterness and astringency (Vivas and Glories, 1996).
The aromatic profile of wood is also altered in natural seasoning. The natural components of wood such as volatile phenols, lactones or phenolic aldehydes are modified increasing their concentration, decreasing or remaining stable. However, the natural process of seasoning wood affects positively the sensorial characteristics and the oak derived volatile
compounds (Cutzach et al. 1997).
Artificial seasoning is carried out through kilning or a mixed system which combines air drying and kilning. The results obtained by using this seasoning method shown a different evolution of the chemical compounds. Nowadays, is considered that natural seasoning obtains better results (Swan et al. 1993; Masson et al. 2000).
9
1.1.3. Wine chemical modifications occurring during ageingWine traditionally aged in barrels is subject to important transformations as a
consequence of different reactions including spontaneous clarification, CO2 elimination,
continuous diffusion of oxygen through wood pores, esterification/hydrolysis reactions, and enhance of complexity by acquisition of tannins and aromatic substances (Câmara et al. 2006). These structural transformations affect color and clearness, but also the olfactory and gustatory characteristics.
The oak non-volatile compounds include; ellagitannins such as castalagin, vescalagin and roburin, coumarins such as scopoletin and umbelliferone, non-flavonoid polyphenols, phenolic acids such as ferulic and gallic acids, and polymeric compounds (Riberau-Gayon, et al.
2006). These compounds can also be involved in wine coloration stabilization. During wine
aging in barrels, thanks to the microoxigenation occurring through pores, a molecular association of the grape anthocyanin malvidin-3-glucoside and the oak-derived ellagitannin vescalgin, can take place generating a stable linkage and protecting color (Kyraleou et al. 2015).
The rate of extraction of the different compounds and succession of the reactions mentioned depends on wine composition, oak wood structure, and time of storage (Garde-Cerdan and Ancin-Azpilicueta 2006). The time that the wine spends in contact with oak has a significant influence on the final result. In some countries the duration of contact is stipulated by the wine denomination. In the United States of America or Australia, for instance, the oenologist is the responsible of deciding.
1.1.4. Advantages and disadvantages of using oak
It is especially valuable the oxidative process undergoing during the ageing in barrels. Small amounts of oxygen permeate through wood pores, the interstices between staves, and the bunghole. The micro-oxygenation promotes the decrease of phenolic compounds as the free anthocyanins and tannins condensate (del Álamo et al. 2008). It also reduces the astringency perception due to the polymerization processes involving these compounds. The dissolved oxygen also enhances the formation of ethanal from ethanol. According to Escribano-Bailón et al. (2001) and Francia Aricha et al. (1997), ethanal can be involved in polimerization reactions between flavanols, flavanols-anthocyanins and anthocyanins-anthocyanins. In addition ethanal
10
In white wines this oxygenation could result negative. A lower concentration of flavanols and an absence of anthocyanins can lead to wine oxidation (Cáceres-Mella et al. 2013). For this reason, white wines are aged in oak barrels in contact with lees, which consume oxygen and protect the wine against oxidation (Salmon et al. 2000; Comuzzo et al. 2015).Oak wood contributes providing ellagitanins into wine promoting the condensation reaction of tannins and anthocyanins. This reaction exalts the blue hues, lessening the yellow hues evolution (Vivas and Glories, 1996). Furthermore, anthocyanins interact between themselves generating a co-pigmentation or self-association enhancing and stabilizing wine color (González-Manzano et al. 2008)
A non-insignificant problem of ageing wine especially in reused oak barrels is the formation of ethylphenols. These chemical compounds have a microbiological origin, some yeasts are capable of decarboxylate cinnamic acids and form them. Ethylphenols are undesirable to find as they produce off flavors (Chatonnet et al. 1994).
1.2. THE USAGE OF OAK CHIPS AS AN ALTERNATIVE TO WOOD BARRELS
Wines in contact with wood are generally preferred among wine consumers. It is been reported that only a little percentage of wines are improving their sensory and chemical properties ageing in oak barrels (Yin et al. 2016). According to Jackson (2008) the low ageing potential of some wines can exhibit an irreversible quality decrease after some months. Therefore, the creation of new alternatives may be a solution for these types of wines, conferring the possibility of transferring oak-related compounds into wines with a low ageing potential.
Barrel ageing can have several disadvantages as aforementioned. Moreover, the use of oak barrels as ageing technology requires longer time and greater costs. Barrels can be contaminated by undesirable microorganisms and wine is often lost due to evaporation through pores (Kyraleou et al. 2015) . Thus, and the increasing demand of barrels have led to develop alternatives using wood pieces.
11
1.2.1. The origin of oak wood alternatives additionThe usage of oak wood related materials is commonly practiced in new world winemaking countries such as Chile, Argentina, South Africa, Australia, or the USA (del Álamo et al. 2008). In Europe, the legislation regarding these products arrived in 2005 when they were approved in CE 2165/2005 and CE 1507/2006. These regulations allowed traditional winemaking countries such as France, Italy, Spain or Portugal to be more flexible regarding wood utilization. Nevertheless each European country has to accomplish its own regulation defining labeling advertisement (Sánchez-Palomo et al. 2017).
Wood derived products can be produced in different shapes, toasting degrees, and wood species. Oak goods can be presented as; chips, staves, cubes, oak beans, oak powder, granulates which are granulated pieces, “dominoes”, with the shape of domino counters, or in square pieces, “blocks” or “segments” (del Álamo et al. 2008).
1.2.2. Literature review regarding oak chips
Oak chips are commonly applied during the alcoholic fermentation or after it. The addition tends to obtain wines with more complexity, structure, oak flavors, etc. (Gomez Garcia-Carpintero et al. 2012; Del Barrio-Galán et al. 2015). However, it should be taken into account that although phenolic and aromatic compounds present in wood are released during the contact wine-wood, the oxidative process that occurs in the barrel does not take place in tanks. For this reason, the use of wood alternatives is often combined with micro-oxygenation (Oberholster et al. 2015).
The changes that wine suffers by the addition of oak chips have been widely investigated although there is a great variability in the results. These differences could be explained by the factors affecting oak such as the origin, the specie, toasting degree or the seasoning method applied to dry out the chips. According to Schumacher et al. (2013) it is necessary to evaluate how these factors affect the chemical composition of aged wines and their sensory properties. Furthermore, Frangipane et al. (2007) considered that wines aged using oak chips produce more uniform wines and the factors mentioned are less noticeable.
12
A study headed by Tao et al. (2014) mentioned that oak chips obtained from barrels are a natural source of phenolic compounds like benzoic and cinnamic acids and ellagitannins. These compounds are considered to modify wine composition and its organoleptic properties. All these “new” alternatives aim for an improvement of wine characteristics. Its addition confers similar results than wine aged in barrels regarding chemical and sensory properties (DelAlamo-Sanza and Nevares-Domínguez 2006; Frangipane et al. 2007). Another study carried out
by Ortega-Heras and co-workers concluded that a wine in contact with oak chips will not have the same sensory profile as a wine aged in oak barrels for long time. The study also underlined that oak chips give similar woody notes to wines aged in barrels for a short time (Ortega-Heras et al. 2010).
Other authors considered that results obtained by the use of oak chips totally depend on the factors already explained. The oak origin, the toasting degree, the dose or the extraction time are conferring different results and the improvement of the phenolic potential or sensorial
characteristics is not clear (Zimman et al. 2002; Soto Vázquez et al. 2010; González-Sáiz et al.
2014).
1.3. OAK WOOD VOLATILE COMPOUNDS
The aroma is possibly the most important quality factor in wine. It can give valuable information about; the wine making techniques used, the wine grape varieties, the age of the wine, the passage or not through oak, possible defects, etc. The wine aroma is produced by a complex balance of more than 800 volatile compounds in different ranges of concentrations, and with different volatilities, and polarities (Câmara et al. 2006). Higher alcohols, aldehydes, ethyl esters of fatty acids, fatty acids, ketones, monoterpenes and volatile phenols have been found in wines. Their concentrations of individual components vary from a few ng/L to more than 100 mg/L (Rapp and Mandery 1986). These compounds can be originated in the grapes (varietal aroma). They can come from the alcoholic fermentation under anaerobic conditions (fermentative aroma), or from the bouquet, which results from the transformation of the aroma during ageing.
The main factors affecting wood composition and therefore the concentration of oak wood volatile compounds are the specie of oak, the silvicultural treatment of the tree and the geographical origin. Moreover, the seasoning method, the toasting degree and the age of the wood are also important constituents (Jackson 2008).
13
1.3.1. Reactions affecting oak wood volatile compounds during toastingThe reactions of hydrothermolysis and pyrolisis which occur during the toasting process of oak have an influence on quality and quantity of wood extractable compounds. During these processes wood biopolymers such as lignin, polyphenols, lipids and polysaccharides are degraded (Herrero et al. 2016).
Lignin leads to the formation of volatile phenols such guaiacol or eugenol (spicy cloves and smoky smell), phenolic aldehydes (vanillin, syringaldehyde), phenyl ketones and some phenyl alcohols. Particularly, in toasted wood other compounds can also be find in higher levels as the mono and dimethoxylated phenols, benzoic, and the cinnamic aldehydes (Vichi et al. 2007).
Table 1. Composition of American and European oaks. Table extracted from Gunther (1986).
Species %cellulose %hemicellulose %lignin %extractives %ash
European oak 38 29 25 4.4 0.3 Q.robur a 39-42 19-26 25-34 3.8-6.1 0.3 French oak b Q.alba c Q. alba d Chestnut oak e Post oak f 22-50 44 42 41 38 17-30 24 28 30 30 17-30 24 25 22 26 2-10 5.4 5.3 6.6 5.8 - 1 0.2 0.4 0.5
a- Q. robur is the English oak or Limousin oak b- Species not given, believed to be Q. petraea
c- American white oak from swampy land in Georgia d- American white oak from dry uplands in Tennessee e- Chestnut oak is Q.prinus
f- Post oak is Q. stellata
From the degradation of furanic compounds, furanic aldehydes, pentacyclic, and hexacyclic ketones are formed. Furfural is produced when pentoses (xylose) coming from the hemicellulose are heated. Furfural will have an aroma of burned almonds, incense and floral (Gomez Garcia-Carpintero et al. 2012). 5-hydroxymethylfurfural and 5- methylfurfural are produced when hexoses (rhamnose), present in cellulose, are heated during the toasting process (Boidron et al. 1988). Furfuryl alcohol is formed by the enzymatic reduction of furfural during barrel aging (Herrero et al. 2016).
14
Lactones are formed from wood lipids, oils fats and waxes. Their concentration tends to increase at the beginning of the toasting process but they can be degraded in long toasting processes. The main lactones found are the naturally present cis- and trans-methyl-octalactone (whiskey lactones, with a coconut flavor in their pure state) (Chira and Teissedre 2013). The cis isomer if found in higher levels in American white oaks and it has a more intense woody character (Gunther 1986).1.3.2. Volatile compounds found in oak chips
The use of oak chips, as mentioned above, improves the sensory properties of wine. Its addition provides a wide range of aromas of vanilla, species or smoke. Moreover, if oak chips are compared with barrel ageing, the fruity aromas of the grape varieties are more present. It could be explained by the lower oxidation degree of wine volatile compounds (Wilker and Gallander 1988; Gutiérrez Afonso 2002). Oak chips enrich wines with substances like furfural (toasted almonds), dimethyl pyrazines (cacao), maltol (caramel), whiskey-lactones (cocoa), vanillin (vanilla), eugenol (cloves) and volatile phenols (smoky aroma) (Navarro et al. 2016).
However, an inappropriate amount of oak chips could produce significant increases of “woody” aroma covering up the fruity impressions of the grape varieties (Pérez-Coello et al. 2000). Consumers usually like a balance in between oak notes and fruity impressions. It is very important the choice of the type of oak, the toasting degree, and the contact time for obtaining the desired wine.
Frangipane et al. (2007) compared the ageing of red wines in French oak barrels and with French oak chips. Their results showed that oak chips released more oak lactones, eugenol and furfural. Moreover, they also pointed out that it is less noticeable the oak origin in wines treated with oak chips than those treated with barrels. They also concluded that oak chips produce more uniformly wines.
1.4. AIM OF THE WORK
The work conducted was part of a project headed by the Università degli Studi di Torino in the DISAFA research labs (Alba, CN). The study was economically supported by AEB group (Brescia, Italy) where under study. The aim of this work was to characterize the aroma compounds released by eight different types of oak chips at different stages of a simulated extraction. The toasting degree, the size of the chips, and the course of the extraction were studied as factors affecting on the final results.
15
2. MATERIALS AND METHODS
2.1. OAK CHIPS
The oak chips used for this experiment were all obtained from AEB group (Brescia, Italy. In total, eight different types of chips were analyzed; four types of small size chips and four types of large size ships. The four types of both sizes differ on the toasting degree, being classified as light, medium, medium+, and high.
The chips were made of Q, alba farmed in the United States of America. The oak was seasoned naturally during 24 months in the case of the small chips, and 18 months for the large size chips. The wood was crushed for obtaining the chips dimension and the quadrangular shape desired. The chips were treated and submitted into different toasting methods for obtaining the aimed toasting degrees. The procedure used by the cooperage is named “slow toasting”. There is no more information provided by the cooperage about the toasting process.
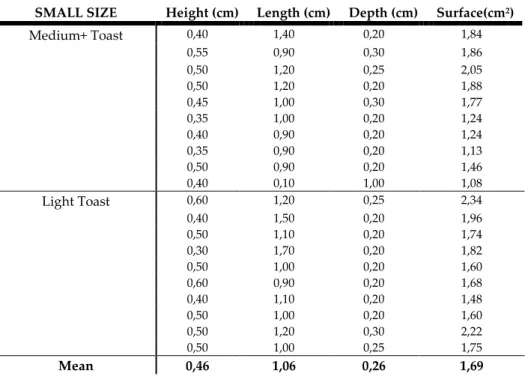
In order to understand the surface in contact with the model wine solution (MWS), the oak chips dimensions were studied. In the case of the small chips, the light and medium+ toasts were measured. Medium and medium+ toasts were the degrees chosen for sampling the large chips. This decision was made for having samples of one of the degrees in both sizes and a different one for having a broad sampling. Ten samples of each toasting degree were taken arbitrary from their container sacks of 22,7 kilograms. The length, height, and depth of these ten samples were measured using a caliper (Table 2 and 3).
Table 2. Values of the height, length and depth of medium+ and light toast small chips.
SMALL SIZE Height (cm) Length (cm) Depth (cm) Surface(cm2)
Medium+ Toast 0,40 1,40 0,20 1,84 0,55 0,90 0,30 1,86 0,50 1,20 0,25 2,05 0,50 1,20 0,20 1,88 0,45 1,00 0,30 1,77 0,35 1,00 0,20 1,24 0,40 0,90 0,20 1,24 0,35 0,90 0,20 1,13 0,50 0,90 0,20 1,46 0,40 0,10 1,00 1,08 Light Toast 0,60 1,20 0,25 2,34 0,40 1,50 0,20 1,96 0,50 1,10 0,20 1,74 0,30 1,70 0,20 1,82 0,50 1,00 0,20 1,60 0,60 0,90 0,20 1,68 0,40 1,10 0,20 1,48 0,50 1,00 0,20 1,60 0,50 1,20 0,30 2,22 0,50 1,00 0,25 1,75 Mean 0,46 1,06 0,26 1,69
16
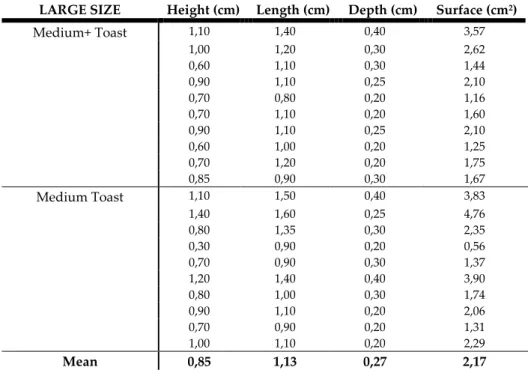
Table 3.Size measuraments (height, length and depth) for medium+ toast and medium toast large chips.
LARGE SIZE Height (cm) Length (cm) Depth (cm) Surface (cm2)
Medium+ Toast 1,10 1,40 0,40 3,57 1,00 1,20 0,30 2,62 0,60 1,10 0,30 1,44 0,90 1,10 0,25 2,10 0,70 0,80 0,20 1,16 0,70 1,10 0,20 1,60 0,90 1,10 0,25 2,10 0,60 1,00 0,20 1,25 0,70 1,20 0,20 1,75 0,85 0,90 0,30 1,67 Medium Toast 1,10 1,50 0,40 3,83 1,40 1,60 0,25 4,76 0,80 1,35 0,30 2,35 0,30 0,90 0,20 0,56 0,70 0,90 0,30 1,37 1,20 1,40 0,40 3,90 0,80 1,00 0,30 1,74 0,90 1,10 0,20 2,06 0,70 0,90 0,20 1,31 1,00 1,10 0,20 2,29 Mean 0,85 1,13 0,27 2,17
The small chips result 0,46cm x 1,06cm x 0,26cm and 1,69 cm2 of surface. The large chips
average dimensions were 0,85cm x 1,13cm x 0,27cm, and 2,17cm2 of contact area. Before the
measurements of tables 2 and 3 were taken, a few samples of all eight types of chips were observed and measured using a caliper. It was seen that the measures of the chips belonging to different toasting degrees but same calibration (small or large) did not differ significantly. According to these observations, it was believed as best to measure ten samples of the same toasting degree for both sizes (medium+) and another different toasting degree.
17
2.2. MODEL WINE SOLUTIONIn order to obtain exclusively results of the impact of oak wood on wine composition, a model wine solution was prepared. The decision of using this model was for reducing to minimum the possible interferences caused by compounds naturally present in wines. The wine-like solution was prepared equally for all the experiments.
For one-liter preparation of MWS, 500mL of deionized water were poured into 2L glass beaker. 40mL of pure ethanol (Prolabo VWR, Fontenay-sous-Bois, France), 20mL of sodium hydroxide (Sigma Aldrich, Saint Louis MO, USA), and 5g of tartaric acid (Sigma Aldrich, Saint Louis MO, USA) were added. The pH of the solution was adjusted under magnetic stirring to 3.4 using a pH-meter calibrated previously. The solution was moved into a volumetric flask and filled up until one liter with deionized water.
2.3. EXPERIMENTAL DESIGN
2.3.1. Schema of the experimental procedure followed in laboratory Eight products made from American oak are under study:
Small chips (22,7 Kg) SLT (Small Light Toast)
SMT (Small Medium Toast)
SM+T (Small Medium+ Toast)
SHT (Small High Toast)
Large chips (22,7 Kg) LLT (Large Light Toast)
LMT (Large Medium Toast) LM+T (Large Medium+ Toast)
LHT (Large High Toast)Each product will be analyzed separately. Two repetitions for each will be made.
Procedure:
Four grams of oak chips are accurately weighted and placed in a 1 liter glass jar
(Bormioli type jar with 86 mm screw cap). The jar is filled with the model wine solution: for one liter of the solution add about 500 mL of water, 40 mL of ethanol, 5g of tartaric acid, about 20 mL NaOH 1N. The model wine solution has to be filled with water until 1L. The pH needs to be checked and adjusted to 3,40.
18
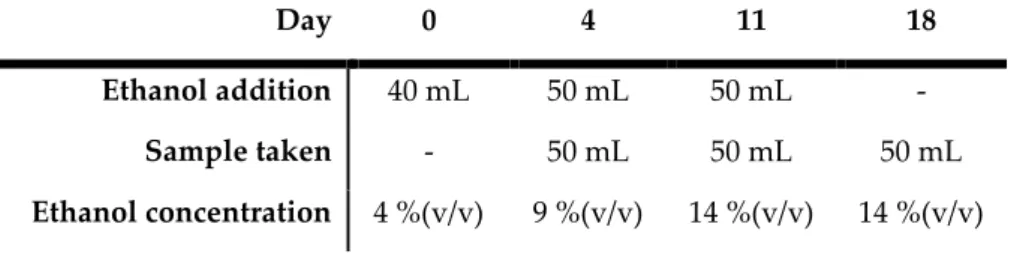
After introducing the oak chips in the jar, a plastic adapter is placed beneath the cap in order to keep the oak chips always in contact with the model wine solution. In addition, a stirring magnet is placed in the solution. The jar will be closed tightly and placed in darkness at 28ºC.A simulated extraction will be carried out and samples will be taken following the next schema:
Day 0 4 11 18
Ethanol addition 40 mL 50 mL 50 mL - Sample taken - 50 mL 50 mL 50 mL Ethanol concentration 4 %(v/v) 9 %(v/v) 14 %(v/v) 14 %(v/v)
Aroma analysis determination:
The evaluation will be performed using a liquid-liquid extraction (in dichloromethane) of the model wine solution. The ionic force of the matrix will be previously increased by the addition of sodium chloride in order to optimize the extraction of furanic compounds of the sample.
Analysis procedure:
50 mL of sample are placed on a 200 mL conical Erlenmeyer flask with emery neck.
250 μL of internal standard are added. The internal standard must be at room
temperature for avoiding errors due to volume variation
5g of sodium chloride are added
A magnetic stir bar is inserted into the conical flask. The magnetic stir bars must be the
same for each trial
10 mL of dichloromethane (CH2Cl2) are added into the sample. The conical flask must
be closed using parafilm
The sample is kept in agitation using the magnetic stirring for 15 min under a specific
speed
After 15 min the dichloromethane is removed using a Pasteur pipette and placed in a
evaporating flask
Repeat the addition of dichloromethane and subsequent removal two more times
The eventual water present in the dichloromethane rich fraction is removed by the
addition of anhydrous sodium sulphate (Na2SO4). The already clean part of the extract is
19
In order to understand if there is still some water into the sample the flask will be kept
into the freezer for one night. If there is water present, the extract will be treated with
Na2SO4 again and moved into a new evaporating flask
The extract is reduced in volume using molecule ozone (N2) or by hand. Therefore it
will be placed in a vial (100 μL volume) and evaporated again until an approximate volume of 50 μL.
The extract will be injected into the GC/MS in splitless mode.
2.3.2. Details and explanation of the experimental design
Four grams of every oak chip type studied were weighted in a precision balance and
placed apart. One liter capacity Bormioli type jars, with a metallic screw cap of 86mm were
used for elaborating the experiment. The jars were filled up with a MWS before the chips were placed inside. The experiment for each oak chip was carried out in two independent measurements (A and B), and the wood pieces were added in their duplicated container at the same time. This step was made for ensuring that in every parallel experiment, the oak chips were in contact with the solution for exactly the same time.
The jar containing the oak chips, the model wine solution, one stirring magnet bar, and a round plastic tool was tightly closed and placed in dark at 28⁰C in an oven (Binder Model BD, Gleisdorf, Austria). The round plastic tool was used to avoid the oak chips flotation, and ensure their permanent soaking on the MWS.
20
For simulating the migration of compounds during wine ageing, an extraction was carried out under the following conditions. Every four, eleven, and eighteen days from day 0, 50mL of sample were taken and analyzed. The ethanol concentration was increased by adding 50mL of pure ethanol (Prolabo VWR, Fontenay-sous-Bois, France). This increase tended to simulate a real extraction starting from 4% of ethanol (v/v) on day 0, increasing to 9% (v/v) on day four, and finalizing with a 14% (v/v) on days eleven and eighteen (Table 4).Table 4. Schema of the experimental procedure followed during the experiment.
Day 0 4 11 18
Ethanol addition 40 mL 50 mL 50 mL - Sample taken - 50 mL 50 mL 50 mL Ethanol concentration 4 %(v/v) 9 %(v/v) 14 %(v/v) 14 %(v/v)
The evaluation of the free volatile compounds was performed using a liquid-liquid extraction applying dichloromethane as solvent. The organic fraction was dried on anhydrous sodium sulphate and concentrated to 50μL employing molecular ozone flux. Therefore it was analyzed using a gas chromatography/mass spectrometry (GC/MS).
2.4. CHEMICAL ANALYSIS
2.4.1. Extraction of volatile compounds
As mentioned in the experimental design abstract, the extraction of volatile compounds was decided to be obtained by using a liquid-liquid procedure. Previously choosing this method, a solid-solid extraction, and liquid-solid extraction were studied as possibilities. Comparing the three different types of separations, the liquid-liquid extraction showed better results on the GC/MS.
The Bormioli jars were taken out from the oven and the MWS was mixed using the magnetic stirring bar for 15 seconds. Afterwards, 50mL of sample were taken from the respective jar and poured on a 200mL conical Erlenmeyer flask. For every oak chip type, the experiment was carried out in duplicated (A and B).
21
Therefore, 250μL of internal standard (3,4-dimethilphenol) were added using a micropipette after being brought to room temperature. This temperature adaptation was done for avoiding errors derived from volume variation. The internal standard was prepared as; 61,25 μg mL-1 of > 99,9 % pure 3,4-dimethylphenol (Sigma Aldrich, Saint Louis MO, USA) in hydroalcholic solution with 15 % v/v absolute ethanol (Sigma Aldrich, Saint Louis MO, USA).Following, 5g of sodium chloride (Emsure-EMD Millipore Corporation, Billerica MA, USA) were added in each flask. The addition of an inorganic salt facilitated the separation of the solvent from the mixture and the formation of a two-phase system. A magnetic stir bar was inserted on the flask. The duplicated flasks had the same type of stirring bar.
Image 3. Left: Agitation of the samples (the samples were not covered yet) Right: Addition of 5g of sodium chloride
Ten milliliters of dichloromethane (Sigma Aldrich, Saint Louis MO, USA) were introduced on the conical flask. The flask was covered up with “parafilm paper” for avoiding a possible evaporation of compounds. The sample was left on magnetic agitation for 15 minutes. The dichloromethane was removed using a glass Pasteur pipette and placed in a Florence flask.
The CH2Cl2 was inserted and subsequently extracted two more times. In each sequence the
duplicated samples (A and B) were treated equally; the speed and the time of agitation were the same in every sequence.
22
Image 4. Glass pipette used for extracting the dicloromethane from the sample
Anhydrous sodium sulphate (Sigma Aldrich, Saint Louis MO, USA) was used for extracting the remaining water found in the dichloromethane rich fraction separated. The dehydrated part was transferred into a new unused Florence flask.
Image 5. Addition of sodium sulfate anhydrous for extracting the remaining water
The Florence flasks containing the dichloromethane fraction were marked and kept under cool temperature during eighteen hours approximately. This stage helped the aggregation of water molecules and its visual identification. In case of water presence, more anhydrous sodium sulphate was added in the organic solvent.
The dichloromethane was therefore evaporated by hand. Once a little quantity was left on the flask, a constant flux of ozone was used for reducing the extract to 100µL approximately. This remaining liquid was transferred on a glass vial using a Pasteur pipette. The evaporation procedure with ozone was repeated with the liquid inside the vial to reach a volume of 50μL approximately.
23
Image 6. Evaporation by hand of the dichloromethane
2.4.2. Gas-chromatography analysis
The determination and quantification of the volatile compounds derived from oak wood was performed using a gas chromatograph model Agilent 7890A (Agilent Technologies, Santa Clara, USA) coupled with a quadrupole mass spectrophotometer Agilent 5975C (Agilent Technologies, Santa Clara, USA).
The samples of organic extract were injected in split/splitless model. Volatile compounds were separated through a polyethylene glycol column DB-WAX (Agilent J&W Scientific Inc, Folsom, USA), length of 30 m, internal diameter of 0.18 mm and, film thick 0.14 μm.
The injection temperature of the GC/MS was 250⁰C, and the oven program used was:
start of 35⁰C for 1min, increasing 3⁰C min-1 until 190⁰C (0 min), finishing with an increase of 4⁰C
min-1 until 230⁰C (15min). The carrier gas was helium (1 mL·m-1).The mass detector conditions
were as follows; source temperature of 150⁰C in full scan mode using a scan range of m/z 35-350, electronic impact 70 eV. The quantitative determination of the volatile compounds was obtained from a semi quantification of the internal standard (3,4-dimethilphenol), using peak area. The compounds were identified by comparing their retention times and mass spectra with the reference standard.
24
2.5. STATISTICAL ANALYSISTo check for significant differences in levels of extracted volatile compounds a one-factor analysis of variance (ANOVA) was carried out comparing the means of the 3 sampling events representing the different stages of extraction. The ANOVA analysis was conducted with a statistical significance of p < 0.05 using the R software (R Foundation for Statistical Computing, Vienna, Austria). It is also represented in form of compact letters displays. If the same letter appears even in two different results means that the average is equal for post hoc test performed after the reject of the null ANOVA hypothesis with 95% of significance.
Data was also submitted to Principale Component Anlaysis (PCA) using software PAST (Øyvind Hammer, Natural History Museum, University of Oslo) to examine a possible grouping of samples and illustrate differences between toasting degrees.
To correct for the loss of volatiles upon sampling, the volatile compounds subtracted together with the 50mL of sample were estimated mathematically and added to the further sampling results subsequently (for sampling on day 11, as well as day 18) according to the following formula:
The quantitative determination of the aroma compounds was scored from a semi quantification of the internal standard (3,4-dimethilphenol), using peak area. The compounds were identified by comparing their retention times and mass spectra with the reference standard.
25
3. RESULTS AND DISCUSSION3.1. INFLUENCE OF THE TIME OF EXTRACTION ON THE VOLATILE COMPOUNDS CONCENTRATION
To understand how the volatile compounds of interest evolve over time, the extraction kinetics along the time of the experiment were studied. The different graphics are representing the results obtained for the eight different types of chips under investigation. To follow the reaction kinetics samples were taken on day 4, 11, and 18 of the experiment and represent the average of two independent measurements (A and B).
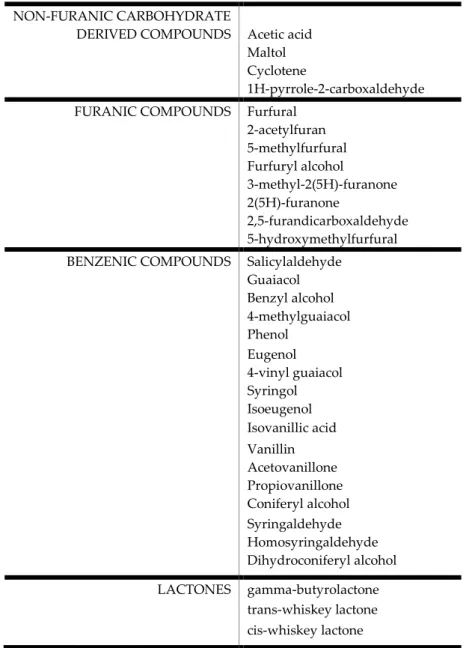
The compounds found during all the experiment were 32 grouped in four groups depending on their chemical structure. The Table 5 shows their distribution on groups.
Table 5. Name and distribution of the volatile compounds found during all the experiment.
NON-FURANIC CARBOHYDRATE
DERIVED COMPOUNDS Acetic acid
Maltol Cyclotene
1H-pyrrole-2-carboxaldehyde FURANIC COMPOUNDS Furfural
2-acetylfuran 5-methylfurfural Furfuryl alcohol 3-methyl-2(5H)-furanone 2(5H)-furanone 2,5-furandicarboxaldehyde 5-hydroxymethylfurfural BENZENIC COMPOUNDS Salicylaldehyde
Guaiacol Benzyl alcohol 4-methylguaiacol Phenol Eugenol 4-vinyl guaiacol Syringol Isoeugenol Isovanillic acid Vanillin Acetovanillone Propiovanillone Coniferyl alcohol Syringaldehyde Homosyringaldehyde Dihydroconiferyl alcohol LACTONES gamma-butyrolactone trans-whiskey lactone cis-whiskey lactone
26
Fig. 1a. Kinetics of the small size chips studied, representing the evolution of the four groups of
compounds during the 18 days of the simulated extraction. The values are the average concentration of the compounds found in the two repetitions (A and B). Semiquantification values are expressed in μg·L⁻1 in relation to the area of internal standard 3,4-dimethylphenol. Different letters indicate different means for Tukey’s HSD test. The alcohol concentrations were 4% (v/v) on day 1, augmenting up to 9% (v/v) on day 4, 14% (v/v) on day 11, and 14% (v/v) by the end of the experiment (day 18).
1,13 a 1,56 a 4,94 b 6,03 a 7,49 a 9,38 b 75,15 a 184,43 b 191,29 b 100,32 a 109,00 a 107,65 a 0 50 100 150 200 1 2 3 4 5 6 7 8 9 10 11 12 13 14 15 16 17 18 Day
a) Kinetics of Small Light Toast chips
26,41 ab 16,74 a 30,46 b 533,97 a 556,07 a 624,47a 1348,69 a 1740,94 a 1613,65 a 92,23 a 138,18 b 127,78 b 0 500 1000 1500 2000 1 2 3 4 5 6 7 8 9 10 11 12 13 14 15 16 17 18 Day
b) Kinetics of Small Medium Toast chips
1782,98 a 2573,96 a 2376,47 a 1500 2000 2500
c) Kinetics of Small Medium+ Toast chips
40,28 b 26,21 a 53,59 b 390,14 a 426,51 a 476,26 a 87,61 a 121,35 a 117,14 a 0 250 500 1 2 3 4 5 6 7 8 9 10 11 12 13 14 15 16 17 18 Day 1984,22 a 3288,49 a 3349,99 a 1500 2500 3500
d) Kinetics of Small High Toast chips
16,00 a 15,99 b 33,41 b 145,09 a 174,26 b 164,24 ab 13,44 a 20,62 a 20,81 b 0 100 200 1 2 3 4 5 6 7 8 9 10 11 12 13 14 15 16 17 18 Day
27
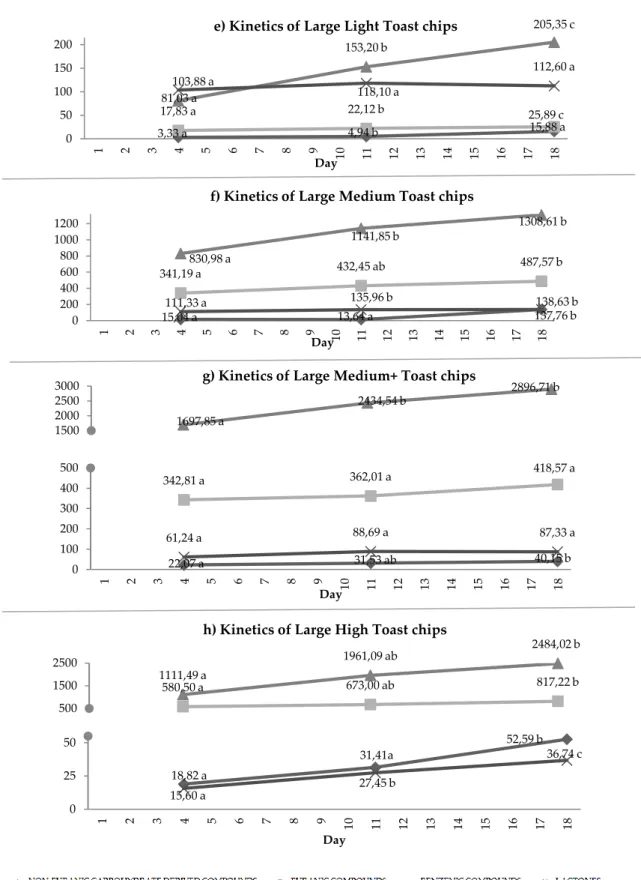
Fig. 2b. Kinetics of the large size chips studied, representing the evolution of the four groups of
compounds during the 18 days of the simulated extraction. The values are the average concentration of the compounds found in the two repetitions (A and B). Semiquantification values are expressed in μg·L⁻1 in relation to the area of internal standard 3,4-dimethylphenol. Different letters indicate different means for Tukey’s HSD test. The alcohol concentrations were 4% (v/v) on day 1, augmenting up to 9% (v/v) on day 4, 14% (v/v) on day 11, and 14% (v/v) by the end of the experiment (day 18).
3,33 a 4,94 b 15,88 a 17,83 a 81,03 a 22,12 b 25,89 c 153,20 b 205,35 c 103,88 a 118,10 a 112,60 a 0 50 100 150 200 1 2 3 4 5 6 7 8 9 10 11 12 13 14 15 16 17 18 Day
e) Kinetics of Large Light Toast chips
15,04 a 13,64 a 137,76 b 341,19 a 432,45 ab 487,57 b 830,98 a 1141,85 b 1308,61 b 111,33 a 135,96 b 138,63 b 0 200 400 600 800 1000 1200 1 2 3 4 5 6 7 8 9 10 11 12 13 14 15 16 17 18 Day
f) Kinetics of Large Medium Toast chips
1697,85 a 2434,54 b 2896,71 b 1500 2000 2500
3000 g) Kinetics of Large Medium+ Toast chips
22,07 a 31,53 ab 40,15 b 342,81 a 362,01 a 418,57 a 61,24 a 88,69 a 87,33 a 0 100 200 300 400 500 1 2 3 4 5 6 7 8 9 10 11 12 13 14 15 16 17 18 Day 580,50 a 673,00 ab 817,22 b 1111,49 a 1961,09 ab 2484,02 b 500 1500 2500
h) Kinetics of Large High Toast chips
18,82 a 31,41a 52,59 b 15,60 a 27,45 b 36,74 c 0 25 50 1 2 3 4 5 6 7 8 9 10 11 12 13 14 15 16 17 18 Day
28
Some of the graphics (c,d,g,h) are split for providing a better visualization of the results as the highest and the lowest values were too disperse to be fit in one single graphic.Table 6. Volatile compounds concentration in three different days of a simulated extraction.
SMALL SIZE CHIPS
Day 4 Day 11 Day 18 Sig*
Light toast Non-Furanic C… 1,13 ± 0,09 a 1,56 ± 0,11 a 4,94 ± 0,46 b **
(SLT) Furanic Compounds 6,03 ± 0,30 a 7,49 ± 0,56 a 9,38 ± 0,02 b **
Benzenic Compounds 75,15 ± 3,21 a 184,43 ± 5,09 b 191,29 ± 2,99 b ***
Lactones 100,32 ± 2,24 a 109,00 ± 6,19 a 107,65 ± 3,08 a n.s.
Medium toast Non-Furanic C… 26,41 ± 1,34 ab 16,74 ± 0,52 a 30,46 ± 4,60 b *
(SMT) Furanic Compounds 533,97 ± 4,24 a 556,07 ± 44,10 a 624,47 ± 45,84 a n.s.
Benzenic Compounds 1.348,69 ± 39,61 a 1.740,94 ± 181,08 a 1.613,65 ± 80,26 a .
Lactones 92,23 ± 2,86 a 138,18 ± 2,30 b 127,78 ± 9,42 b **
Medium+toast Non-Furanic C… 40,28 ± 1,08 b 26,21 ± 0,55 a 53,59 ± 5,68 b **
(SM+T) Furanic Compounds 390,14 ± 26,89 a 426,51 ± 67,79 a 476,26 ± 5,86 a n.s.
Benzenic Compounds 1.782,98 ± 30,92 a 2.573,96 ± 254,11 a 2.376,47 ± 248,19 a .
Lactones 87,61 ± 0,03 a 121,35 ± 12,56 a 117,14 ± 14,48 a .
High toast Non-Furanic C… 16,00 ± 0,53 a 15,99 ± 0,29 a 33,41 ± 3,40 b **
(SHT) Furanic Compounds 145,09 ± 0,92 a 174,26 ± 3,23 b 164,24 ± 9,70 ab *
Benzenic Compounds 1.984,22 ± 17,00 a 3.288,49 ± 139,58 b 3.349,99 ± 132,61 b **
Lactones 13,44 ± 0,58 a 20,62 ± 0,45 b 20,81 ± 2,46 b *
LARGE SIZE CHIPS
Light toast Non-Furanic C… 3,33 ± 0,04 a 4,94 ± 0,40 a 15,88 ± 1,46 b **
(LLT) Furanic Compounds 17,83 ± 0,35 a 22,12 ± 0,91 b 25,89 ± 0,31 c **
Benzenic Compounds 81,03 ± 2,37 a 153,20 ± 6,27 b 205,35 ± 18,88 c **
Lactones 103,88 ± 12,74 a 118,10 ± 14,83 a 112,60 ± 7,47 a n.s.
Medium toast Non-Furanic C… 15,04 ± 0,31 a 13,64 ± 0,97 a 137,76 ± 10,70 b ***
(LMT) Furanic Compounds 341,19 ± 27,40 a 432,45 ± 52,01 ab 487,57 ± 1,13 b .
Benzenic Compounds 830,98 ± 18,97 a 1.141,85 ± 69,79 b 1.308,61 ± 82,55 b *
Lactones 111,33 ± 7,79 a 135,96 ± 1,99 b 138,63 ± 2,65 b *
Medium+toast Non-Furanic C… 22,07 ± 3,22 a 31,53 ± 3,68 ab 40,15 ± 4,47 b *
(LM+T) Furanic Compounds 342,81 ± 44,65 a 362,01 ± 62,73 a 418,57 ± 56,00 a n.s.
Benzenic Compounds 1.697,85 ± 164,96 a 2.434,54 ± 20,97 b 2.896,71 ± 129,86 b **
Lactones 61,24 ± 8,69 a 88,69 ± 12,67 a 87,33 ± 2,82 a .
High toast Non-Furanic C… 18,82 ± 0,12 a 31,41 ± 3,27 a 52,59 ± 5,68 b **
(LHT) Furanic Compounds 580,50 ± 45,59 a 673,00 ± 46,19 ab 817,22 ± 23,24 b *
Benzenic Compounds 1.111,49 ± 30,71 a 1.961,09 ± 45,71 ab 2.484,02 ± 364,22 b *
Lactones 15,60 ± 1,49 a 27,45 ± 1,62 b 36,74 ± 0,46 c **
The values are expressed as average ± standard deviation in µg ·LL-1 of internal standard
(3,4-dimethylphenol). Sig* = significance. The significance codes are: 'ns' not significance '***' p < 0,001, '**' p < 0, 01, '*' p < 0, 05, '.' p < 0, 1.
On Fig. 1, the results obtained on the tracking of the volatile compounds during the 18
days of experiment are represented. The graphics a,b,c, and d belong to the small chips monitoring, and the representations e,f,g, and h represent the large size chips.
29
Observing the large size chips benzenic compounds, the concentration tended to increase during the extraction (graphs e, f, g and h). These compounds did not increase significantly according to the results given by Tukey’s test in the small size chips (graphs b, c, d), except for small light toast (SLT). However, it can be observed that benzenic compounds are found in higher concentrations on small size chips and they got to higher values quicker than large chips.The lactones average concentration increased during time in medium and high toasting levels for both sizes of chips (graphs a, d, f, h). Contrary it did not increase in light and medium+ toast of any of the sizes from a statistical point of view.
Furanic compounds concentration raised significantly (graph e, f, h) as the experiment run in the case of the large size chips. The medium+ toast is the only exception where this is statement was not followed (graph g). If small chips kinetics is observed, there was an increasing tendency over time in the light and high toast (graph a and d) but not in the medium and medium+ (graph b and c).
The non-furanic carbohydrate derived compounds, which is one of the smallest groups with only 4 volatile compounds, tended to increase its concentration along the kinetics. In accordance to these results, it could be said that they are influenced by the time in contact with the MWS. The influence of alcohol volume could be dismissed as there is the same volume of alcohol on day 11 and day 18, although the concentration increased.
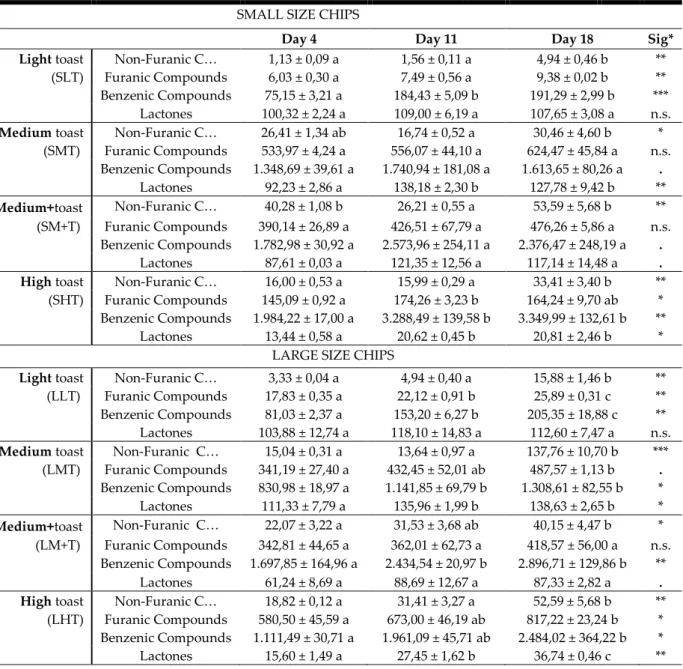
3.2. INFLUENCE OF THE TOASTING DEGREE ON THE VOLATILE COMPOUNDS RELEASED
The toasting degree has been studied as a factor affecting the concentration of volatile compounds extracted. For understanding how this factor is influencing on final results, the average of the two independent measurements (A and B) has been compared on the day 18 of the simulated extraction. The graphic form of the results has been expressed as histograms (Fig 2.).
30
Table 7. Sum of the total amount of volatile compounds found on day 18 on large and small size chips.
The average and the standard deviation are expressed as semiquantification in μg·L⁻1 in relation to the area of internal standard 3,4-dimethylphenol.
Small Large
Light toast Day 18 Day 18
Non-Furanic carbohydrate derived compounds 4,94 ± 0,46 15,88 ± 1,46
Furanic Compounds 9,38 ± 0,02 25,89 ± 0,31
Benzenic Compounds 191,29 ± 2,99 205,35 ± 18,88
Lactones 107,65 ± 3,08 112,60 ± 7,47
Sum of all compounds Medium toast
313,26 359,73
Non-Furanic carbohydrate derived compounds 30,46 ± 4,60 137,76 ± 10,70
Furanic Compounds 624,47 ± 45,84 487,57 ± 1,13
Benzenic Compounds 1.613,65 ± 80,26 1.308,61 ± 82,55
Lactones 127,78 ± 9,42 138,63 ± 2,65
Sum of all compounds Medium + toast
2396,36 2072,56
Non-Furanic carbohydrate derived compounds 53,59 ± 5,68 40,15 ± 4,47
Furanic Compounds 476,26 ± 5,86 418,57 ± 56,00
Benzenic Compounds 2.376,47 ± 248,19 2.896,71 ± 129,86
Lactones 117,14 ± 14,48 87,33 ± 2,82
Sum of all compounds High toast
3023,46 3442,76
Non-Furanic carbohydrate derived compounds 33,41 ± 3,40 52,59 ± 5,68
Furanic Compounds 164,24 ± 9,70 817,22 ± 23,24
Benzenic Compounds 3.349,99 ± 132,61 2.484,02 ± 364,22
Lactones 20,81 ± 2,46 36,74 ± 0,46
Sum of all compounds TOTAL CONCENTRATION
3568,45 9301,52
3390,58 9265,63
31
Fig. 3. Histograms showing the results of the four different types of toasts studied. The average concentration of the two repetitions (A and B) on day 18 is represented. The alcohol volume on day 18 was 14% (v/v). Semiquantification values are expressed in μg·L⁻1 in relation to the area of internal standard 3,4-dimethylphenol.. The standard deviation is shown as an error bar on the graphics.
4,94 9,38 191,29 107,65 15,88 25,89 205,35 112,60 0 50 100 150 200 250 Non-Furanic carbohydrated…
Furanic Compounds Benzene Compounds Lactones i) Compounds concentration on day 18 for Light toast
30,46 624,47 1613,65 b 127,78 a 137,76 487,57 1308,61 138,63 b 0 1000 2000 Non-Furanic carbohydrated...
Furanic Compounds Benzene Compounds Lactones j) Compounds concentration on day 18 for Medium toast
53,59 b 476,26 b 2376,47 a 117,14 b 40,15 a 418,57 a 2896,71 b 87,33 a 0 1000 2000 3000 4000 Non-Furanic carbohydrated...
Furanic Compounds Benzene Compounds Lactones k) Compounds concentration on day 18 for Medium+ toast
33,41 a 164,24 a 3349,99 b 20,81 a 52,59 b 817,22 b 2484,02 a 36,74 b 0 1000 2000 3000 4000 Non-Furanic carbohydrated...
Furanic Compounds Benzene Compounds Lactones l) Compounds concentration on day 18 for High toast
32
Benzenic compounds were found in higher concentrations for all the four histograms(Fig 2)compared to the rest of groups. As it shows table 5benzenic compounds are the largest
group with 17 compounds. These compounds such as vainillin, syringaldehyde, guaiacol and eugenol derive from the thermal degradation of lignin which occurs when chips are exposed to high temperatures (Herrero et al. 2016). Thus, they tend to increase in concentration at higher toasting levels, as the results of this experiment showed. They are also found in higher amounts in the small size chips. This concept could be explained as the deeper layers of the small chips were heated and toasted, so the benzenic compounds were also formed on those layers. Furthermore, the wine like solution could also penetrate and acquire these compounds easily as the structure and dimensions permit it (Masson et al. 2000)
The pyrolysis of cellulose and hemicellulose increments the concentration of furanic compounds such as, furfural and 5-methyl furfural while decreases the amount of the two lactone isomers (trans-whiskey lactone and cis-whiskey lactone) (Guchu et al. 2006). In the results obtained, these two phenomena can be observed. The furanic compounds concentration is very low if the light toast graphic is observed, but its concentration grew while the toasting degree was increasing. The highest concentration of furanic compounds is found in the medium toasting degree (Fig 2. graphic j). This effect can be induced as furanic compounds are present up to ca certain level of heat and thermo degradated when high toasting levels are applied (Chira and Teissedre 2013).
The lactones, which would provide the cocoa flavor (Gunther 1986), are found in largest amounts in light toasting degree (Fig 2. i). In the lowest toasting degree, the heat applied was probably not enough for degrading the lactones, but in stronger toasting degrees the lactones were already diminished. Oak lactones are normally found in higher quantities in American white oak compared to European oaks (Garde-Cerdan and Ancin-Azpilicueta 2006).
Regarding the non-furanic carbohydrate derived compounds the concentrations remain low in all types of chips. Nevertheless, a greater concentration is found in light toast (Fig 2. graphic i). Generally, the volatile compounds of this group increased their concentration while the extraction run.
According to Table 7 and Figure 2, the total amount of volatile compounds released by the small or large size chips is different depending on the toasting degree. Small size chips collaborated with a higher concentration of compounds on medium and high toast (Table 7 and Fig 2. graphics j and l). The large chips, contrary, released more volatile compounds on the light and medium+ toast (Fig 2. graphics i and k).
33
The small chips increased the total concentration of volatile compounds as the toast level increased. Looking to the evolution of concentrations from light to high toast level, it can be seen that this value incremented consequently. In the case of the large size chips, this phenomena was not followed. The large high toast (LHT) results showed lower values than the large medium+ toast (LM+T) degree. However, it cannot be dismissed the standard deviation of the benzenic compounds in the case of LHT. This deviation has the highest number of all the experiments.3.3. MULTIVARIATE DATA ANALYSIS
Data was submitted to Principle Component Analysis (PCA) (Table 9) to examine how the size and the toasting degree effects on the response variables (volatile compounds). The eight different chips examined were; small size light toast (SLT), small size medium toast (SMT), small size medium+ toast (SM+T), small size high toast (SHT), large size light toast (LLT), large size medium toast (LMT), large size medium+ toast (LM+T), and large size high toast (LHT). The compounds integrated in the PCA were the 32 compounds shown in Table 5. The PCA was applied to check possible correlations in the data set. The first two components (PC1 and PC2) summed the 98,2% of the total variation of the data set (Table 8). The data set used for running the PCA corresponds to the means (duplications A and B) of the volatile compounds on day 18 for the eight toast degrees.
Table 8. Variance percentage of the 7 PC explained by the stadistical program PAST.
PC % variance 1 92.608 2 5.6215 3 4 5 6 7 1.4071 0.2047 0.11397 0.038826 0.0058903