U
NIVERSIDADE DE
L
ISBOA
F
ACULDADE DE
C
IÊNCIAS
D
EPARTAMENTO DE
I
NFORMÁTICA
Development of a Scalable, Precise, and
High-Coverage Genomics Mapping Tool for NGS
Natacha Alexandra Pinheiro Leitão
Orientação: Professor Doutor Francisco José Moreira Couto
e Professor Doutor João Carlos Antunes Leitão
M
ESTRADO EM
B
IOINFORMÁTICA E
B
IOLOGIA
C
OMPUTACIONAL
Especialização em Bioinformática
Dissertação
"Science, my lad, is made up of mistakes, but they are mistakes which it is useful
to make, because they lead little by little to the truth."
Agradecimentos
Em primeiro lugar, tenho a agradecer ao Professor Doutor Francisco Couto, que não só aceitou orientar-me nos meus trabalhos de mestrado, como me inspirou a arriscar, a pôr à prova a minha capacidade de aprendizagem e adaptação, e a desenvolver o meu sentido de investiga-ção. Ao Doutor João Leitão, cuja co-orientação foi fundamental na concretização deste projeto, agradeço o seu companheirismo e paciência infinita. E, claro, estou muito grata aos dois pela motivação, confiança e disponibilidade com que me encaminharam nesta jornada que, apesar de morosa e frustrante (em alguns momentos), me deu tanto a aprender. Acho que me vou lembrar de muito do que me disseram e que com eles aprendi durante toda a minha vida.
Agradeço à minha família pelo seu amor incondicional, apoio e orgulho em mim, por acre-ditarem no meu sucesso, independentemente das minhas escolhas e terem-me permitido e mo-tivado a chegar até aqui e a ir cada vez mais longe. Agradeço especialmente: à minha Mãe, por todas as lágrimas que enxaguou, pelos abraços cheios de mimo, sobretudo nos momentos em que a confiança me falhou (quase completamente) e pelo espaço e tempo que me deu; à mi-nha irmã Sofia, por me aturar longe e perto, levar a desanuviar e a divertir (como só consigo com ela), ajudar-me a ir atrás dos meus objetivos e por ser "A"minha irmã mais velha; ao meu Pai, que mesmo distante esteve presente, por todas as conversas cheias de carinho e por me ter ensinado que "a máquina tem sempre razão"(cresci a ouvi-lo e isso ajudou-me bastante neste desafio); à minha Avó Celeste pela visita, pela companhia na minha ida ao Porto para apresen-tar o meu trabalho, e a quem me desculpo por não ter estado mais disponível; ao meu Padrinho pelo seu carinho, preocupação, pelas conversas elucidativas em relação às minhas opções e es-colhas passadas, presentes e futuras. E não podia deixar de estar grata pela companhia dos meus gatos, Milo e Gôdo, por não terem desistido dos meus afetos, tantas vezes penalizados pela minha indisponibilidade (nos últimos tempos), privados do mimo que merecem.
Aos meus amigos, lamento, eu vou encontrar outro drama com que lhes chatear a cabeça mas obrigada, do fundo do meu coração, por me terem ajudado a ultrapassar este. Em especial estou grata: à Cristina, por toda a sua paciência e tempo, pelos sermões que precisei ouvir, e por me adorar ao ponto de continuar a querer aturar-me apesar da minhas "tempestades num copo de água"; à Flávia, pela sua companhia durante todo o mestrado, dentro e fora da faculdade, e
fosse a causa); à Lara, por ser o meu "rubber ducky", pela companhia nas pausas cheias de desespero ou de conversas sobre tudo e nada, por também ter ido a Braga e deixar-me arrastá-la para passeios; ao Bruno, por me ajudar com as minhas dúvidas de programação, pelos "acaba-me mas é isso!"que tantas vezes ouvi e por levar com a minha conversa infindável by proxy; à Ana Cláudia, por me ouvir pacientemente a explicar o projeto (e os seus problemas), pelas vezes que me obrigou a sair da bolha para desanuviar e por todo o carinho que continua a ter por mim; à Mariana, pela sua amizade e apoio, que sempre existiram mesmo com a falta de tempo, e ler os meus testamentos via SMS; à Raquel, pelos passeios e desculpas para fugir do laboratório e dos meus problemas; à Ana Marta, por me deixar refugiar no laboratório do C8 (e lavar o material de vidro), ouvir-me divagar enquanto trabalha e pelas conversas sobre gatos (ou como nós os vemos, as nossas crianças não humanas); ao Rafael pelo apoio mútuo no nosso desespero; à Cíntia, pela disponibilidade, paciência e ajuda durante as minhas crises existenciais e de auto-confiança durante a escrita; à Filipa, pela admiração e por, praticamente desde o primeiro dia da nossa amizade, me motivar a chegar ao fim do projeto por querer assistir à minha prova de mestrado; ao Hugo e à Ioana por me esclarecem as minhas dúvidas sobre análise de dados de NGS.
Por fim, agradeço aos meus colegas do XLDB, Cátia Pesquita, Hugo Bastos e João Ferreira por me acolherem; ao Pedro Gonçalves e à D. Sandra Crespo pela disponibilidade e simpatia; aos meus colegas do laboratório 6.3.30 pelas suas conversas inusitadas que tantas vezes me quebraram o aborrecimento; e, aos membros de Computer Systems do NOVA-LINCS por me fazerem sentir tão bem-vinda em todas as minhas idas ao seu departamento.
N. P. L. Sintra, 25 de Setembro de 2015.
Resumo
O ácido desoxirribonucleico (DNA) é das macromoléculas biológicas mais conhecidas na sociedade, e continua a ser um grande alvo de investigação. No início dos anos 90 do século passado, o Projeto do Genoma Humano começou com o objetivo de sequenciar a informação contida no DNA. Passado treze anos, e cinquenta anos depois de Watson e Crick terem revelado a estrutura em hélice dupla do DNA, a primeira sequência genómica humana foi apresentada quase na sua totalidade; o Projeto do Genoma Humano chegara ao fim, mas não sem mudar as ciências biológicas e a investigação biomédica. O desenvolvimento das tecnologias de se-quenciação e a disponibilidade de sequências genómicas de organismos modelo, para além do humano, levou a que a resequenciação se tornasse um método bastante utilizado para ler a informação guardada no genoma. Hoje em dia, a nova geração de tecnologias de sequencia-ção (NGS Technologies) permitem a produsequencia-ção rápida e a baixo custo de milhares de milhões de pequenos fragmentos de DNA em bruto — usualmente referidos como reads — e um passo importante na análise destes dados é alinhar as reads à sequência de um genoma de referência para determinar o local onde pertencem, isto é, fazer o seu mapeamento.
O processo de mapear a vasta quantidade de pequenos fragmentos de DNA, com algu-mas centenas de bases, a uma sequência genómica, por vezes bastante comprida (por exemplo, o genoma humano tem mais de 3 milhões de pares de bases) é computacionalmente dispen-dioso. Mais, neste processo é fundamental distinguir entre erros técnicos de sequenciação e variações genéticas que ocorreram naturalmente (e que por vezes levam a doenças) no sujeito da amostra. Para fazer frente ao desafio, muitas ferramentas têm vindo a ser desenvolvidas utilizando abordagens algorítmicas diferentes, sendo que algumas delas incluem a informação sobre a qualidade associada a cada base sequenciada, o que reporta a probabilidade de estar errada.
Um dos métodos utilizados no mapeamento envolve procurar ao longo da sequência ge-nómica de referência uma subsequência de uma read; depois, é feito o alinhamento entre a read inteira e a correspondente zona do genoma. Neste trabalho, esta correspondência é ba-seada numa tabela de dispersão (hash table) — uma estrutura de dados que associa chaves de pesquisa a valores — que guarda pequenas subsequências do genoma e as correspondentes
po-chaves de pesquisas — subsequências — para cada read foram implementados em Java, onde a ideia principal é que associando mais do que uma chave a cada read aumentamos a hipótese de encontrar o local a que ela pertence, e consequentemente de mapear todo conjunto de dados.
Neste sentido, a nossa solução para o mapeamento de reads é baseado no paradigma da programação modular, em que cada módulo é responsável por uma parte de uma série de ta-refas onde duas se destacam: a criação de chaves de pesquisa e o alinhamento. Na criação de chaves de pesquisa os nossos algoritmos têm em conta a semelhança entre as bases do DNA e/ou os valores de qualidade associados às bases que compõem a read, onde partindo de uma subsequência a troca com as restantes bases permite gerar novas chaves de pesquisa. Também implementámos um método existente na literatura que divide a read em partes iguais e sobre-postas.
Para o alinhamento foram implementadas três versões do método de Needleman-Wunsch, um algoritmo de programação dinâmica específico para o alinhamento global de sequências biológicas, que tem em conta inserções e deleções de bases no genoma da amostra em rela-ção ao de referência. Ao alinhamento entre as duas sequências é somada uma pontuarela-ção que mede a semelhança entre elas; deste modo, numa implementação simples apenas existem duas situações: há correspondência entre a base da read e a do genoma ou não, havendo uma pena-lização. Quando recorremos a uma matriz de semelhança de bases, encontrando a mesma base no alinhamento das sequências é dada a pontuação máxima, se as bases forem estruturalmente parecidas é dada uma pontuação menor, e em caso de não haver de todo correspondência há uma penalização. Por fim, implementámos uma versão baseada numa existente na literatura, que inclui a probabilidade de cada uma das quatro bases poder ser a correta no cálculo da pon-tuação em relação à sequência genómica, e as inserções e deleções (que levam há falta de cor-respondência, ou seja, a um intervalo entre a sequências) têm uma penalização maior.
Dado que temos vários algoritmos para a criação de chaves e para o alinhamento, uma vantagem da nossa abordagem modular é podermos experimentar combinações diferentes en-tre eles. As combinações possíveis foram testadas com conjuntos de dados artificiais — as reads foram retiradas de posições conhecidas de uma sequência de referência —, construídos com
valores de qualidade reais e com a simulação dos erros técnicos de sequenciação mais comuns. A avaliação dos resultados incluiu o tempo de execução — escalabilidade —, se mapeou todas as reads do conjunto de dados — cobertura —, e se mapeou todas as reads no local correto do genoma de referência — precisão. Em relação ao último parâmetro ainda se considerou o facto da read ter sido mapeada a mais do que uma posição e se foi mapeada a um ou a mais pos-síveis locais com uma pontuação de alinhamento relevante, ou seja, cujo alinhamento tenha resultado de uma correspondência superior a 85%. Considerar várias posições de mapeamento para uma read é um aspeto importante, por um lado, o número de fragmentos de DNA repe-tidos ao longo do genoma de várias espécies é um problema, por outro, alguns protocolos de NGS dependem da quantidade de reads mapeadas a um local (como o do ChIP-Seq). Contudo, o mapeamento incorreto pode levar a erros nos passos seguintes da análise dos dados, como a falsa deteção de polimorfismos de nucleótido único (SNPs, do inglês single nucleotide poly-morphisms) e do número de cópias variantes (CNVs, do inglês copy number variants). Algumas ferramentas foram criadas orientadas para a precisão devolvendo a melhor localização para cada read, descartando os reads restantes. No entanto, outras focadas na detecção de SNPs e de variações de nucleótido único (SNVs, do inglês single nucleotide variations) têm em conta os vários locais de mapeamento, sendo que o conjunto das bases mapeadas a uma dada posição confere um grau de certeza.
Por fim, da avaliação feita ao nosso protótipo para mapeamento de reads concluímos que é preciso melhorar a escalabilidade para que seja possível aplicarmos a ferramenta a conjuntos de dados reais com uma dimensão bastante superior à testada. Uma vez que utilizámos dados artificiais, tal como esperado a cobertura foi total, ou seja, todas as reads foram mapeadas à sequência de referência. As chaves de pesquisa correspondentes a partes sobrepostas das reads levaram a uma precisão perfeita — 100% das reads dos conjuntos simulados foram mapeadas ao seu local de origem na sequência de referência — e a que mais reads tenham encontrado a sua melhor posição, o que chega a ser cerca de 94% de um conjunto de dados. A versão do método de alinhamento de Needleman-Wunsch enriquecido com uma matriz de semelhança de bases conduz mais reads a descobrirem outras localizações possíveis, o que é reflectido num aumento até 7%, tendo aceite variações nucleotídicas no alinhamento.
confirmar as nossas observações sobre a escalabilidade. No entanto, apesar dos resultados ob-tidos com os dados artificiais, com este conjunto de dados apenas as chaves de pesquisa criadas a partir de partes sobrepostas tornaram possível que as respetivas reads encontrassem o melhor e outros possíveis locais no genoma. Estes resultados melhoraram quando se combinou o algo-ritmo com a versão do método de alinhamento de Needleman-Wunsch enriquecido com uma matriz de semelhança de bases, levando a que 28% das reads encontrasse a sua melhor posição e 11% outras possíveis posições. Por outro lado, quanto maior o número de chaves associado a cada read maior o número de reads mapeadas, resultando num cobertura de 100%.
O trabalho futuro deverá incluir o melhoramento da escalabilidade — o que poderá in-cluir soluções de computação na nuvem —, a gravação dos resultados do mapeamento num ficheiro de formato SAM e a adaptação da ferramenta a reads emparelhadas, cujo mapeamento exige uma distância máxima entre elas o que torna o mapeamento mais fiável. Adicionalmente, a característica modular do nosso protótipo permite experimentar outros algoritmos, para as tarefas de criar chaves de pesquisa e alinhar as sequências, e expandir a ferramenta para ou-tras funções, que sejam específicas da aplicação de NGS que produziu os dados (por exemplo, Bisulfite-seq).
O código da implementação encontra-se disponível num repositório público1.
Palavras-Chave
DNA; Tecnologias de NGS; Algoritmos; Mapeamento de reads
Abstract
Mapping is a computationally expensive process, because it involves aligning a large amount of reads with a few hundreds of base to a wide reference genome (e.g., the human genome has over 3 million base-pairs). Moreover, a major challenge is to distinguish technical sequencing errors from biological variations that may occur in the sample. The work presented in this thesis aims to face the mapping challenges by developing a tool that explores and enhances hash-based approaches to increase the search space over the reference genome with the generation of mul-tiple keys for each read, taking into account quality information and/or biological constraints in the alignment; these keys generating algorithms were combined with different read alignment strategies based in the Needleman-Wunsch method in a read mapping pipeline.
Finally, we evaluated our prototype regarding scalability — the time required to be ex-ecuted —, coverage — the percentage of reads that are effectively mapped — and precision — mapping reads to the correct location in the reference genome — with simulated datasets. Al-though in terms of scalability much work has to be done, all the algorithmic combinations led to a perfect coverage of the simulated datasets. As for precision, we observed that generating multiple keys by dividing the reads in overlapping pieces is the best approach, leading to 100% of the reads to be mapped at their original location. On the other hand, relying on a base sim-ilarity matrix to perform the alignment led to more reads discovering other possible locations, resulting in a 7% increase; this is a particularly interesting result when dealing with real datasets because of the repetitive DNA sequences and genetic variations, that may occur within the gen-ome. We also mapped real reads of Escherichia coli UTI89 to its genome sequence, allowing us to confirm the observations about scalability, to realise that the algorithmic combination from above is more suited to find a best and other possible locations for the reads within the gen-ome, accounting for the 28% and 11% of reads obtained respectively for each task. Moreover, by assigning more than one key to the reads we improved the coverage to 100%.
Keywords
Contents
List of Figures xv
1 Introduction 1
1.1 Motivation . . . 2
1.2 Objectives . . . 3
1.3 Contributions and Results . . . 4
1.4 Overview . . . 5
2 Related Work 7 2.1 From DNA Discovery to the Human Genome Sequence . . . 7
2.2 Next-Generation Sequencing (NGS) Technologies . . . 11
2.2.1 Comparison Between NGS Platforms . . . 13
2.2.2 Errors and Biases . . . 15
2.2.3 Third Generation Sequencing Technologies . . . 15
2.2.4 The FASTQ File Format . . . 16
2.3 Survey of Read Mapping Algorithms . . . 18
2.3.1 Algorithms based on Hash Tables . . . 19
2.3.2 Algorithms based on Burrows-Wheeler Transform (BWT) . . . 22
2.3.3 Best-mapper vs All-mapper . . . 24
3 Read Mapping Pipeline 27 3.1 Architecture . . . 28 3.2 Implementation . . . 29 3.2.1 Multithreading . . . 31 3.2.2 Genome . . . 31 3.2.3 Read . . . 32 3.2.4 Probabilities . . . 33 3.2.5 Exploder . . . 34 3.2.6 Aligner . . . 37 3.2.7 Combiner . . . 41
3.2.8 Abstract Classes Instantiation . . . 43
4 Results and Discussion 45 4.1 Scalability . . . 47
4.2 Coverage . . . 55
4.3 Precision . . . 55
4.4 Escherichia coli UTI89 . . . . 63
5 Conclusions and Future Work 67 5.1 Future Work . . . 69
List of Figures
1.1 Cost per Raw Megabase of DNA Sequence. . . . 2
2.1 Pairing of nucleotide bases. . . . 8
2.2 Work flow of Sanger sequencing method versus second-generation sequencing. 12 2.3 Extract from a file in FASTQ format. . . . 16
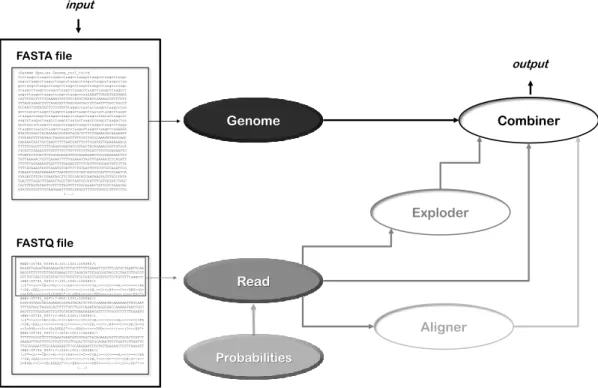
3.1 Read Mapping Pipeline scheme. . . . 29
3.2 Example of a .properties file content. . . . 30
3.3 Sliding window . . . . 33
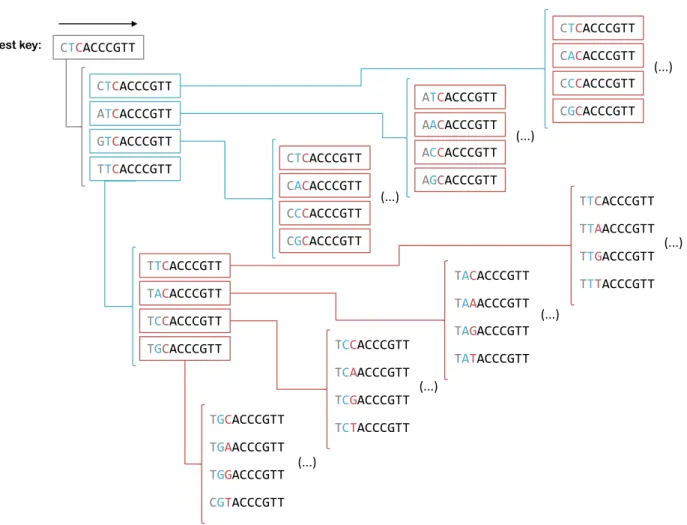
3.4 Scheme of the algorithm for the best key explosion. . . . 35
3.5 Definition of transition and transversion. . . . 36
3.6 Similarity Matrices. . . . 41
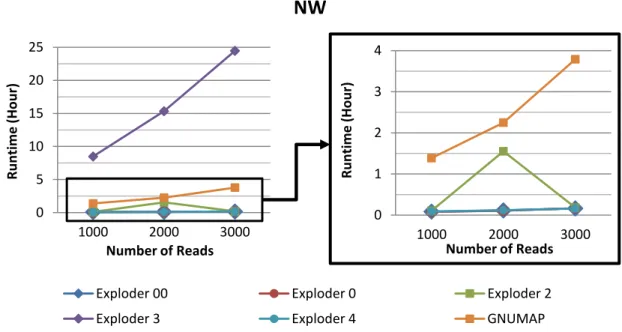
4.1 Runtime vs Number of Reads (NW). Results from Machine 1. . . . 48
4.2 Runtime vs Number of Reads (NW). Results from Machine 2. . . . 48
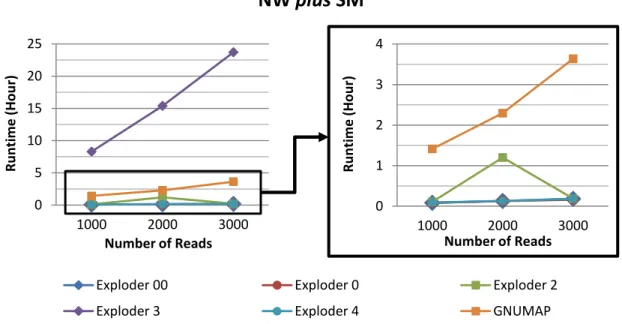
4.3 Runtime vs Number of Reads (NW plus SM). Results from Machine 1. . . . 49
4.4 Runtime vs Number of Reads (NW plus SM). Results from Machine 2. . . . 49
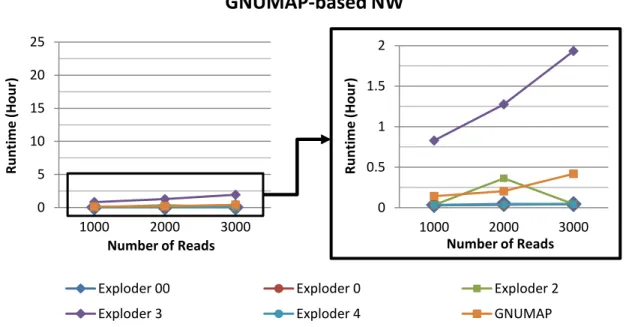
4.5 Runtime vs Number of Reads (GNUMAP-based NW). Results from Machine 1. . . 50
4.6 Runtime vs Number of Reads (GNUMAP-based NW). Results from Machine 2. . . 50
4.7 Runtime vs Exploder and Aligner Combination (1000 reads). Results from Ma-chine 1. . . . 51
4.8 Runtime vs Exploder and Aligner Combination (1000 reads). Results from
Ma-chine 2. . . . 51
4.9 Runtime vs Exploder and Aligner Combination (2000 reads). Results from Ma-chine 1. . . . 52
4.10 Runtime vs Exploder and Aligner Combination (2000 reads). Results from Ma-chine 2. . . . 52
4.11 Runtime vs Exploder and Aligner Combination (3000 reads). Results from Ma-chine 1. . . . 53
4.12 Runtime vs Exploder and Aligner Combination (3000 reads). Results from Ma-chine 2. . . . 53
4.13 Mapping Results for 1000 reads. . . . 56
4.14 Mapping Results for 2000 reads. . . . 57
4.15 Mapping Results for 3000 reads. . . . 58
4.16 Rate of Reads with other Possible Locations. . . . 59
4.17 Rate of Reads with a Best Location found. . . . 60
4.18 Rate of Incorrectly Mapped Reads. . . . 62
4.19 Runtime vs Exploder and Aligner Combination (E. coli UTI89). . . . 63
Chapter 1
Introduction
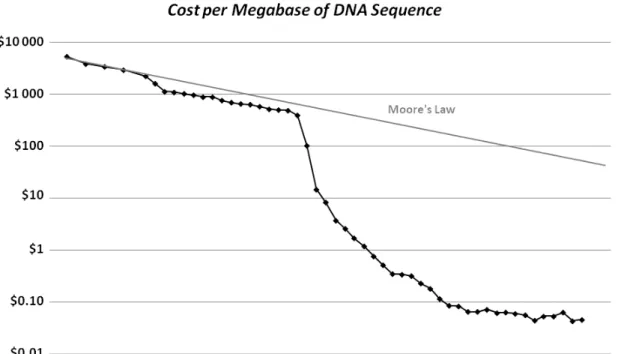
The beginning of the 21st century was marked by the "essentially complete" human genome sequence (Collins et al., 2004), which led to the sudden evolution in sequencing technologies (McPherson, 2014). This brought many challenges to bioinformatics mostly due to the availabil-ity of an increasing amount of data at decreasing costs (Figure 1.1). From software development for de novo assembly or sequence alignment to the design of new data-structures (Ferragina and Mishra, 2014), without forgetting the solutions within cloud computing and big data technolo-gies (O’Driscoll et al., 2013), today’s bioinformaticians have a lot to explore, and improve, before the future arrives.
One feature inherent to the next-generation sequencing (NGS) technologies is the fast production of billions of raw short contiguous DNA fragments, usually denominated as reads. With the availability of model organisms genome sequences, particularly the human genome sequence, an important step of NGS data analysis is the mapping process, i.e., aligning the read to a known reference genome, as to determine its location.
Figure 1.1: Cost per Raw Megabase of DNA Sequence. The cost to determine one megabase (a million bases, Mb) to generate raw, unassembled sequence data. From 2001 through Oc-tober 2007 represent the costs of generating DNA sequence using Sanger-based chemistries and capillary-based instruments. Beginning in January 2008, the data represent the costs of generating DNA sequence using next-generation sequencing (NGS) platforms. A hypothetical data reflecting Moore’s Law is used for comparison, since technology improvements that follows Moore’s Law projections are considered to be going very well. Data from Wetterstrand (2015).
1.1 Motivation
Mapping reads with hundred of base-pairs (bp) is a computationally expensive process, since the reference sequences may have a size of millions bp, for instance the human genome has over 3 million bp. Moreover, repetitive DNA sequences, which are common and abundant on the genome of many species, leads to the mapping of a single read to multiple locations cre-ating technical challenges that may result in errors and biases in downstream analysis. These imprecise results may, in particular, lead to false inferences of single nucleotide polymorphisms (SNPs) and copy number variants (CNVs) (Treangen and Salzberg, 2012).
1.2. Objectives
On the other hand, despite the undoubted impact of NGS technologies these platforms produce a vast amount of data that imply storage solutions. Additionally, the fact that each platform differs in features, such as read length, data format, and sequencing method, affects the methodologies that should be employed in their analysis (Zhang et al., 2011).
Thus, many mappers — i.e., read mapping software — have been developed, which rely on different approaches. However, many of these solutions have limitations related to scalabil-ity — the time required to execute the mapping— when based on Burrows-Wheeler transform method, or with memory footprint, if it is based on a hashing method (Lee et al., 2014; Hatem et al., 2013). Furthermore, a mapping tool has to take into account coverage — the percentage of reads that are effectively mapped — and precision — mapping reads to the correct location in the reference genome — as to obtain the best depth — the number of reads covering a given locus at the genome.
Due mostly to current technologies limitations, which generate reads with sequencing er-rors, e.g., base miscalls, a major challenge is the ability to distinguish between technical errors and biological variations that occur at the sequenced sample. Hence, if every read is mapped and each of them is correctly mapped to a location, we will have more certainty in the consensus sequence of the sample, which is of extreme importance when detecting genetic variants (like, SNPs or single nucleotide variations (SNVs)) from the reference genome (O’Rawe et al., 2013).
1.2 Objectives
The work presented in this thesis aims in developing a mapping tool with high coverage and pre-cision by exploring and enhancing hash-based approaches to increase the search space over the reference genome with the generation of multiple keys for each read, taking into account qual-ity information and/or biological constraints. Therefore, despite existing sequencing errors, a read will generate several keys, which directly translate to multiple locations in the reference genome to be searched, significantly improving the chances of finding the right localisation. The mapping will be definitive after a positive alignment of the read with the genome, using algorithms based in the Needleman-Wunsch method (Needleman and Wunsch, 1970). This
strategy however aims at finding the right balance between the number of locations that are effectively searched and the precision and coverage achieved by the mapping solution.
Another goal of this work is to develop an user-friendly tool, where the best results are ob-tained with less parameters being required to be set by the user, while being sequencing tech-nology platform independent.
1.3 Contributions and Results
The approach implemented, coded in Java, takes advantage of modular programming to enable, in a simple way, the user to plug different algorithms responsible for generating the keys used in the sequencing process, as well as the read alignment strategy. This allows to study the influence of such algorithms in the mapping and to further extend the tool with additional algorithms to pursue the best combination of the keys generation and read alignment algorithms. The source code is available in a public repository1.
At the end, this work contribute with:
• A read mapping pipeline in which the reference genome is hashed and multiple search keys for each read are used to find the genomic candidate locations;
• Four algorithms to generate multiple search keys for one read, that take into account the Phred quality values and/or nitrogenous base similarity;
• A simple implementation of the Needleman-Wunsch method (Needleman and Wunsch, 1970) to align two nucleotide sequences, and other where a similarity matrix is used to score the matchings between the sequences;
• A Java version of the sliding window algorithm to retrieve search keys from a read and the variant of the Needleman-Wunsch method implemented at GNUMAP (Clement et al., 2010);
• A tool that allows to combine these different algorithms, to generate keys and to align a read to a reference sequence.
1.4. Overview
An evaluation of the prototype was made with simulated datasets and we observed that: • It did not succeed regarding scalability, although the GNUMAP-based alignment algorithm
required less time to perform no matter which method we resort to generate the search keys;
• As expected, all the combinations led to a 100% coverage of the datasets, i.e, every single read was mapped to the reference sequence;
• By combining the GNUMAP-based algorithms we obtained a 100% precision, the datasets were entirely mapped to the original positions within the reference sequence, and we had more reads finding their best position, about 94%.
• However, the implementation of the Needleman-Wunsch method enriched with a simil-arity matrix led to more reads discovering other possible locations, reflected in a 7% in-crease. This is a particularly interesting result when dealing with real datasets because of the repetitive DNA sequences within the genome, but it also has advantages in finding SNPs and SNVs.
Real reads of Escherichia coli UTI89 were mapped to its genome sequence, allowing to confirm the observations about scalability. Despite the results with simulated data, the proto-type only was able to find the best and other possible locations using the GNUMAP-based al-gorithm to create keys, getting better results when combined with the version of the Needleman-Wunsch method enriched with a similarity matrix, inferring from the 28% and 11% of reads obtained respectively for each task. Also, by assigning more than one search key to a read we improved the coverage up to 100%.
1.4 Overview
The next chapter introduces the historical path which ultimately brought us to this challenge. Afterwards, we describe the NGS methodology and we refer to the main features of the most commonly used platforms, as well as their errors and biases. The FASTQ file format, that plays a significant role in our approach, is also presented. To conclude Chapter 2, we provide a brief
review of some mapping tools currently available and cloud computing solutions that may be used to improve our tool scalability. In Chapter 3, our approach is explained. First, we describe its architecture and then the major implementation details are presented — where we include the search key generation algorithms developed and the alignment methods supported by our pipeline. The evaluation of the prototype is discussed in Chapter 4, in which we also explain how the simulated FASTQ files were obtained and present the results for the mapping of real reads from E. coli UTI89. The final chapter provides conclusions and considerations for future developments and discusses the aspects that we think have to be taken into account for further improvements to our tool.
Chapter 2
Related Work
In this chapter, a historical background is presented to introduce some fundamental concepts of genomics, the early beginnings of genome sequencing and the Human Genome Project (HGP) and its consequences. Then, differences between the most widely used Next-Generation Se-quencing (NGS) technologies are denoted, as their inherent characteristics also poses as a chal-lenge to mapping reads, namely the sequencing errors; the FASTQ file format, which the tool presented in this thesis uses as input, is presented as well. Additionally, this chapter focus on mapping reads, by presenting a brief survey of algorithms for NGS data. And, finally, cloud com-puting solutions are referred since they can be used to improve the scalability of our prototype.
2.1 From DNA Discovery to the Human Genome Sequence
For centuries, farming techniques have been used to breed crops and animals with particu-lar traits; however, it was only in the 19th century that Gregor Mendel published the results of his investigation with peas and described how living organisms passed traits to their offspring (Mendel, 1866).
In early 1869, Friedrich Miescher, while trying to understand the chemical basis of life, discovered a new class of biological molecules in purified nuclei and called it “Nuclein” (Dahm, 2010). Six decades later, Phoebus Levene described the different types of nucleic acids,
ribonuc-leic acid (RNA) and deoxyribonucribonuc-leic acid (DNA), and defined the DNA as a sequence of units – nucleotides – composed by a phosphate group, a deoxyribose sugar and one of four nitrogenous bases: adenine, thymine, cytosine, and guanine (Levene and London, 1929). Meanwhile, Fred-erick Griffith, in experiments with Streptococcus pneumoniae, determines that there must be a genetic factor which can transform the bacteria (Griffith, 1928); this "transforming factor" was demonstrated by Oswald Avery and his colleagues as being the DNA (Avery et al., 1944). Finally, Hershey and Chase, confirmed the DNA as the genetic material responsible for the heredity of traits (Hershey and Chase, 1952).
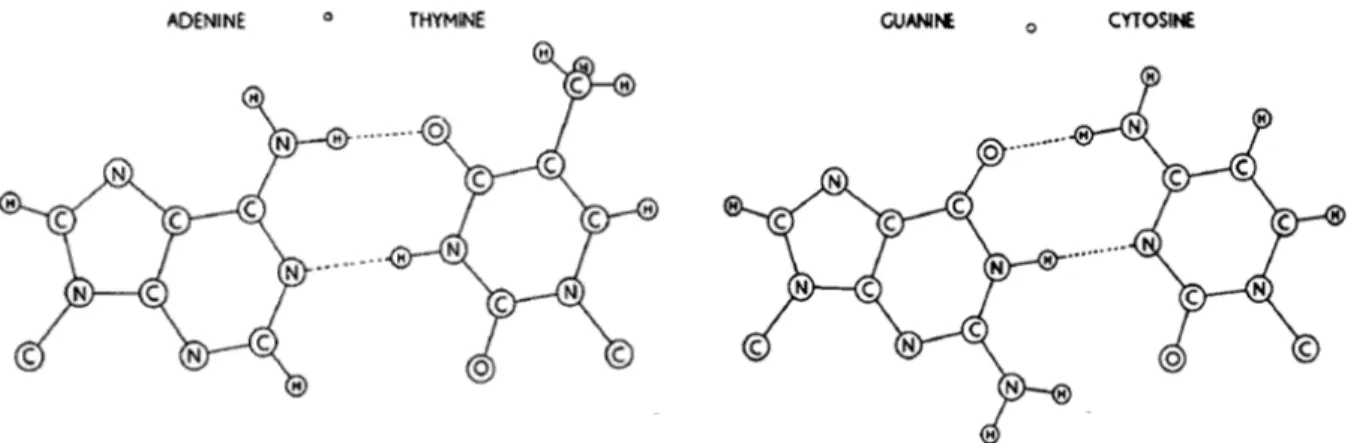
From 1948 to 1952, Erwin Chargaff published a series of papers in which he concluded that there is an adenine for every thymine, and a cytosine for every guanine in every living organ-ism (Cohen and Portugal, 1974). These findings contributed to the DNA structure proposed by James Watson and Francis Crick, based in Maurice Wilkins and Rosalind Franklin DNA crystals image via X-ray (Watson and Crick, 1953a,b): the DNA is a double-helix where two helical chains are hydrogen-bonded by complementary base pairs — adenine with thymine and cytosine with guanine (Figure 2.1). Wilkins, Watson and Crick received the Nobel Prize in Physiology in 1962 for this discovery (Nobelprize.org, 2015b). No other macromolecule in history has had its im-age so widespread in our society, it even received the title “The Mona Lisa of Modern Science” (Kemp, 2003).
Figure 2.1: Pairing of nucleotide bases. Hydrogen bonds are shown dotted. Adapted from the work by Watson and Crick (1953b).
Then, in 1958, Francis Crick declared the "Central dogma of molecular biology" to explain the transference of the information contained in DNA to proteins (Crick et al., 1970); three years
2.1. From DNA Discovery to the Human Genome Sequence
later, he and his colleagues published their genetic experiments that, together with other works, allowed them to observe the degeneracy of the genetic code, which means that if an amino-acid is coded by a triplet (a group of three nucleotides), there are 64 possibilities to represent 20 amino-acids (Crick et al., 1961). Afterwards, Nirenberg’s team was able to relate 45 out of 64 triplets with the respective amino-acid and predict the remaining nucleotide sequences (Niren-berg et al., 1965).
An important step in "reading" the content of a DNA sequence was made by Frederick Sanger and colleagues when they determined the DNA sequence for the genome of bacterio-phageΦX174 (Sanger et al., 1977a). Soon after, Allan Maxam and Walter Gilbert reported an ap-proach to sequence DNA wherein terminally labelled DNA fragments were subjected to chem-ical cleavage specific to each base and the reaction products resolved by polyacrylamide gel electrophoresis (Maxam and Gilbert, 1977). Yet, in the same year, Sanger describes a new se-quencing method, applied to the genome of bacteriophageΦX174, using DNA polymerase and chain-terminating dideoxynucleotide analogs, thus causing base-specific termination of a newly synthesised chain (Sanger et al., 1977b). This method revealed itself as less laborious than Maxam’s. Both techniques led to half of the 1980’s Nobel Prize in Chemistry being jointly awar-ded to Sanger and Gilbert "for their contributions concerning the determination of base se-quences in nucleic acids" (Nobelprize.org, 2015a) . With the cost of computer components be-ginning to rapidly fall, allowing laboratories to have their own computers, and DNA sequencing becoming a faster procedure, computer programs arose as a solution to handle and analyse data produced by sequencing experiments (Staden, 1979). Sanger’s method was adapted to ’shotgun’ sequencing, in which the DNA sequence assembly of overlapped smaller sub-sequences is per-formed by computer software (Anderson, 1981). Further improvements on the Sanger sequen-cing technique led to the adoption of fluorescent dyes enabling a computer-based automatic base identification (Smith et al., 1986; Prober et al., 1987). Another example of the aid of inform-atics in fields of biology, at this time, is the FASTA program for protein and DNA sequence simil-arity analysis and databases search (Pearson and Lipman, 1988); nowadays, FASTA is known as the default text-based format for biological sequences.
proposed the possibility of sequencing the human genome in 1985, many thought his idea was premature or even crazy, due to the demand of resources; however, in 1986, Charles DeLisi of the U.S. Department of Energy (DOE) decided to fund research for genome sequencing and mapping. Two years later, a special committee of the U.S. National Research Council of the U.S. National Academy of Sciences recommended the Human Genome Project to be initiated, with a deadline of 15 years and funding of about $200 million a year. In 1990, with James Watson leading the National Institutes of Health (NIH) part of the now joint NIH-DOE project (Collins et al., 2003), the Human Genome Project (HGP) started (Watson, 1990). This was the first large-scale biology project, one that changed biology and the biomedical sciences, an international endeavour that counted with the Sanger Centre (funded by the Wellcome Trust) and assisted by the private sector. The HGP promoted the development of new sequencing technologies, with its need for high-throughput generation of biological data at low cost — which was boosted by the advent of capillary sequencing machines. Its research about the legal, ethic, and social im-pact of the knowledge being gathered and the collection of increasing biological data to be ana-lysed, annotated, and stored, but made publicly accessible in user-friendly databases, created a clear need for interdisciplinary in genomics research.
Although the human genome was the flagship of the project, it also assembled the ge-nomic sequences for the E. coli, S. cerevisae, C. elegans, D. melanogaster, and whole-genome drafts of several others, including the mouse and the rat, which opened the door to Comparat-ive Genomics (Collins et al., 1998, 2003). Thus, by February 2001, when the International Human Genome Sequencing Consortium (Lander et al., 2001) and Celera Genomics (a private project started in 1998) (Venter et al., 2001) reported the first draft of the human genome, the landscape of biological and biomedical research had already started to change. The HGP successfully ended 2-years earlier than initially planned (Collins et al., 2003), just in time to celebrate 50th Anniversary of the discovery of the DNA structure; the following year was marked with almost 99% of the euchromatic genome highly accurately sequenced (Collins et al., 2004). Nevertheless, the understanding of the information encoded in the human genome was very limited, which lead to the launch of the Encyclopedia of DNA Elements (ENCODE) Project (Encodeproject.org, 2015) in September of 2003, in which an international consortium, organized by the National Human Genome Research Institute (NHGRI), received the task of identifying all the functional
2.2. Next-Generation Sequencing (NGS) Technologies
elements encoded in the human genome sequence. There is still much to understand, however, the results of the ENCODE project combined with other large genomic data sets may elucidate the genetic and epigenetic factors responsible for the development and progression of human diseases (Frazer, 2012), for example.
Since the Sanger sequencing method continues to be expensive despite having been heav-ily refined and improved, the NHGRI initiated “Advanced Sequencing Technology Development Projects” in 2004, to motivate the development of low cost sequencing which led to the next-generation sequencing (NGS) technologies to start to become available. Although these high-throughput technologies produce shorter reads, i.e., DNA fragments synthesised, when com-pared to the Sanger method, their parallelised sequencing process produces thousands of bases per second at significantly reduced cost (Pettersson et al., 2009). NGS technologies are im-proving biomedical investigation with clinical implications, such as cancer treatment (Ross and Cronin, 2011; Bohlander, 2013; Offit, 2014) and infectious disease management (Pak and Kasars-kis, 2015), while being widely used in many biological fields. The promise of the HGP for biology, biomedical research and health care of change (Collins et al., 1998) is fulfilled with more to come (Green et al., 2011).
"The ever quickening advances of science made possible by the success of the Human Genome Project will also soon let us see the essences of mental disease. Only after we understand them at the genetic level can we rationally seek out appropriate therapies for such illnesses as schizophrenia and bipolar disease." - James D. Watson (The New York Times, 2007)
2.2 Next-Generation Sequencing (NGS) Technologies
The automated Sanger method is considered a ’first-generation’ technology, in which the DNA to be sequenced can be prepared by being randomly fragmented — sequencing library — and then cloned to a plasmid vector and used to transform E. coli — for shotgun de novo sequen-cing — or for PCR (Polymerase Chain Reaction) amplification carried out with primers that flank
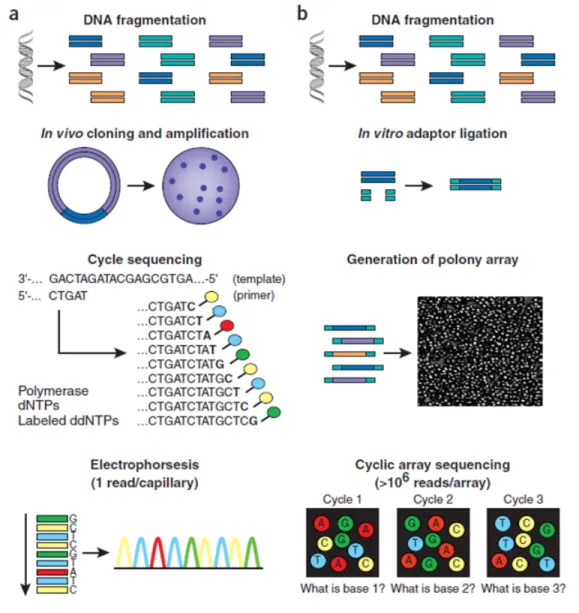
Figure 2.2: Work flow of Sanger sequencing method (a) versus second-generation sequencing
(b). Adapted from the paper by Shendure and Ji (2008).
the target — for targeted resequencing. Both approaches output an amplified template: clonal copies of the single plasmid insert within the bacterial colony (as depicted in Figure 2.2 (a)) or PCR amplicons within a single reaction volume. The sequencing biochemistry takes place in a ‘cycle sequencing’ reaction, within a microliter-scale volume, generating a ladder of ddNTP-terminated, dye-labelled products, which are subjected to high-resolution electrophoretic sep-aration of the single-stranded, end-labeled extension products in a capillary-based polymer gel; finally, as fluorescently labelled fragments of discrete sizes pass a detector, the four-channel emission spectrum is used to generate a sequencing trace and a software translates these traces into DNA sequence, while generating error probabilities for each called base (Shendure and Ji,
2.2. Next-Generation Sequencing (NGS) Technologies
2008).
’Second-generation’ technologies is a term used to refer multiple implementations of ’cyclic-array sequencing’ and, although these approaches differ in biochemistry and ’cyclic-array generation, their work flows are conceptually similar (Figure 2.2 (b)). In comparison to Sanger sequencing, these new technologies have the advantages of in vitro construction of a sequencing library, fol-lowed by in vitro clonal amplification to generate sequencing features. Also, the array-based sequencing enables a much higher degree of parallelism than conventional capillary-based se-quencing; and, its features are immobilized to a planar surface which means they can be en-zymatically manipulated by a single reagent volume, leading to a drop of the effective reagent volume (Shendure and Ji, 2008). These differences combined results in a cheap production of an enormous volume of data with shorter reads.
2.2.1 Comparison Between NGS Platforms
Although there are a few commercially available platforms, Illumina, Roche 454 Sequencing, and Applied Biosystems SOLiD dominated the market (Zhang et al., 2011), being responsible for a vast amount of data produced by NGS technologies. Nowadays, Illumina stands out in the NGS industry and Roche announced the close down of its 454 operations in mid-2016 (McPherson, 2014). The reviews by Shendure and Ji (2008); Metzker (2010), and Liu et al. (2012b) explain the details inherent to each sequencing method. The following discusses the fundamental aspects of these to support a comparison between the three platforms1:
• Illumina (Illumina, Inc., 2015) platforms rely on bridge PCR amplification to form clusters with clonal DNA fragments; these fragments have free ends to which a universal sequen-cing primer can be hybridised to initiate the sequensequen-cing reaction. Sequensequen-cing by syn-thesis is the method adopted, wherein DNA synsyn-thesis is terminated by reversible termin-ators following the incorporation of one of four modified nucleotides — each bearing one of four fluorescent labels — by DNA polymerase. With sequencer options adapted to key applications, Illumina systems have an output range from 20-39 Gb to 1.6-1.8 Tb with a
1To compare the sequencers’ output and read lengths the follow metric is used: 1 base-pair (bp); 1 000 000 bases
run time that can go from 15 to 40 hours or 1 to 6 days. Currently, the maximum read length ranges between 2 x 125 and 2 x 150 bp depending upon on the Illumina model employed.
• Roche 454 Sequencing (Roche Diagnostics Corporation, 2015) platforms use single stran-ded DNA fragments that are captured by beads and emulsion PCR for clonal amplification. The beads are deposited into individual wells where the sequencing is performed by the pyrosequencing method; here, released pyrophosphate equals the amount of incorpor-ated nucleotide which promotes a chemical reaction that generates visible light. Now, GS FLX+ System can be used with two sequencing kits: one produces reads with lengths up to 1000 bp, with a typical throughput of 700 Mb within 23 hours, and the other has a typical throughput of 450 Mb with 10 hours of run time and a read length that can go to up to 600 bp.
• Applied Biosystems SOLiD (Sequencing by Oligo Ligation Detection) (Thermo Fisher Sci-entific Inc., 2015) sequencers also rely on emulsion PCR and adopted the technology of two-base sequencing based on sequencing by ligation, an approach in which DNA poly-merase is replaced by DNA ligase, as each sequencing cycle introduces a partially degener-ate population of fluorescently labeled octamers. However, the 5500 W Genetic Analyzer sequencer replaced the beads with direct amplification on FlowChip; depending on the library used, read length can be 75 bp (fragment), 2 x 50 bp (mate-paired) and 50 bp x 50 bp (paired-end) with a of the throughput approximately 80 Gb to 160 Gb.
Targeted to clinical applications and small labs, Ion Torrent Systems (later acquired by Life Technologies) launched the Personal Genome Machine (PGM), wherein DNA fragments with specific adapter sequences are linked to surface beads (known as Ion Spheres Particles) and then clonally amplified by emulsion PCR; proton release signals the incorporation of nuc-leotides during synthesis. For the same market, Illumina developed the MiSeq. These two plat-forms are similar in terms of utility and ease of work flow, however PGM has a higher sequen-cing error rate (Quail et al., 2012). Roche has a benchtop version of the 454 Sequensequen-cing System as well: the GS Junior System.
2.2. Next-Generation Sequencing (NGS) Technologies
2.2.2 Errors and Biases
Although all the different approaches introduced rely on a complex interplay of chemistry, hard-ware, and optical sensors, they differ in other mechanical details which affect the sequencing types of errors and biases produced by each type of platform. On the end of each sequencing pipeline is a software, that analyses the sensor data to predict the individual bases; this is re-ferred to as base-calling.
Solexa/Illumina platforms have been reported to have increased the error rates along the read, in which the G to T and A to C conversions are among the most frequent base substitution errors (Dohm et al., 2008), and wrong base-calls are frequently preceded by base G, showing a GC bias from these platforms (Bravo and Irizarry, 2010; Minoche et al., 2011). Incorrect predic-tion of homopolymers — consecutive runs of the same base — length leads to inserpredic-tion and deletion errors associated with Roche 454 platform (Ledergerber and Dessimoz, 2011). Since all bases of a homopolymer are included in a single cycle, its length has to be inferred from the signal intensity, thus, quality scores do not provide a measure that a base at a given position is correct, but merely indicate that homopolymer length has been called correctly (Dohm et al., 2008). The Ion Torrent PGM sequencer also presents limitations in sequencing homopolymers, leading to a large amount of indel errors, and a AT bias (Quail et al., 2012). Finally, SOLiD ma-chines that implement the sequencing-by-ligation method are incapable of sequencing through palindromic regions (Huang et al., 2012).
Softwares that aim at correcting errors, such as Fiona (Schulz et al., 2014), have emerged as solutions to improve the downstream analysis (Yang et al., 2013).
2.2.3 Third Generation Sequencing Technologies
Second-generation sequencing technologies are commonly known as the next-generation, but a third-generation has arisen with two main characteristics: PCR is not required before sequen-cing, meaning shorter DNA preparation time for sequensequen-cing, and the signal is captured in real time, i.e., the signal is monitored during the enzymatic reaction of adding nucleotides in the
complementary strand. The single-molecule real-time (SMRT) method, developed by Pacific Bioscience and the Nanopore are approaches that belong to this new generation of sequencing technologies (Liu et al., 2012b).
2.2.4 The FASTQ File Format
The sequencing technologies, such as Illumina and 454, produce a text-based output in which the DNA fragments — i.e., reads — are represented by sequences with the letters A, C, G, T and N; the first four letters represent nucleotide bases that can be present in a genome (Adenine, Cytosine, Guanine, and Thymine respectively), and, since the sequencing reading process is not perfect, in some cases the sequencer prefers to return a “not known” signal — hence the letter N — instead of returning an incorrect value. These reads are known as being base or letter space to distinguish from the colour space reads produced by SOLiD platforms.
@HWI-ST745_0097:7:1101:1005:1000#0/1 TTCTTCATACAGGGAAGCCTGTGCTTTGTACTAATTTCTTCATTACAAGATAAAAGTCT +HWI-ST745_0097:7:1101:1005:1000#0/1 <D=<D===<C<=<<=<EA.=<C<=B:<=<===<<C<=C==B;<=<=;=C=FC5';FB5! @HWI-ST745_0097:7:1101:1006:1000#0/1 CGCGCCAGAATGAAAAACAGAGTTCAAATTTTAAATGGACTACATCCAATGTTAAATAT +HWI-ST745_0097:7:1101:1006:1000#0/1 =>5C?+=862>6;=@7=C=;;8<=82=87:5C=<1FB4&=98C<<C<C=:<=::;EA3< @HWI-ST745_0097:7:1101:1007:1000#0/1 AAATGGACTACATCCAATGTTAAATATAAAAAACAAAAAGATGTAAATTTTACTGTCAC +HWI-ST745_0097:7:1101:1007:1000#0/1 <=<<=<<=<B:<=EA.<B:=C<<==<=<=<<=<<;B;===B;B:=B:B;<<==B:=<=D Figure 2.3: Extract from a file in FASTQ format. File produced by the ArtificialFastqGenerator (Frampton and Houlston, 2012).
The FASTQ file (Figure 2.3) format is the de facto common format for sequencing data. It provides a simple extension of the FASTA format, which is the ability to store a numeric score associated with each nucleotide base in a sequence. Thus, a FASTQ file consists of three different sub-sources: the headers (identifiers), sequence bases, and quality scores. The quality score for
2.2. Next-Generation Sequencing (NGS) Technologies
a base called is defined in terms of the estimated probability of error (Pe):
QPhr ed= −10 × log10(Pe)
Phred scores are the de facto standard representation for sequence base qualities. In the FASTQ format Phred qualities, whose value range from 0 to 93, are encoded in ASCII charac-ters with codes between 33 and 126 (corresponding to printable characcharac-ters), which gives a very broad range of error probabilities from 1.0 (a wrong base) to 10−9.3(an extremely accurate base) (Cock et al., 2010).
As illustrated in Figure 2.3, a FASTQ file format represents each read with four lines, where: 1. a first line started with the ’@’ character followed by record identifier and additional in-formation (such as, length or paired-end read inin-formation). Similar to the header of a FASTA file format, it is a free format field with no length limit or format restriction;
2. the second line holds the nucleotide base sequence, without white spaces, and the use of upper case is conventional (although not mandatory);
3. the third line begins with character ’+’ and is optionally followed by the header from line 1, because it only serves to signal the end of the sequence and the start of the next line; 4. the fourth and last line contains the ASCII-encoded quality scores and it must contain as
many symbols as the number of letters in line 2.
Because of its simplicity, FASTQ has become widely used as a simple interchange file format between tools. Solexa/Illumina has created its own versions of the FASTQ format wherein a different range for Phred scores are used (Cock et al., 2010); however, the different formats can be easily converted among them using Open Bioinformatic Foundation (O|B|F, 2015) tools (BioJava, 2015; Biopython, 2015; BioRuby, 2015; BioPerl, 2015; EMBOSS, 2015). On another note, next-generation sequence reads are typically available online at the Sequence Read Archive (SRA) which already has tools to convert the available data to FASTQ format (NCBI, 2015).
2.3 Survey of Read Mapping Algorithms
The emergence of NGS platforms enabled the production of billions of short-reads with their massively parallelised sequencing methods. On the other hand, the Human Genome Project established reference sequences for the human genome and some model organisms, such as E. coli, S. cerevisae, mouse and rat (Collins et al., 1998, 2003) enabling the resequencing using short-reads. Hence, NGS technologies have allowed to broaden the applicability spectrum of genomic sequencing, being finding the true location of a read within a genome a crucial step in many projects and its result will affect the downstream analysis. Today, an investigator has a fairly number of mappers — i.e., software to map the reads against a reference genome — avail-able, which go from the popular ones, like Bowtie (Langmead et al., 2009b), with the advantage of being widely used and constantly updated 2, or a recent one that aimed to outperform the existing tools with a new approach, such as Arioc (Wilton et al., 2015). For instance, the works of Holtgrewe et al. (2011) and Hatem et al. (2013) aims to help the user to choose the best tool for his needs.
The mapping process, i.e., aligning a read to a reference genome and find its true location, from the informatics point of view is a string matching problem. Algorithms to match strings have been proposed far before the advent of the NGS technologies (Baeza-Yates and Perleberg, 1992); however, although reads and genomes are simple strings constructed by the letters A, C, G, T and N, the challenge lies in distinguishing between technical sequencing errors and ge-netic variation within the sample. Thus, read mapping becomes an approximate string problem where the search for the read within the reference genome must allow some mismatches and gaps between the two (Reinert et al., 2015), while at the same time managing efficiently large amounts of data as well as a large search space in the form of a wide reference sequence. The advances in sequencing technology have stimulated the software development with many ap-proaches arising from the beginning (Li and Homer, 2010; Fonseca et al., 2012). However, most of the fast alignment algorithms build auxiliary data structures — the indices — for the reads or the reference sequence to find the genomic positions for each read, and we can group the mapping tools based on the method used to build the index: hash tables or Burrows-Wheeler
2.3. Survey of Read Mapping Algorithms
Transform (BWT) (Burrows and Wheeler, 1994).
2.3.1 Algorithms based on Hash Tables
All hash table based algorithms essentially follow the same ’seed and extend’ paradigm stated by BLAST (Altschul et al., 1990). This method allows BLAST to find similar sequences not by comparing either sequence entirely in its whole, but rather by locating short matches between two sequences — the seeds. After this first match it extends and joins the seeds first without gaps and then refines them by an improved Smith–Waterman alignment (Smith and Waterman, 1981; Gotoh, 1982). Finally, it outputs the statistically significant local alignments as the final results. However, the algorithms that are relevant to our work focus on mapping a set of short query sequences — the reads — against a long reference genome of the same species. And, for these the spaced seed — a seed that allows internal mismatches and the number of matches is its weight — a popular approach (Li and Homer, 2010). The detection of seeds usually follows one of the two methods: index the reads and scan through the reference genome or index the reference genome and align each read.
Index the reads and scan through the reference genome:
• MAQ (Li et al., 2008a), which uses the sequencing quality scores at the mapping, splits the reads to create adaptive seeds; to speed up the alignment, it only considers positions that have two or fewer mismatches in the first 28 bp (default parameters). MAQ relies on an ungapped alignment, but for the small fraction of unmapped reads it will apply the Smith-Waterman gapped alignment (Smith and Waterman, 1981).
• RMAP (Smith et al., 2008, 2009), also introduced the quality scores at the mapping, but it creates his spaced seeds using the pigeonhole principle (Baeza-Yates and Perleberg, 1992) — the reads are cut in k +1 pieces allowing at most for k mismatches in a mapping, which means any mapping must have at least one seed with no mismatches. RMAP does not consider insertions or deletions (indels), so its strategy for handling indels is to extend initial seed matches using a Smith-Waterman-style alignment. SeqMap (Jiang and Wong,
2008), follows the same pigeonhole principle to hash the reads, and since it splits the reads and/or the genome into several parts, can be used in parallel on large scale data sets to speed up the mapping process.
• RazerS (Weese et al., 2009) arose as a solution based on q-gram counting strategy, allowing for gaps within read subsequences of a size q — the index keys — and search for multiple matches before the extension step. RazerS 3 (Weese et al., 2012) is an improved RazerS able to map longer reads; it supports shared-memory parallelism and adds a second read index based on the pigeonhole principle. To extend the matches, they rely on Hamming distance (Hamming, 1950) and on the edit distance algorithm from Hyyrö (2003).
• SHRiMP (Rumble et al., 2009) introduces a specialized algorithm for mapping colour space reads from SOLiD sequencers, but it maps base space reads from Illumina/Solexa. It also relies on the q-gram counting strategy to find matches between the reads and the genome, which are extended using the local alignment algorithm by Smith-Waterman implemen-ted using specialized “vector” instructions that are part of the CPU instruction sets and, hence, are efficient.
Index the reference genome and align each read:
• SOAP (Li et al., 2008b), specifically designed for detecting and genotyping single nucle-otide polymorphisms (SNPs), manages great amounts of NGS data by supporting multi-threaded parallel computing and records the reference sequence and hash index tables in memory. The GNUMAP (Clement et al., 2010) algorithm incorporates the base quality scores into mapping analysis using a probabilistic variant of the Needleman-Wunsch al-gorithm (Needleman and Wunsch, 1970) to accurately map reads with lower confidence values; this tool creates overlapping contiguous k-mers — k-sized sequences — from the genome sequence to build the index and splits the reads into a set of overlapping k-mers to look up the index. Both tools were first designed for Illumina/Solexa data, but receive a FASTQ file as input.
• SHRiMP2 (David et al., 2011) is an updated version of SHRiMP, that switched to a genome index resulting in a dramatic speed increase and allowed to utilize multithreaded
compu-2.3. Survey of Read Mapping Algorithms
tation. Also to speed up the alignment, before starting the Smith-Waterman algorithm, SHRiMP2 checks if an identical region has already been aligned to reuse the score. This version supports Illumina/Solexa, Roche/454 and AB/SOLiD reads.
• mrFAST (Alkan et al., 2009) and mrsFAST (Hach et al., 2010) are both developed by lever-ing the same method, which creates a collision free hash table to index k-mers from the genome, interrogate the first, middle and last k-mers of each read in the hash table to place initial ungapped seeds and extends the seeds with a rapid version of the edit distance (Levenshtein, 1966); however, the former supports gaps and mismatches while the latter supports only mismatches as to lower its execution time. mrsFAST-Ultra (Hach et al., 2014) improves the method of mrsFAST by compacting the index and adding parallelisa-tion and SNP-awareness features.
• Hobbes (Ahmadi et al., 2012) is based on the generating of overlapping substrings of length q — grams — of the reference sequence, and constructs an inverted index of those q-gram positions. The extension of the seeds passes through a Hamming distance (Ham-ming, 1950) and an implementation of the edit distance by Myers (1999). Hobbes2 (Kim et al., 2014) is built on top of Hobbes, improving its performance in all aspects and scaling well in a multithreaded environment. The update included an additional prefix q-gram instead of bit vectors, reducing the memory consumption.
• MOSAIK (Lee et al., 2014) is a tool with the ability to map data from all major ’second’ and ’third’ sequencing technologies, that relies on an improved Smith-Waterman algorithm (Gotoh, 1982) to align a read to a local region of the genome. MOSAIK creates overlapping contiguous k-mers from the genome sequence to build a hash table. The reads are split into a set of overlapping k-mers to query the stored reference hash table and retrieve the genomic positions of each k-mer; a modified AVL tree (AdelsonVelskii and Landis, 1963) is employed to handle and cluster the nearby positions to form a k-mer region.
• Adaptive seeds are an alternative to fixed-length seeds, such as the spaced seeds, as they have their length extended until the number of matches in the target sequence is less than or equal to a frequency threshold. First proposed by Kiełbasa et al. (2011), in a BLAST variation, the adaptive seeds are used by AMAS (Hieu Tran and Chen, 2015) to speed up
the mapping process while preserving sensitivity and identifying all possible locations for each read being mapped.
Recent approaches, adapted the ’seed and extend’ method to parallel approaches based on specific hardware, like field programmable gate arrays (FPGA) (Chen et al., 2013) or graphical processing unit (GPU) (e.g, Masher (Abu-Doleh et al., 2013) and Arioc (Wilton et al., 2015)).
2.3.2 Algorithms based on Burrows-Wheeler Transform (BWT)
The Burrows-Wheeler Transform (BWT) is a data compression algorithm (Burrows and Wheeler, 1994) that was combined with a suffix array (Manber and Myers, 1993) — a sorted array of all suf-fixes of a string — to create the FM-index (Ferragina and Manzini, 2000). Algorithms that trans-form the genome into a FM-index reducing the inexact matching problem to an exact matching one: they find exact matches with the index and then create inexact alignments supported by exact matches. An advantage of this approach is that alignment to multiple identical copies of a subsequence in the reference is only needed to be done once, whereas with a typical hash table index an alignment must be performed for each copy. Moreover, finding exact matches using backwards search on a FM-index can be done in a constant time (Li and Homer, 2010). However, despite the improvements in performance and its small memory footprint, building a FM-index significantly takes longer than building a hash table index (which in turn requires a large memory to index wide genomes, like the human genome) (Fonseca et al., 2012; Hatem et al., 2013; Lee et al., 2014).
Popular BWT-based aligners are:
• Bowtie (Langmead et al., 2009b), which creates indices small enough to be distributed over the internet and easily accessible. Bowtie does not simply adopt the exact matching algorithm to search the FM-index, because exact matching does not allow for sequencing errors or genetic variations. So, it introduces a quality-aware backtracking algorithm that allows mismatches and favours high-quality alignments. It employs a ’double indexing’, a strategy to avoid excessive backtracking. Bowtie 2 (Langmead and Salzberg, 2012) ex-tends the method applied in Bowtie to allow gapped alignment by dividing the algorithm
2.3. Survey of Read Mapping Algorithms
between an ungapped seed-finding stage and a gapped extension stage, that uses dynamic programming. Bowtie 2 relies on the efficiency of single-instruction multiple-data (SIMD) parallel processing to accelerate the dynamic programming.
• Burrows-Wheeler Alignment tool (BWA) (Li and Durbin, 2009) emerged with an algorithm similar to Bowtie, but with a lower search space and adapted to map base space reads, e.g., from Illumina sequencers, and colour space reads from SOLiD machines. BWA-SW (Li and Durbin, 2010) adds a Smith-Waterman-like dynamic programming mechanism to BWA, so it can align long sequences up to 1000 base-pairs against a large sequence data-base with a few gigabytes of memory. In a way, BWA-SW follows the ’seed and extend’ paradigm by finding seeds between two FM-indices, relying on dynamic programming, and it extends a seed when it has few occurrences in the reference sequence; the seed is allowed to have mismatches and gaps in the seeds. BWA-MEM (Li, 2013) is implemented as a component of BWA, it also follows the ’seed and extend’ paradigm, however, it initially seeds an alignment with supermaximal exact matches using an algorithm from Li (2012), which essentially finds at each query position the longest exact match covering the pos-ition. While extending a seed, BWA-MEM tries to keep track of the best extension score reaching the end of the query sequence, as a strategy to automatically choose between local and end-to-end alignment.
• SOAP2 (Li et al., 2009b) is an improvement of SOAP (Li et al., 2008b) where the BWT com-pressed index is used instead of the seed algorithm for indexing the reference sequence in the main memory; a hash table is built to accelerate searching the location of a read in the BWT reference index and determine an exact match. SOAP3 (Liu et al., 2012a) is an optimised version of SOAP2, that achieves a significant improvement in speed by adapt-ing the BWT index to the graphic processadapt-ing unit (GPU). SOAP3-dp (Luo et al., 2013) is the enhanced version of SOAP3 that takes advantage of the GPU-based approach to perform dynamic programming for aligning a read with a candidate region in genome, a modified Smith-Waterman algorithm is implemented, and report alignments with indels and gaps. • CUSHAW (Liu et al., 2012c) exploits the compute unified device architecture (CUDA) to parallelise and accelerate an algorithm based on BWT that resorts to a FM-index. At the
time of the article publication, CUSHAW did not allow insertions and deletions; thus, the search for inexact matches was transformed to the search for exact matches of all per-mutations of each possible bases at every position of a short read. By default, CUSHAW supports a maximal read length of 128 (can be configured up to 256). CUSHAW2 (Liu and Schmidt, 2012) follows the ’seed and extend’ approach, using memory efficient versions of BWT and FM-index to generate seeds for each read; these seeds are based on maximal ex-act matches (MEM) — exex-act matches that cannot be extended in either direction without allowing a mismatch. CUSHAW2 aims to map longer reads, using the seeds to find gapped alignments and by employing vectorization and multithreading to achieve fast execution speed on standard multi-core CPUs. The Smith-Waterman algorithm is implemented to compute the optimal local alignment scores. CUSHAW3 (Liu et al., 2014) supports both base space and colour space reads, and it was developed to improve alignment sensitivity and accuracy of CUSHAW2. It relies on a hybrid seeding approach to improve alignment quality that creates MEM seeds based on BWT and FM-index, exact match k-mer seeds, and variable-length seeds at different phases of the alignment pipeline. However, the hy-brid seeding approach improves the alignment sensitivity and accuracy at the cost of a significant loss of processing speed.
• Masai (Siragusa et al., 2013), first constructs a conceptual suffix tree of the reference gen-ome, stores it on disk and reuses it for each read mapping job; then, at the mapping time, the strategy to create the seeds is chosen according to the reference genome and the spe-cified error rate. Each seed reported by a multiple backtracking algorithm is extended at both ends by a banded version of the Myers bit-vector algorithm (Myers, 1999) presented in RazerS 3 (Weese et al., 2012).
2.3.3 Best-mapper vs All-mapper
A best-mapper prioritizes candidate locations, and returns one or a few best mapping locations for each read, mainly to achieve an optimal combination of speed, accuracy, and memory ef-ficiency; moreover, BWT-based algorithms, such as Bowtie (Langmead et al., 2009b), Bowtie 2 (Langmead and Salzberg, 2012), versions of BWA(Li and Durbin, 2009, 2010; Li, 2013) apply an
2.4. Genomics meets Cloud Computing
exact match search to achieve that optimal combination. The hash-table based, MAQ (Li et al., 2008a) and SOAP (Li et al., 2008b) are also best-mappers. MAQ always reports a single align-ment, choosing a best position randomly if a read can be aligned equally well to multiple posi-tions; and, SOAP reports the best hit of each read which has minimal number of mismatches or smaller gap. Therefore, in case of equal best hits, the user can instruct the program to report all or randomly report one or disregard them all.
However, for some NGS applications an all-mapping task is essential, e.g. prediction of genomic variants or protein binding motifs located in repeat regions isoform expression quan-tification (Alkan et al., 2009; Hach et al., 2010; Newkirk et al., 2011). And, although best-mappers may have an option to report all mappings, since their algorithms are based in finding a unique search, they might not perform as well as mappers specialised in identifying as many as pos-sible, if not all, matches within a reasonable time — all-mappers. Most all-mappers follow the ’seed and extend’ paradigm in which locations reported by the seeds of a read are used as can-didates for extending the alignment to the rest of the read. Some well regarded all-mapping tools are mrFAST (Alkan et al., 2009) and mrsFAST (Hach et al., 2010), RazerS 3 (Weese et al., 2012), Hobbes (Ahmadi et al., 2012), Hobbes2 (Kim et al., 2014), Masai (Siragusa et al., 2013) and AMAS (Hieu Tran and Chen, 2015). On the other hand, when requested, MOSAIK (Lee et al., 2014) also outputs all possible mapping locations for every read in a separate output file, behaving simultenously as a best-mapper and an all-mapper.
2.4 Genomics meets Cloud Computing
Handling big amounts of data is a challenge known to informatics brought by the Internet and the natural technology evolution and massification. To deal with the massive grow in the num-ber of websites and information available, in the Internet, Google developed the MapReduce system to process huge quantities of data efficiently and in a timely manner. This programming model and system allows work to be distributed among large numbers of servers and carried out in parallel; soon after, an open source project that implements the Google MapReduce system emerged: the ApacheTM Hadoop®framework (The Apache Software Foundation, 2015b). The