A METACOGNITIVE DECISION MAKING BASED-FRAMEWORK FOR
BANK CUSTOMER LOYALTY MEASUREMENT AND MANAGEMENT
Fernando A. F. FERREIRAa, b, Marjan S. JALALIa,
Ieva MEIDUTĖ-KAVALIAUSKIENĖc, Bianca A. C. P. VIANAd
aISCTE Business School, BRU-IUL, University Institute of Lisbon, Avenida das Forças Armadas, 1649-026 Lisbon, Portugal bFogelman College of Business and Economics, University of Memphis,
TN 38152-3120, Memphis, USA
cFaculty of Business Management, Vilnius Gediminas Technical University, Saulėtekio al. 11, LT-10223 Vilnius, Lithuania
dSchool of Management and Technology, Polytechnic Institute of Santarém, Complexo Andaluz, Apartado 295, 2001-904, Santarém, Portugal
Received 03 December 2013; accepted 20 December 2013
Abstract. Bank customer loyalty is becoming a priority concern for banking institutions, as a means of gradually increasing complementary margins and eliminating the lack of liquidity caused by the current economic climate. Following a top down process, this focus culminates at the branch level, where banks’ front office employees are seen as a driving-force for building customer loyalty. At the same time, however, the difficulty in identifying and operationalizing the factors or determinants that most contribute to creating and maintaining bank customer loyalty has long been recog-nized. In this sense, based on the integrated use of cognitive maps and measuring attractiveness by a categorical based evaluation technique (MACBETH), this study proposes a multiple criteria framework for bank customer loyalty measurement and management. The results show that our framework allows bank customers with higher rates of customer loyalty to be identified and, from a benchmarking perspective, indicates what best practices should be followed to boost long-term relationships. Implications for scholars and practitioners are discussed.
Keywords: bank customer loyalty measurement, cognitive maps, decision making, MACBETH, operational research, sustainable relationship management.
JEL Classification: C44, D70, M21.
Corresponding author Fernando A. F. Ferreira E-mail: [email protected]
Copyright © 2015 Vilnius Gediminas Technical University (VGTU) Press http://www.tandfonline.com/TTED
2015 Volume 21(2): 280–300
Introduction
The banking activity has long been recognized as a major driving-force for economic devel-opment, and few would contest that the vast majority of the population has a close business relationship with their banks. Nevertheless, the most recent economic recession has contributed to a decrease in sales in many markets and, as a consequence, to intensified competition among banking institutions. Ferreira et al. (2012: 255) underline this premise, arguing that “regardless of
the causes and potential solution for the economic crisis, there is a general consensus that the turmoil triggered a very sharp increase in competition in the banking sector”. As a result, attracting and
retaining customers (i.e. ensuring bank customer repurchase intention or loyalty), as a means of gradually increasing complementary margins and eliminating the lack of liquidity caused by the current economic climate, has become a priority concern for banking institutions (Farquhar, Panther 2008; Minami, Dawson 2008; Kowalski, Shachmurove 2011). All the more so, because
“customer loyalty has been found to be the key mediating variable in explaining customer reten-tion” (Amin et al. 2012: 283). Following a top down process, this emphasis on customer loyalty
culminates at the bank branch level, where front office employees are seen as a driving-force for fostering customer loyalty (cf. Hartman et al. 2001; Bontis, Booker 2007; Hirtle 2007; Farahani 2012); particularly since “bank branches are the primary place in which consumers have access
to products for either building assets and/or obtaining credit” (Serna 2005: 2). At the same time,
however, it has long been recognized that identifying and operationalizing the factors (i.e. the internal determinants) that most contribute to bank customer loyalty is not an easy process; “the
fact that there are multiple intangible variables influencing branch attractiveness and profitability complicates the identification and development of evaluation systems” (Ferreira et al. 2012: 255).
Given this background, and taking into account that multiple criteria decision analysis (MCDA) tools have been widely applied in the treatment of complex decision problems (cf. Belton, Stewart 2002; Ackermann 2012), there is considerable scope to explore their applicability in the specific context of bank customer loyalty measurement and sustainable relationship management. Therefore, this paper aims to integrate cognitive maps and the measuring attractiveness by a categorical-based evaluation technique (MACBETH), to assist the measurement of bank customer loyalty, classifying individuals (or bank branches) ac-cording to their degree of commercial adhesion and, furthermore, support the establishment of strategic goals and growth perspectives.
Cognitive maps are known as a metacognitive instrument which allows the number of omitted criteria to be reduced, while promoting a better understanding of the relationships among criteria (Eden 2004; Eden, Ackermann 2004; Ackermann et al. 2011). With regard to MACBETH, its constructivist and humanistic nature has been argued to facilitate the estima-tion of weights (i.e. compensaestima-tions or trade-offs) among evaluaestima-tion criteria (cf. Bana e Costa
et al. 2012). We have found no prior documented evidence reporting this integrated
metacog-nitive decision making based-approach in the context of bank customer loyalty evaluation. By integrating these two approaches (i.e. cognitive mapping and MACBETH), our study also contributes to advance theory and empirical research on Operations Research (OR) and decision making, where the relevance of integrating OR techniques has long been argued (cf. Dyson 2000; Santos et al. 2002, 2008; Smith, Goddard 2002; Ackermann et al. 2011; Howick, Ackermann 2011; Ackermann 2012; Amado et al. 2012).
The remainder of the paper is organized as follows. Section 1 underlines the importance of bank customer loyalty measurement and presents a brief review of the literature. Section 2 presents the methodological background of the study, explains the procedural steps followed during the construction of our framework and presents the results achieved. The last section concludes the paper.
1. Literature review on bank customer loyalty
Although most people already have close business relationships with their banks, as com-petition has become increasingly fierce, so has customer loyalty become a priority concern for banking institutions. The idea is that a satisfied customer tends to be more receptive to new products and/or services and, as such, is more likely to remain loyal to the bank (Hsieh 2004; Farquhar, Panther 2008). Martin et al. (2009: 589) note that “loyal customers are more
likely to concentrate on long-term benefits from the relationship and are more willing […] to develop mutual benefits than non-loyal customers are”. This in turn allows bank branches to
achieve their business objectives more easily (cf. Boufounou 1995; Berger et al. 1996; Dekker, Post 2000; Ehigie 2006). As pointed out by Mihelis et al. (2001: 347), “customer satisfaction
represents a modern approach for quality in enterprises and organizations and serves the de-velopment of a truly customer-focused management and culture”.
It is worth highlighting that customer satisfaction (and the loyalty likely to result therefrom) brings benefits to both parties. From the bank perspective, “higher customer satisfaction and
loyalty can lead to stronger competitive position resulting in larger market share and profitability”
(Bayraktar et al. 2012: 99). This is particularly relevant because it has been argued that it is more profitable to retain good customers than to expend effort trying to attract new ones to replace those who have left the bank (cf. Hsieh 2004; Carbo-Valverde et al. 2011; Aghdaie et al. 2012). If bank branch front office employees are able to ensure customer satisfaction and loyalty, then the bank should also be able to achieve its financial and business goals. This requires, however, that customer loyalty be adequately measured. Measuring customer loyalty provides bank branches (and their respective banks) with better decision support mechanisms and the potential for better portfolio management (cf. Hsieh 2004). Mihelis et al. (2001: 347) note that the measurement of customer satisfaction and loyalty “offers an immediate, meaningful and objective feedback
about clients’ preferences and expectations”. In short, measuring customer loyalty can allow
bank branches to: (1) increase the degree of appropriateness, intervention and/or monitoring of bank account managers; (2) anticipate customer needs; (3) define a suitable business profile for each customer; (4) understand and target customers; (5) adapt promotional campaigns to customer needs; and (6) be aware of the profitability of each customer.
Given the importance of this issue, it is not surprising that there have been vast devel-opments in the customer satisfaction and loyalty literature, as well as attempts to measure these constructs, both within the banking context and outside of it (for a broad overview, see Garland, Gendall 2004; Manrai, L., Manrai, A. 2007; Pan et al. 2012). Bayraktar et al. (2012) highlight a variety of customer satisfaction indices, including the Swedish Customer Satisfac-tion Barometer (SCSB), the American Customer SatisfacSatisfac-tion Index (ACSI) and the European Customer Satisfaction Index (ECSI) (see also Johnson et al. 1996). These measures are based on the common assumption that customer satisfaction and loyalty can be derived from a
number of variables; for example: perceived quality, perceived value, customer expectations, and firm image (cf. Bayraktar et al. 2012). Amin et al. (2012), for instance, identify corporate image, perceived service quality, trust and switching cost as the four major dimensions that generally influence customer loyalty; and, using multiple regression analysis, show that these dimensions jointly explain 77 percent of the variance in customer loyalty (for an in-depth discussion and/or further variables that influence customer loyalty, see also Garland, Gendall (2004), Manrai, L., Manrai, A. (2007), Farquhar, Panther (2008), Arbore, Busacca (2009), Becker et al. (2009), Vesel, Zabkar (2009), Deng et al. (2010), Lee et al. (2010), Yoon (2010), Yoon et al. (2010), Bobâlcă et al. (2012), Pan et al. (2012), Yoo, Bai (2013)).
Notwithstanding the insights into customer acquisition and/or retention provided by these contributions, it should be highlighted that almost none of them is able to clearly explain why or how the particular combination of the dimensions or variables mentioned above was considered as the basis for their respective models. Indeed, most of these studies show the end results, but do not explain why they emerge, or how they can be improved. An excep-tion is the work of Lee et al. (2010), who used a means-end chain approach and elaborated a hierarchical loyalty map to obtain the criteria used. However, it is widely recognized that cognitive mapping can offer much more than a simple hierarchy of criteria.
A further limitation of the conventional approaches (e.g. parametric/regression analyses) centers around their limited ability to provide real/practical contributions to bank branch op-erative efficiency and sustainable relationship management (Garland, Gendall 2004). In this regard, the application of non-parametric techniques (e.g. Data Envelopment Analysis (DEA)), or other modern approaches (e.g. neural networks), constitutes a promising avenue in the field of bank customer loyalty measurement and sustainable relationship management (Hsieh 2004). Nonetheless, there is still an array “of factors that limit a comprehensive understanding of customer
loyalty and prevent the generalization of research findings” (Pan et al. 2012: 150); and, as such,
existing contributions do not put the discussion on customer loyalty measurement to rest. To summarize, the limitations pointed at the current approaches for bank customer loy-alty measurement can roughly speaking be grouped into two main categories: (1) limitations associated with the process by which the evaluation criteria are selected and articulated; and (2) shortcomings related to the calculation of trade-offs among the criteria considered in the evaluation mechanisms. As noted above, “the choice of loyalty measurement instruments is
somewhat arbitrary, which makes it difficult to generalize research findings across studies” (Pan et al. 2012: 150). There appears to be considerable scope, therefore, to explore the integrated
use of cognitive maps and MACBETH to assist the measurement of bank customer loyalty, classify individuals (and bank branches) according to their degree of commercial adhesion and support the establishment of strategic goals and perspectives. In the next section, we ex-emplify how the integrated use of these two approaches (i.e. cognitive maps and MACBETH) can support the conception and desirable implementation of a system for bank customer loyalty measurement and management.
2. A “new” measurement system
The integrated use of cognitive maps and MACBETH for performance measurement is relatively scarce, and to the best of our knowledge, this methodological approach has not previously been
applied in the context of bank customer loyalty measurement. This section shows how these two decision support instruments (i.e. cognitive mapping and MACBETH) can be integrated and applied in the construction of a new measurement system for bank customer loyalty.
Cognitive maps have long been recognized as an important metacognitive tool for structuring and clarifying complex decision problems (cf. Ackermann, Eden 2001; Eden, Ackermann 2001b; Belton, Stewart 2002; Tegarden, Sheetz 2003; Eden 2004; Ackermann et al. 2011). Depending on the degree of involvement of the participants, the use of these maps is generally seen as simple, interactive and versatile. These characteristics boost discussion among the participants involved in the decision making process (also known as actors), leading to a reduction in the number of omitted criteria and so increasing transparency and significantly improving the understanding of the decision situation.
MACBETH in particular was created during the 1990s by Carlos Bana e Costa and Jean Claude Vansnick (cf. Bana e Costa, Vansnick 1994; Bana e Costa et al. 2005) to quantify semantic judgments and support the construction of numerical interval scales. Based on a visual interactive software (i.e. M-MACBETH), the technique adopts a constructivist approach and is based on a simple qualitative question-answer procedure which provides the neces-sary information for decision makers to enter the domain of cardinal measurement. Given its interactive, humanistic and constructivist nature (cf. Belton, Stewart 2002), MACBETH can be expected to be of great applicability in dealing with compensations (i.e. weights or trade-offs) in bank customer loyalty measurement, namely because it takes into account the wisdom and professional experience of bank experts.
The procedural steps carried out during this study were organized in three main phases: (1) the structuring phase, where the relevant criteria for bank customer loyalty evaluation were identified based on the construction of a collective cognitive map; (2) the evaluation
phase, where the trade-offs among the evaluation criteria were calculated with recourse to
the MACBETH technique; and (3) the recommendations phase, where some advantages and shortcomings of the integrated use of cognitive maps and MACBETH for customer loyalty measurement were discussed.
2.1. The structuring phase
The structuring phase took place during two intensive group work sessions with an average duration of 4.5 hours. Various issues were addressed in this phase, namely: the definition of the panel of decision makers; the formulation of the “trigger question”; the design and val-idation of the collective cognitive map; and the conception of the tree of evaluation criteria and respective descriptors and impact levels.
2.1.1. Participants involved
The decision makers involved in a MCDA framework play an important role in the process of structuring and understanding the decision problem (Ferreira et al. 2011). This is because they are responsible for assisting the facilitator (i.e. researcher, scientist) in the design and implementation of the evaluation mechanisms.
While deciding on the size of the panel of decision makers, the difficulty of getting a group of bank branch front office employees together was particularly felt, given these de-cision makers’ limited availability to participate in the group meetings. After two months of
institutional contacts, we were able to form a panel of five bank branch front office employees from two of the most well-known banks in Portugal. Having decision makers from differ-ent banking institutions allowed us to confront and manage differdiffer-ent opinions on currdiffer-ent practices in bank customer loyalty evaluation. The group sessions were conducted by an experienced facilitator, accompanied by a communications technician who was responsible for registering the results.
2.1.2. Problem definition
As previously outlined, this paper aims to integrate cognitive maps with MACBETH, thus creating a support for bank customer loyalty appraisal, the classification of individuals (or bank branches) according to their propensity to establish commercial bonds, and to support the establishment of strategic goals and growth perspectives. In this sense, the problem con-sists of identifying multiple evaluation criteria and calculating their respective trade-offs. Furthermore, the resulting framework should allow bank customer loyalty to be measured, and its outputs to be used as references to compare performance and provide case-by-case improvement suggestions.
2.1.3. The SODA approach and the collective cognitive map
Given the decision makers’ limited time and availability, we started the structuring phase of the process following a methodological approach known as SODA II – a variant of the strategic options development and analysis (SODA) approach – (Eden, Ackermann 2001a; 2001b). More specifically, instead of starting the structuring process with individual work sessions (i.e. SODA I), we started directly with a first group meeting (i.e. SODA II), where the basic concepts related to cognitive mapping and the “post-its technique” were care-fully explained. Given this initial presentation, which is considered extremely important to avoid misunderstandings between the facilitator and the decision makers, we started the operational procedures by asking the panel members the following trigger question:
“Based on your own values and professional experience, what are the main reasons or factors that most influence customer loyalty?” This question provided the starting point (and focus)
for the discussion.
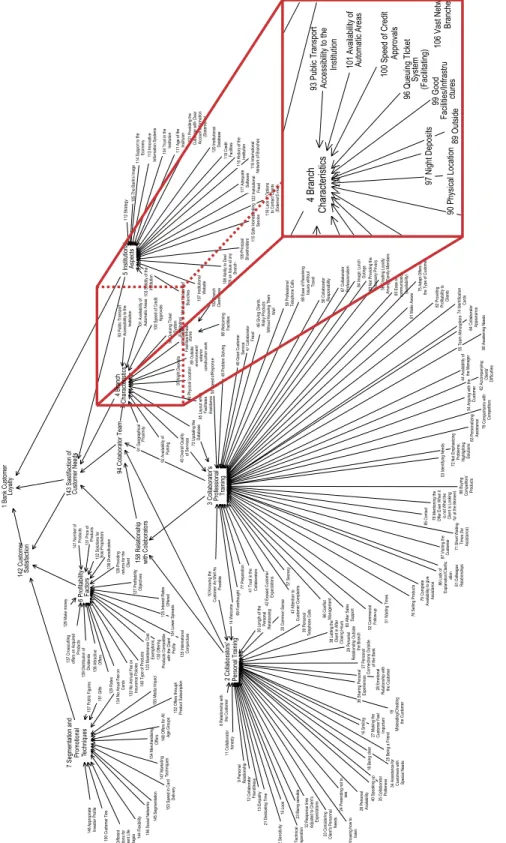
In broad terms, the initial step of the “post-its technique” consists of writing what decision makers consider as relevant criteria on post-its (one criterion per post-it), and sticking these post-its on a board/table. Based on discussion, the procedure should be repeated until the panel members demonstrate satisfaction with the number and depth of the criteria identified (for details, see Ackermann, Eden 2001). In a second stage of the technique, the post-its are then organized by clusters (also known in the literature as areas of concern), allowing additional debate and clarification regarding the significance of the criteria. At the end, each cluster is analyzed individually and the post-its are (re)organized following a means-end-based logic. The process usually concludes with the group’s agree-ment on the form and content of the collective/strategic map. In our study, the conception of the map was supported by the Decision Explorer software (www.banxia.com), and the final outcome is presented in Figure 1.
Figure 1 illustrates the size of the map, i.e. the final version that resulted from the discus-sion/negotiation process established among the decision makers, representing the group’s
Fig . 1. Fin al v er sio n o f t he co lle ct iv e/s tra teg ic m ap 24 Pretending not to 1 Bank Customer Loyalt y
2 Collaborators' Personal Training 3 Collaborator's Professional Trainin
g 5 Institutional Aspect s 6 Profitabilit y Factors
8 Relationship withthe Customer
9 Personal Relationship 10 Knowing th e Customer As Well As Possible 11 Collaborato r honest y 12 Collaborato r Friendliness 13 Empathy 14 Welcome 15 Look 16 Smilin g 17 Knowing how to liste n 18 Being clear 19 Misleading/Cheating the Customer 20 Common Sens e 21 Dedicating Time 22 Sensitivit y 23 Being sensible see 25 Being a Friend 26 Personal Availabilit y
27 Making the Customer Feel Important
28 Emotional
Relationship with the Customer
29 Personal Relationship Outsid e the Branch 30 Length of th e Personal Relationship 31 Technica l Preparation 32 Response tim e
Adjusted to Client'sExpectation
s
33 Considering Client's Personna
l
Need
s
34 Assistance for Customers with Special Need
s 35 Collaborato r Politenes s 36 Sharing Personal Experience s 37 Personal Connections Outside of the Bank
38 Letting the Client in Afte
r
Closing Hours
39 Personal Telephone Calls
40 Speaking up 41 Trust in th e Collaborators 42 Exceed Customer Expectation s 43 Attention to Customer Complaints
44 Availability ofthe Manage
r 45 Overall Qualit y of Services 46 Giving Client s Risky Products
Without Knowing Them
Well 47 Collaborator Frau d 48 Good Customer Servic e 49 Problem Solvin g 50 Sp eed of R epo ns e 51 Waiting Time s 52 CommercialFollow-u p 53 Identifying Need s 54 Arguing with th e Customer 55 Team Atmospher e 56 Creating Loyalty
Among Family Member
s 57 Secrecy 58 Collaborator Responsibilit y 59 Professiona l Telephone Calls
60 After SalesSuppor
t 61 Colleague Relationship s 62 Accompanying Clients' Difficulties 63 Personalizin g Assistanc e 64 CollaboratorAppearanc e
65 Ease of communication (availability)
66 Conflict Management 67 Collaborator Professionalis m 68 Ease of Resolvin g Issues withou t Travel 69 Forethough t 70 Complete
Availability to giveAssistance
71 Short Waitin
g
Times (for Assistance
) 72 Not Emphasizin g Problems; Highlightin g Solutions 73 Updating th e Database 74 Identificatio n Card s
75 Adapt Offers to the Type of Customer
76 Selling Products
77 Preparation
78 Mentioning th
e
Offer Even When itis not What th
e
Client is Lookin
g
for at the Moment
79 Comparisons with Competitor s 80 Awakening Need s 81 Make Awar e 82 Providin g Profitability toClient s 83 Not Providing th e Necessary Privac y 84 Image; Lunc h Outing s 85 Contact 86 Lack of Explanation/Clarific atio n
87 Visiting theCustomer
88 Buyin g Competitors ' Product s 89 Outsid e environment / exterior construction work 90 Physical Location 91 Geographica l Proximit y 93 Public Transpor t Accessibility to th e Institutio n 94 Colaborator Team 95 Layout whic h Facilitates Assistanc e 96 Queuing TIcket System 97 Night Deposits 98 Welcomin g Facilitie s 99 Good Facilities/Infrastr u ctures 100 Speed of Credit Approval s
101 Availability of Automatic Area
s 102 Branch Cleanlines s 103 Solidity of th e Institutio n 104 Trust in th e Institutio n
105 The Bank's Image
106 Vast Network of
Branches 107 Institutiona
l
Websit
e 108 Ability to Deal With an Issue at any
Branc h 109 Principal Shareholder s 110 History of th e Institutio n 111 Age of th e Instituion 112 Strategy 113 Innovativ e Information System s 114 Support to th e Econom y 115 Safe Homebanking Servic e 116 Lack of Option s to Contact Client s (External E-mail) 117 Adequat e Software 118 International Network of Branches 119 Credi t Facilitie s 120 InstitutionalDatabase 121 Providing th e
Customer with Clea
r Account Informatio n (Statements) 122 Institutional Frau d Exemption s Offered 126 Make mone y Objective s
128 Providing returns for th
e Client 129 Rate s 130 Offering Products Compatible
with the Client
Profile 131 Price ofProduct s 132 Solutions fo r Sole Proprietors
133 No Annual Fee onInsurance Policies
134 No Anual Fee on Card s 135 InternationalConjunctur e 136 Attractiv e Offers
137 Crosscutting offers on Acquired
Product s 138 Diversification 139 Distribuiion of Dividend s 140 Type of Products 141 Number ofProduct s 142 Customer Satisfaction 143 Sastifaction of Customer Needs
144 Flexibilit y 145 Segmentation 146 Appropriat e Investor Profile 147 Marketing Techniques 148 Offers for Al l Age Groups 149 Dif feren t Solutions fo r Di
fferent LIfe Stages
150 Customer
Ties
151 Gifts
152 Offers through Product Subscriptio
n 153 Speed in Card Delivery 154 Merchandisin g Offers 155 Media Impact 156 Social Network s 157 Public Figure s 158 Relationshi p with Colaborator s 124 Lower Spreads 125 Interest Rate s 127 Profitabilit y 7 Segmentation and Promotional Techniques 123 Maintenance Cost 4 Branch Characteristics 92 Availability of Parkin g (Facilitating) 89 Outside 90 Physical Location
93 Public Transport Accessibility to the
Institution 96 Queuing TIcket System 97 Night Deposits 99 Good Facilities/Infrastru ctures 100 Speed of Credit Approvals
101 Availability of Automatic Areas
106 Vast Netw Branche 4 Branc h Characteristics (Facilitating)
consensus on the criteria that should allow bank customer loyalty to be evaluated. Naturally, the conception of a cognitive map is always dependent on the decision circumstances, the experts involved, facilitator skills and/or session durations. This context-dependence can be seen as a methodological limitation, but it is arguably more than compensated by the group’s direct involvement, and the amount of information discussed, both of which make cognitive mapping very valuable for the structuring and understanding of decision situations (Ferreira
et al. 2012). Additionally, the iterative nature of the process allows group members to share
their thoughts and/or to explore new ones, “contributing to reduce the rate of omitted criteria
and increasing the understanding of the relationships between criteria” (in decision makers’
own words). All in all, cognitive maps should be understood as tools to provide consolidated decision information based on the opinions of a group of experts. Furthermore, the approach is process-oriented and provides the participants with adjustment possibilities.
2.1.4. Criteria, descriptors and impact levels
Following Keeney’s (1992, 1994) methodological guidelines, the next step consisted in identi-fying the key evaluation criteria (also known as fundamental points of view (FPVs)) in each cluster of the strategic map. This interactive procedure was accomplished during a second group session, and allowed the group to construct a tree of criteria. Due to the subjective nature of this procedural step, the transition from the collective map to the tree of criteria was not without challenges. The process was facilitated, however, because it was based on a strategic map, which has been shown to make “the construction of a tree of evaluation criteria” easier (Ferreira et al. 2012: 263).
At this stage of the process, the tree’s properties were carefully tested (for details, see Ferreira et al. 2011), and the decision makers were allowed to introduce adjustments in accordance with their own collective perceptions. The definition of the final structure was supported by the M-MACBETH software (www.m-macbeth.com), and it is presented in Figure 2, where the FPVs are marked in bold.
It should be clarified that, according to the groups’ own interpretation of the tree, FPV1 –
In-stitutional Aspects – concerns the reputation and strategic dimension of the bank. InIn-stitutional aspects can be considered good or bad depending on variables such as: the bank’s tradition, social capital and organic/network dimension. FPV2 – Bank Branch Characteristics – addresses issues regarding the physical characteristics/infrastructures of the bank branches. It seeks to introduce evaluation references such as accessibilities, convenience and layout / architectural attractiveness. FPV3 – Human Resources’ Professional Training – is associated with the
profes-sional experience and technical skills of the collaborators (e.g. front office employees). Concerns regarding trust, availability and professional experience, for example, are introduced in the evaluation system through this criterion. FPV4 – Human Resources’ Personal Characteristics – addresses issues related to honesty, friendliness, ethical posture and customer treatment. FPV5 – Profitability – underlines the importance of economic factors, such as: interest rates, loan/credit conditions, annual fees and maintenance costs. Finally, FPV6 – Segmentation and
Promotion Techniques – concerns issues related to marketing and portfolio management (i.e. products or services), such as: variety of products and services offered, promotional campaigns and impact on media. According to the panel members who participated in this study, some of the criteria included in our evaluation system are seldom taken into consideration when it comes to customer loyalty evaluation. This observation bodes well, because it shows that the use of structuring techniques such as cognitive maps allows hitherto omitted criteria to be identified and incorporated in the decision process.
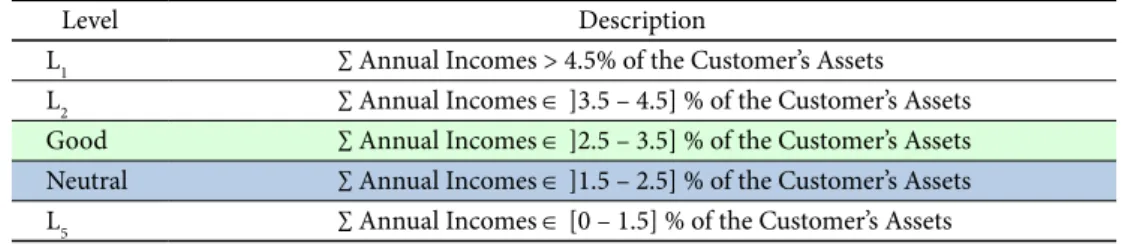
With the tree of criteria discussed and approved, the decision makers were asked to con-struct a descriptor for each FPV. A descriptor is a set of impact/performance levels ordered by degree of importance/attractiveness, and it is defined with the direct involvement of the decision makers. For example, FPV5 – Profitability – becomes operational based on a descriptor of five ordered impact levels (Li with i =1, 2, ..., 5), which allows bank customer
loyalty to be assessed based on the customer’s degree of profitability (Table 1).
Table 1. Descriptor and impact levels for FPV5
Level Description
L1 ∑ Annual Incomes > 4.5% of the Customer’s Assets
L2 ∑ Annual Incomes ∈ ]3.5 – 4.5] % of the Customer’s Assets
Good ∑ Annual Incomes ∈ ]2.5 – 3.5] % of the Customer’s Assets
Neutral ∑ Annual Incomes ∈ ]1.5 – 2.5] % of the Customer’s Assets
L5 ∑ Annual Incomes ∈ [0 – 1.5] % of the Customer’s Assets
As can be seen, and was explained by the decision makers, the greater the rate of a cus-tomer’s annual income (when balanced by that cuscus-tomer’s assets), the higher his/her partial score and his/her propensity to be loyal to the bank. In order to facilitate cognitive compar-isons, two of the levels were distinguished as good and neutral (i.e. L3 was considered as a
good performance level, and L4 was considered neutral) (for further details on the
import-ance these reference levels (or “anchors”) see Ferreira et al. 2012). From a technical point of view, this procedure allowed performance levels to be sorted, and created the basis for the definition of a value function for each FPV. After repeating this procedure for all the FPVs, we initiated the evaluation phase.
2.2. The evaluation phase
The evaluation phase of this study was conducted during a third and last group session, where the trade-offs among impact levels and among evaluation criteria were defined with the direct involvement of the decision makers. This last group session took almost 6 hours, but was important to test the “new” evaluation system and to analyze and discuss the results. 2.2.1. Value judgments and local preferences
Six value judgement matrices (i.e. one matrix per descriptor) were constructed during this stage in order to project the decision makers’ local preferences and to obtain a cardinal value function for each descriptor. To assist in filling in the matrices, we applied MACBETH and predefined categories of semantic difference of attractiveness: C0 – null, C1 – very weak,
C2 – weak, C3 – moderate, C4 – strong, C5 – very strong and C6 – extreme (see Bana e Costa,
Vansnick 1994).
Inspired on the mathematical principles of Doignon (1984), MACBETH is based on numerical representations of semi-orders for multiple thresholds (cf. Bana e Costa, Vans-nick 1999). Conceptually, this means that in an ordered structure of m binary relations
(1) (2) ( ) ( )
[P ,P ,P k , , ] Pm (where P stands for a preference that is stronger the greater the k), ( )k it is possible to convert value preferences into numbers. Specifically, if X = {a, b,..., n} is a finite set of n choice alternatives (also known as actions; see Roy 1985), the technique consists in associating each element of X to a value x (resulting from a value function v(.): X→R), such that differences as v(a) – v(b) (with aP b (i.e.a strictly more attractive than b)) are as compatible as possible with the decision makers’ value preferences. In this sense, for each pair of choice alternatives (a, b) allocated to a certain category Ck of semantic difference of
attractiveness, the differences v(a) – v(b) will belong to the same interval, without overlaps. For example, if a is considered more attractive than b and the difference between both alternatives is moderate, then ( , )a b C∈ . According to Bana e Costa et al. (2008), whereas 3 two contiguous ranges correspond to two consecutive qualitative categories of difference of attractiveness, the technique consists in the association of asymmetric partitions of the ray of positive real numbers to partition classes of ordered pairs (a, b) (with aPb). In this sense, intervals between categories of consecutive differences of attractiveness are introduced with recourse to a value function v and function thresholds sk as presented in formulation (1):
( ) 1 : ( ) ( ) k k k aP b s <v a v b s− < + . (1)
In practice, the definition of intervals between semantic categories of difference of at-tractiveness becomes easier if one takes into account that the thresholds sk are positive real constants. Additionally, “the basic idea underlying the initial development of MACBETH was
that limits of these intervals should not be arbitrarily fixed a priori, but determined simultan-eously with numerical value scores for the elements of X” (Bana e Costa et al. 2005: 412). In
this sense, based on value judgments, the technique consists in the allocation of differences of attractiveness between pairs of actions to the previously identified categories of semantic difference of attractiveness. Formulations (2) and (3) are then analyzed for consistency purposes (cf. Junior 2008):
, : ( ) ( )
a b X v a v b aPb
{
}
* * * , 1,2,3,4,5,6 , , , , with ( , ) and ( , ) : 1 ( ) ( ) ( ) ( ). k k k k a b c d X a b C c d C k k v a v b v c v d ∀ ∈ ∀ ∈ ∈ ∈ ≥ + ⇒ − ≥ − (3)Formulation (2) presents the logical assumption that if aPb, then it is possible to associate numbers to these two alternatives, as long as v(a) > v(b). If no cognitive difference between alternatives is felt and, thus, a is as attractive as b (i.e. a I b), then v(a) = v(b), and the pair
0
( , )a b ∈C. Based on the predefined categories Ck, formulation (3) states “that all of the
dif-ferences allocated to one semantic preference difference category are strictly larger than those allocated to a lower category” (Bana e Costa et al. 2008: 28). Once the consistency of the decision
makers’ value preferences has been analyzed, linear programming minimizing v(n) is applied according to formulation (4) (cf. Junior 2008). This allows an initial scale to be generated, which should be discussed, modified (if necessary) and approved by the decision makers.
( ) . . : , : ( ) ( ) 1 Min v n S T ∀a b X aPb v a v b∈ ⇒ ≥ + ; , : ( ) ( ) a b X aIb v a v b ∀ ∈ ⇒ = ; ( , ),( , )a b c d X,
∀ ∈ if the difference of attractiveness between
a and b is bigger than between c and d, then:
( ) ( ) ( ) ( ) 1 ( , , , ) v a v b v c v d− ≥ − + + δa b c d ( ) 0 v a− = , where: n is an element of X so that ∀a b c, , ,...∈X n P I a b c: ( ∪ ) , , ,...; a−is an element of X so that ∀a b c, , ,...∈X a b c P I a: , , ,...( ∪ ) −; ( , , , )a b c d
δ is the minimal number of categories of difference of attractiveness between the difference of attractiveness between a and b and
the difference of attractiveness between c and d. (4) It should be explained that mathematically n is the most attractive (or at least as at-tractive as the others) element of X (i.e. n ( P I∪ ) a, b, c,…), and its value minimization ensures the minimal length of the initial scale. In its turn, a- is the least attractive (or at
least as attractive as the others) element of X (i.e. a, b, c,…( P I∪ ) a–) and, according to
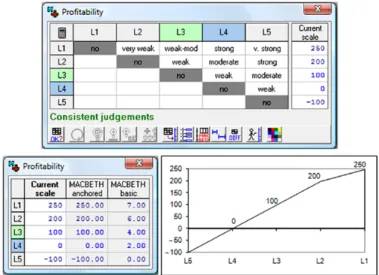
Bana e Costa et al. (2008), its value represents the “zero” of the scale. In practice, this technical procedure is repeatedly executed until a value function for each descriptor is defined. The usefulness of the M-MACBETH software should be underlined here, since it offers opportunities for decision makers to reconsider their options and bypass possible inconsistencies in their value judgments. Figure 3 illustrates the value judgments, scales and value function obtained for FPV5.
In addition, it is worth noting that mutual preferential independence tests were conducted. As argued by Belton and Stewart (2002), Bana e Costa and Chagas (2004), Bana e Costa et al. (2005) and Ferreira et al. (2012), these tests serve to guarantee that preferential independence among criteria is respected, which is an important condition for the calculation of trade-offs.
Once a cardinal value scale for each descriptor was obtained (i.e. local scales that allow customer loyalty to be partially appraised), the next step consisted in the calculation of trade-offs among FPVs. These trade-offs (also known as weights or substitution rates) are a pre-requisite to get an overall assessment of bank customer loyalty.
2.2.2. The trade-off procedures
The team of facilitators started this phase of the process by asking the decision makers to rank the FPVs according to their overall attractiveness. To accomplish this objective, a matrix of comparisons was created and, based on a cognitive technique that allows an alternative a0 (composed of the worst impact levels) to be compared to an alternative an (composed of the
best impact levels), the FPVs were compared in pairs (for technical support, see Bana e Costa, Chagas 2004). The panel members were then invited to express value preferences regarding the difference of attractiveness among the ordered FPVs. The procedure used in this stage was similar to the one used for calculating the local scales (see Fig. 3). As before, a scale was obtained and proposed for discussion, which provided the decision makers with the trade-offs among FPVs (Fig. 4).
With the trade-off values discussed and approved by the decision makers, the additive value model presented in formulation (5) (Bana e Costa et al. 2008) was then applied, allowing bank customer loyalty to be measured:
( ) 100
( ) ( ) with 1 and 0 and ( ) 0
1 1 n n v goodi i V a x v ai i xi xi v neutral i i i i = = ∑ ∑ = > = = = . (5)
In practice, this additive model allows the partial scores vi(a) to be aggregated and an
overall score V(a) for each customer to be calculated. As can be deduced, V(a) represents a
holistic measure of customer loyalty. Mathematically, vi(goodi) and vi(neutrali) represent the
partial scores of two specific performance levels (i.e.good and neutral) that have been defined to facilitate cognitive comparisons.
2.2.3. Measuring bank customer loyalty
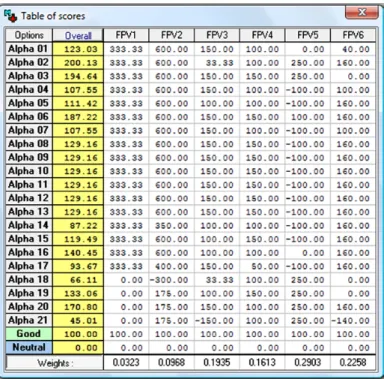
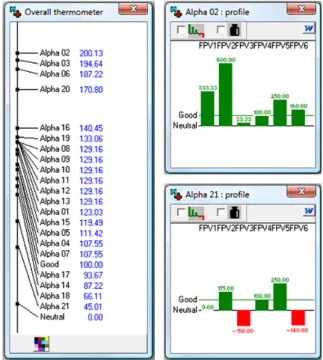
The group started this stage of the process by iden-tifying partial performance levels for each customer under evaluation. This was accomplished using information on 21 bank customers, randomly and anonymously provided by the participating decision makers (i.e. four or five bank customers per decision maker). In spite of the low number of customers, this information was extremely useful to test the evaluation system and increase the interest of the participants. Table 2 shows the partial performance levels of the customers evaluated (called Alphas).
The partial scores of the Alphas were obtained based on the numerical scales previously defined for each descriptor. Next, formulation (5) allowed these partial scores to be aggregated and an overall score for each Alpha to be obtained. Those values are presented in Table 3, where Good and Neutral are two fictitious customers that have been included in the
Fig. 4. Criteria weights
Table 2. Levels of partial performance revealed by the customers evaluated
model to facilitate cognitive comparisons (i.e.Good represents a customer who performs at a good level for all FPVs, while the Neutral stands for a customer who performs at a neutral level for all FPVs).
As can be seen, this procedural step allowed partial loyalty values to be understood and compared. For example, Alpha 02 reveals the best performance levels of FPV1, FPV2, FPV5
and FPV6, but is also one of the worst performers at FPV3, and this influences his/her overall
score. One should bear in mind, however, that the performance of Alpha 02 on FPV3 is of
extreme importance from a negotiation and constructivist perspective. Indeed, it not only enabled the panel members to better understand the meaning of partial loyalty but it also allowed focused improvement suggestions to be identified. Given the overall scores for the twenty one customers (plus Good and Neutral), their ranking was obtained and discussed by the decision makers (Fig. 5).
As shown in Figure 5, Alpha 02 has the potential to be the most loyal customer (i.e. over-all score of 200.13), while Alpha 21 was found to be the worst performer (i.e. overover-all score of 45.01). It should be recalled, however, that such rankings are not the major purpose of the proposed evaluation system. As discussed, special emphasis is given to the constructive discussion and/or improvement suggestions that, from a benchmarking perspective, can emerge from the results (for discussion, see Belton, Stewart 2002).
2.2.4. Analyzing the results
The customer loyalty evaluation system developed in this study allowed the panel members to: (1) discriminate bank customers according to a loyalty model that was constructed based on the decision makers’ own preferences and value judgments; (2) compare the relative positions of different bank customers against two cognitive references (i.e.Good and Neutral); (3) boost discussion regarding the results, allowing transparency to be increased; (4) identify focused improvement suggestions based on the lower performance levels achieved by customers in some of the FPVs; and (5) demonstrate the practical applicability of the integrated use of cognitive mapping and MACBETH in a bank customer loyalty evaluation context.
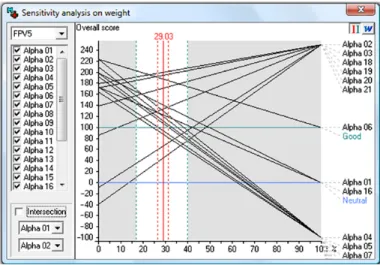
Bana e Costa and Chagas (2004), Ferreira et al. (2011) and Ferreira et al. (2012) defend that once a final ranking is obtained, discussed and approved by the panel members, this phase of the process (i.e. evaluation phase) may be considered completed. It is worth not-ing, however, that additional analyses (e.g. sensitivity and robustness analyses) are usually recommended to strengthen the results. Figure 6 exemplifies the sensitivity analysis carried out for FPV5 (i.e. the most important criterion for the group).
The results of this sensitivity analysis are indicative of the strength of our framework, since the weight obtained for FPV5 (i.e. 29.03%) is flexible enough to vary without
violat-ing the Alphas’ final positions. This result allowed the decision makers’ value judgments to be reinforced. In addition, this procedure was repeated for all the FPVs, which served to promote additional discussion among the group members and determine the basis for recommendations.
Fig. 5. Final ranking of customer loyalty and performance profiles for the best and worst alphas
2.3. The recommendations phase
The receptiveness and satisfaction expressed by the panel members support the fact that the methodological proposal presented in this study allowed encouraging results to be achieved. It should be recalled, however, that this proposal is not outcome-oriented; i.e., it is a pro-cess-oriented framework, where a non-prescriptive position has always been assumed. From this premise, our model should be seen as a learning mechanism and not as a tool to prescribe optimal solutions. Indeed, the results aim to encourage discussion and to promote a better understanding of the criteria associated with bank customer loyalty evaluation.
As previously pointed out, our results are strongly dependent on the decision context and on the participants involved. As such, any extrapolation to other decision contexts and/or groups of decision makers should be carefully analyzed. Although this can be seen as a weakness, it should be recalled that the methodological proposal presented here also offers adjustment possibilities (e.g. complementing the strategic map and/or adjusting the trade-offs among FPVs to capture different strategic priorities and orientations). In this sense, additional sensitivity and robustness analyses after potential adjustments are also of great importance.
Conclusions
Present-day economic thinking has reinforced the need to understand the impact of compet-ition on retail banking, where banking institutions are expected to “place more emphasis on
improving internal operational performance” (Wu 2012: 303). As a result, the attraction and
desirable retention of customers (i.e. bank customer loyalty), as a means of reducing liquidity issues and increasing margins, has become a priority concern for banking institutions. This, however, requires customer loyalty be adequately measured. When adequately managed,
such a measurement process can allow banks to: (1) increase the degree of appropriateness, intervention and/or monitoring of bank account managers; (2) anticipate customer needs; (3) define a suitable business profile for each customer; (4) understand and target customers; (5) adapt promotional campaigns to customer needs; and (6) be aware of each customer’s profitability. In spite of the remarkable progress which has taken place over the years in bank customer loyalty evaluation, there are still limits to the generalizability of existing research findings (Pan et al. 2012), such that the discussion on customer loyalty measurement is far from over.
Given the limitations of existing models with regard to the process by which evaluation criteria are selected, as well as shortcomings related to the calculation of trade-offs among those criteria, this paper proposed a methodological framework to evaluate bank customer loyalty. This framework resulted from the direct involvement of professional bank decision makers, and assumed a process-oriented orientation. Our proposal sees customer loyalty assessment as a complex decision problem, where evaluations are not easy and are strongly dependent on different stakeholders with different and (often) conflicting values and pref-erences (for discussion, see Ackermann, Eden 2011). In this context, searching for optimal solutions was considered as an unrealistic possibility; and, in this sense, we used cognitive maps to support criteria selection and applied the MACBETH technique to obtain the trade-offs among those criteria. The integrated use of these two methodologies allowed the panel members to: (1) discriminate bank customers using a loyalty model that was constructed based on the decision makers’ own preferences and value judgments; (2) compare the relative positions of different bank customers against cognitive references; (3) discuss results, thus increasing transparency; (4) identify focused improvement suggestions; and (5) demonstrate the practical applicability of the integrated use of cognitive maps and MACBETH in this particular context. To the best of our knowledge these two methods had not hitherto been used together in the context of bank customer loyalty measurement and management.
Due to the strong dependence on the context of analysis and on the participants involved, the outcomes of our methodological proposal should be applied with some caution. In partic-ular, it is worth noting that the procedures followed are subjective in the selection of criteria and their weighting. However, as argued by Santos et al. (2002), one should remember that the MCDA approach defends that all decision making is inherently subjective and, as such, there is major value in making such subjectivity explicit and integrating it in a transparent way with objective data.
In terms of future research, more case studies are strongly encouraged. Specifically, we recommend: (1) panel studies with different decision makers from other banks to confirm the robustness of the results achieved; (2) panel studies within a different country and/or region to increase generalizability; (3) the creation of crossed-panel surveys to increase the reliability of the results; and (4) the comparison of the results obtained from the application of different approaches/techniques in the context of this study. Additionally, it would also be of interest to assess the consequences of the recent economic crisis on bank customers’ preferences. Desirable improvements and updates can help strengthen the methodological proposal presented and discussed in this paper.
Acknowledgments
The authors gratefully acknowledge the superb contribution and infinite willingness of the panel members: Ana Luísa Morgado, António Neves, Erica Vaz, Joana Reis and JoãoAguiar. Institutional and facility support from the ISCTE Business School, University Institute of Lisbon, Portugal, is also acknowledged.
References
Ackermann, F. 2012. Problem structuring methods ‘in the dock’: arguing the case for soft OR, European
Journal of Operational Research 219(3): 652–658. http://dx.doi.org/10.1016/j.ejor.2011.11.014
Ackermann, F.; Andersen, D.; Eden, C.; Richardson, G. 2011. ScriptsMap: a tool for designing multi-method
policy-making workshops, Omega. 39(4): 427–434. http://dx.doi.org/10.1016/j.omega.2010.09.008
Ackermann, F.; Eden, C. 2001. SODA – Journey making and mapping in practice, in J. Rosenhead, J. Mingers (Eds.). Rational analysis for a problematic world revisited: problem structuring methods for
complexity, uncertainty and conflict. 2nd ed. Chichester: John Wiley & Sons, 43–60.
Ackermann, F.; Eden, C. 2011. Strategic management of stakeholders: theory and practice, Long Range
Planning 44(3): 179–196. http://dx.doi.org/10.1016/j.lrp.2010.08.001
Aghdaie, S.; Sanayei, A.; Etebari, M. 2012. Evaluation of the consumers’ trust effect on viral marketing acceptance based on the technology acceptance model, International Journal of Marketing Studies 48(6): 79–94.
Amado, C.; Santos, S.; Marques, P. 2012. Integrating the data envelopment analysis and the balanced scorecard approaches for enhanced performance assessment, Omega. 40(3): 390–403.
http://dx.doi.org/10.1016/j.omega.2011.06.006
Amin, S.; Ahmad, U.; Hui, L. 2012. Factors contributing to customer loyalty towards telecommunication service provider, Procedia – Social and Behavioral Sciences 40: 282–286.
Arbore, A.; Busacca, B. 2009. Customer satisfaction and dissatisfaction in retail banking: exploring the asymmetric impact of attribute performances, Journal of Retailing and Consumer Services 16(4):
271–280. http://dx.doi.org/10.1016/j.jretconser.2009.02.002
Bana e Costa, C.; De Corte, J.; Vansnick, J. 2012. MACBETH, International Journal of Information
Technol-ogy and Decision Making 11(2): 359–387. http://dx.doi.org/10.1142/S0219622012400068
Bana e Costa, C.; Chagas, M. 2004. A career choice problem: an example of how to use MACBETH to build a quantitative value model based on qualitative value judgments, European Journal of Operational
Research 153(2): 323–331. http://dx.doi.org/10.1016/S0377-2217(03)00155-3
Bana e Costa, C.; De Corte, J.; Vansnick, J. 2005. On the mathematical foundations of MACBETH, in J. Figueira, S. Greco, M. Ehrgott (Eds.). Multiple criteria decision analysis: the state of the art surveys.
New York: Springer, 409–442. http://dx.doi.org/10.1007/0-387-23081-5_10
Bana e Costa, C.; Lourenço, J.; Chagas, M.; Bana e Costa, J. 2008. Development of reusable bid evaluation models for the Portuguese electric transmission company, Decision Analysis 5(1): 22–42.
http://dx.doi.org/10.1287/deca.1080.0104
Bana e Costa, C.; Vansnick, J. 1994. MACBETH: an interactive path towards the construction of cardinal value functions, International Transactions in Operational Research 1(4): 489–500.
http://dx.doi.org/10.1016/0969-6016(94)90010-8
Bana e Costa, C.; Vansnick, J. 1999. Preference relations and MCDM, in T. Gál, T. Stewart, T. Hanne (Eds.).
Multiple criteria decision making: advances in MCDM models, algorithms, theory, and applications.
Bayraktar, E.; Tatoglu, E.; Turkyilmaz, A.; Delen, D.; Zaim, S. 2012. Measuring the efficiency of customer satisfaction and loyalty for mobile phone brands with DEA, Expert Systems with Applications 39(8):
99–106. http://dx.doi.org/10.1016/j.eswa.2011.06.041
Becker, J.; Greve, G.; Albers, S. 2009. The impact of technological and organizational implementation of CRM on customer acquisition, maintenance, and retention, International Journal of Research in
Marketing 26(3): 207–215. http://dx.doi.org/10.1016/j.ijresmar.2009.03.006
Belton, V.; Stewart, T. 2002. Multiple criteria decision analysis: an integrated approach. Dordrecht: Kluwer
Academic Publishers. http://dx.doi.org/10.1007/978-1-4615-1495-4
Berger, A.; Leusner, J.; Mingo, J. 1996. The efficiency of bank branches, Journal of Monetary Economics
40(1): 141–162. http://dx.doi.org/10.1016/S0304-3932(97)00035-4
Bobâlcă, C.; Gătej, C.; Ciobanu, O. 2012. Developing a scale to measure customer loyalty, Procedia –
Economics and Finance 3: 623–628.
Bontis, N.; Booker, L. 2007. The mediating effect of organizational reputation on customer loyalty and
service recommendation in the banking industry. Emerald.
Boufounou, P. 1995. Evaluating bank branch location and performance: a case study, European Journal
of Operational Research 87(2): 389–402. http://dx.doi.org/10.1016/0377-2217(92)00080-5
Carbo-Valverde, S.; Hannan, T.; Rodriguez-Fernandez, F. 2011. Exploiting old customers and attracting new ones: the case of bank deposit pricing, European Economic Review 55(7): 903–915.
http://dx.doi.org/10.1016/j.euroecorev.2011.02.001
Dekker, D.; Post, T. 2000. A quasi-concave DEA model with an application for bank branch performance evaluation, European Journal of Operational Research 132(2): 296–311.
http://dx.doi.org/10.1016/S0377-2217(00)00153-3
Deng, Z.; Lu, Y.; Wei, K.; Zhang, J. 2010. Understanding customer satisfaction and loyalty: an empirical study of mobile instant messages in China, International Journal of Information Management 30(3):
289–300. http://dx.doi.org/10.1016/j.ijinfomgt.2009.10.001
Doignon, J. 1984. Threshold representations of multiple semiorders, SIAM Journal of Algebraic Discrete
Methods 8(1): 77–84. http://dx.doi.org/10.1137/0608005
Dyson, R. 2000. Strategy, performance and operational research, Journal of the Operational Research
Society 51(1): 5–11. http://dx.doi.org/10.1057/palgrave.jors.2600916
Eden, C. 2004. Analyzing cognitive maps to help structure issues or problems, European Journal of
Op-erational Research 159(3): 673–686. http://dx.doi.org/10.1016/S0377-2217(03)00431-4
Eden, C.; Ackermann, F. 2001a. Group decision and negotiation in strategy making, Group Decision and
Negotiation 10(2): 119–140. http://dx.doi.org/10.1023/A:1008710816126
Eden, C.; Ackermann, F. 2001b. SODA – the principles, in J. Rosenhead, J. Mingers (Eds.). Rational analysis
for a problematic world revisited: problem structuring methods for complexity, uncertainty and conflict.
2nd ed. Chichester: John Wiley & Sons, 21–41.
Eden, C.; Ackermann, F. 2004. Cognitive mapping expert views for policy analysis in the public sector,
Euro-pean Journal of Operational Research 152(3): 615–630. http://dx.doi.org/10.1016/S0377-2217(03)00061-4
Ehigie, B. 2006. Correlates of customer loyalty to their bank: a case study in Nigeria, International Journal
of Bank Marketing 24(7): 494–508. http://dx.doi.org/10.1108/02652320610712102
Farahani, R. 2012. Covering problems in facility location: a review, Computers & Industrial Engineering
62(1): 369–407. http://dx.doi.org/10.1016/j.cie.2011.08.020
Farquhar, J.; Panther, T. 2008. Acquiring and retaining customers in UK banks: an exploratory study, Journal
of Retailing and Consumer Services 15(1): 9–21. http://dx.doi.org/10.1016/j.jretconser.2007.02.001
Ferreira, F.; Santos, S.; Rodrigues, P. 2011. Adding value to bank branch performance evaluation using cognitive maps and MCDA: a case study, Journal of the Operational Research Society 62(7): 1320–1333.
Ferreira, F.; Spahr, R.; Santos, S.; Rodrigues, P. 2012. A multiple criteria framework to evaluate bank branch potential attractiveness, International Journal of Strategic Property Management 16(3): 254–276.
http://dx.doi.org/10.3846/1648715X.2012.707629
Garland, R.; Gendall, P. 2004. Testing Dick and Basu’s customer loyalty model, Australasian Marketing
Journal 12(3): 81–87. http://dx.doi.org/10.1016/S1441-3582(04)70108-1
Hartman, T.; Storbeck, J.; Byrnes, P. 2001. Allocative efficiency in branch banking, European Journal of
Operational Research 134(2): 232–242. http://dx.doi.org/10.1016/S0377-2217(00)00257-5
Hirtle, B. 2007. The impact of network size on bank branch performance, Journal of Banking & Finance
31(12): 3782–3805. http://dx.doi.org/10.1016/j.jbankfin.2007.01.020
Howick, S.; Ackermann, F. 2011. Mixing OR methods in practice: past, present and future directions,
European Journal of Operational Research 215(3): 503–511. http://dx.doi.org/10.1016/j.ejor.2011.03.013
Hsieh, N. 2004. An integrated data mining and behavioral scoring model for analyzing bank
custom-ers, Expert Systems with Applications 27(4): 623–633. http://dx.doi.org/10.1016/j.eswa.2004.06.007
Johnson, M.; Nader, G.; Fornell, C. 1996. Expectations, perceived performance, and customer satisfac-tion for a complex service: the case of bank loans, Journal of Economic Psychology 17(2): 163–182.
http://dx.doi.org/10.1016/0167-4870(96)00002-5
Junior, H. 2008. Multicriteria approach to data envelopment analysis, Pesquisa Operacional 28(2): 231–242. Keeney, R. 1992. Value-focused thinking: a path to creative decisionmaking. Harvard: University Press
Harvard.
Keeney, R. 1994. Creativity in decision making with value-focused thinking, MIT Sloan Management
Review 35(4): 33–41.
Kowalski, T.; Shachmurove, Y. 2011. The financial crisis: what is there to learn?, Global Finance Journal
22(3): 238–247. http://dx.doi.org/10.1016/j.gfj.2011.10.014
Lee, W.; Chang, C.; Liu, Y. 2010. Exploring customers’ store loyalty using the means-end chain approach,
Journal of Retailing and Consumer Services 17(5): 395–405.
http://dx.doi.org/10.1016/j.jretconser.2010.04.001
Manrai, L.; Manrai, A. 2007. A field study of customers’ switching behavior for bank services, Journal of
Retailing and Consumer Services 14(3): 208–215. http://dx.doi.org/10.1016/j.jretconser.2006.09.005
Martin, W.; Ponder, N.; Lueg, J. 2009. Price fairness perceptions and customer loyalty in a retail context,
Journal of Business Research 62(6): 588–593. http://dx.doi.org/10.1016/j.jbusres.2008.05.017
Mihelis, G.; Grigoroudis, E.; Siskos, Y.; Politis, Y.; Malandrakis, Y. 2001. Customer satisfaction measure-ment in the private bank sector, European Journal of Operational Research 130(2): 347–360.
http://dx.doi.org/10.1016/S0377-2217(00)00036-9
Minami, C.; Dawson, J. 2008. The CRM process in retail and service sector firms in Japan: loyalty develop-ment and financial return, Journal of Retailing and Consumer Services 15(5): 375–385.
http://dx.doi.org/10.1016/j.jretconser.2007.09.001
Pan, Y.; Sheng, S.; Xie, F. 2012. Antecedents of customer loyalty: an empirical synthesis and reexamina-tion, Journal of Retailing and Consumer Services 19(9): 150–158.
http://dx.doi.org/10.1016/j.jretconser.2011.11.004
Roy, B. 1985. Méthodologie multicritére d’aide à la decision. Paris: Economica.
Santos, S.; Belton, V.; Howick, S. 2002. Adding value to performance measurement by using systems dynamics and multicriteria analysis, International Journal of Operations & Production Management
22(11): 1246–1272. http://dx.doi.org/10.1108/01443570210450284
Santos, S.; Belton, V.; Howick, S. 2008. Enhanced performance measuring using OR: a case study, Journal
of the Operational Research Society 59(6): 762–775. http://dx.doi.org/10.1057/palgrave.jors.2602397
Serna, R. 2005. Where are the bank branches in my community? An analysis of branch distribution in
low-income neighborhoods. California Reinvestment Coalition Report [online], [cited 10 March 2013].
Smith, P.; Goddard, M. 2002. Performance management and operational research: a marriage made in heaven?, Journal of the Operational Research Society 53(3): 247–255.
http://dx.doi.org/10.1057/palgrave.jors.2601279
Tegarden, D.; Sheetz, S. 2003. Group cognitive mapping: a methodology and system for capturing and evaluating managerial and organizational cognition, Omega. 31(2): 113–125.
http://dx.doi.org/10.1016/S0305-0483(03)00018-5
Vesel, P.; Zabkar, V. 2009. Managing customer loyalty through the mediating role of satisfaction in the DIY retail loyalty program, Journal of Retailing and Consumer Services 16(5): 396–406.
http://dx.doi.org/10.1016/j.jretconser.2009.05.002
Wu, H. 2012. Constructing a strategy map for banking institutions with key performance indicators of the balanced scorecard, Evaluation and Program Planning 35(3): 303–320.
http://dx.doi.org/10.1016/j.evalprogplan.2011.11.009.
Yoo, M.; Bai, B. 2013. Customer loyalty marketing research: a comparative approach between hospitality and business journals, International Journal of Hospitality Management 33(3): 166–177.
http://dx.doi.org/10.1016/j.ijhm.2012.07.009
Yoon, C. 2010. Antecedents of customer satisfaction with online banking in China: the effects of
experi-ence, Computers in Human Behavior 26(6): 1296–1304. http://dx.doi.org/10.1016/j.chb.2010.04.001
Yoon, Y.; Lee, J.; Lee, C. 2010. Measuring festival quality and value affecting visitors’ satisfaction and loyalty using a structural approach, International Journal of Hospitality Management 29(2): 335–342.
http://dx.doi.org/10.1016/j.ijhm.2009.10.002
Fernando A. F. FERREIRA is an Assistant Professor at the ISCTE Business School of the University In-stitute of Lisbon, and an Adjunct Research Professor at the Fogelman College of Business and Economics of the University of Memphis, TN, USA. He holds a PhD in Quantitative Methods Applied to Economics and Management from the University of Algarve, Portugal. Some of his articles are published by ISI-listed journals such as Journal of the Operational Research Society, Management Decision, International Entre-preneurship and Management Journal, and International Journal of Strategic Property Management. He has practical experience as group facilitator and his research interests include multiple criteria decision analysis, fuzzy logics and integrated systems for performance measurement.
Marjan S. JALALI is an Assistant Professor at the ISCTE Business School of the University Institute of Lisbon, and researcher at the Business Research Center (BRU-IUL), Portugal. She holds a PhD in Manage-ment from the University of Sydney, Australia. She is editorial board member of the Global Business and Economics Review, managing editor of the International Journal of Management Science and Information Technology, and some of her works have been published nationally and internationally. Her research interests include multiple criteria decision analysis, strategic decision making and consumer behavior. Ieva MEIDUTĖ-KAVALIAUSKIENĖ is an Associate Professor and Vice-Dean at the Faculty of Business Management of the Vilnius Gediminas Technical University, Lithuania. She holds a PhD in Technological Science from the Vilnius Gediminas Technical University. She has authored peer-reviewed papers and some of her works have been presented and published nationally and internationally. She is editorial board member of several international journals and her research interests include logistics and opera-tions management.
Bianca A. C. P. VIANA is a bank analyst who works at Caixa Geral de Depósitos (one of the top-five banks in Portugal). Her research interests include marketing, decision making and consumer behavior. Some of her works have been presented in national and international conferences.