16
Organizational Learning in the Hotel Industry: an eclectic instrument of measurement
Aprendizagem Organizacional na Indústria da Hotelaria: um instrumento de medida ecléctico do Porto, PortugalAdriana L. Fernandes
Instituto Universitário de Lisboa (ISCTE-IUL), ISTAR-IUL, Lisboa, Portugal, [email protected]
Raul M. S. Laureano
Instituto Universitário de Lisboa (ISCTE-IUL), BRU-IUL, Lisboa, Portugal, [email protected]
Bráulio Alturas
Instituto Universitário de Lisboa (ISCTE-IUL), ISTAR-IUL, Lisboa, Portugal, [email protected]
Abstract
Organizational Learning, despite being a widely debated topic in the literature on management, regarding the hotel industry still suffers from scattered information. This study was conducted with 295 professionals, among them managers and employees of hotels in Brazil and Portugal in order to validate a measuring instrument of organizational learning, properly adapted for hotel industry, and identify differences in the degree of efficiency of the organizational learning process between hotels of different categories, and between managers and employees. Initially a content validation with representatives of the hotel industry was made, then a confirmatory factor analysis was performed. As a result, we obtained a scale with 4 factors and 12 items, which was able to identify differences in the level of organizational learning between hotels and between managers and employees. There is evidence that the ability of individuals and groups to learn is encouraged, but is not being achieved in full in this industry, and that the most critical part of the process involves the dimension of creation and knowledge management in this industry.
Keywords: Organizational Learning, hotel industry, confirmatory factor
analysis, scale.
Resumo
A aprendizagem organizacional, apesar de ser um tema amplamente discutido na literatura sobre gerenciamento, a informação em torno do mesmo é ainda dispersa em relação a indústria da hotelaria. Este estudo foi realizado com 295 profissionais, dentre eles gerentes e funcionários de hotéis no Brasil e em Portugal, para validar um instrumento de medição da aprendizagem organizacional adequadamente adaptado para a indústria da hotelara e identificar diferenças no grau de eficiência do processo de aprendizagem organizacional entre hotéis de diferentes categorias, e entre gerentes e funcionários. Inicialmente, foi realizada uma validação de conteúdo com representantes da indústria da hotelaria e, posteriormente, uma análise fatorial confirmatória. Como resultado, obtivemos uma escala com 4 fatores e 12 itens, que foi capaz de identificar diferenças no grau de eficiência do processo de aprendizagem organizacional entre profissionais de diferentes hotéis e entre gestores e colaboradores. Há evidências de que a capacidade dos indivíduos e grupos para aprender é encorajada nos hotéis pesquisados, entretanto a aprendizagem organizacional não está sendo alcançada na íntegra neste setor, sendo a parte mais crítica do processo a dimensão de criação e gerenciamento de conhecimento neste setor.
Palavras-chave: Aprendizagem Organizacional, indústria da hotelaria,
análise fatorial confirmatória, escala.
1. Introduction
The hotel industry has experienced major changes in recent years. Factors such as the demand for quality and differentiation of services by customers, changes in buying behaviour and how customers perceive the change in prices, the rise of accommodation booking websites and online travel agencies, market uncertainty, and dynamic pricing have become a challenge for the managers of these organizations (Rana & Oliveira, 2014; Viglia, Mauri, & Carricano, 2016). In addition, the ability to acquire internal and external knowledge and to develop more flexible enterprise systems have become essential to effectively meet the expectations of stakeholders and environmental changes (Fraj, Matute & Melero, 2015). Learning has become a key word in organizations because this is essential for an organization to adapt efficiently to the environmental changing conditions and generate long-term value over competitors (Boer, 2015).
Organizational Learning (OL) has grown in importance in literature (Sanz-Valle, Naranjo-Valencia, Jiménez-Jiménez, &
Perez-Caballero, 2011; Dodgson, Gann, & Phillips, 2013; Lloria & Moreno-Luzon, 2014), leading to debates on the definition of the term and the methods used in its research. In the hospitality industry, or more specifically, the hotel industry, information about the subject is still dispersed (Ghaderi, Mat Som, & Wang, 2014; Alonso-Almeida, Celemín-Pedroche, Rubio-Andrada, & Rodríguez-Antón, 2016). The few empirical papers that address OL in the hotel industry discuss the relationships between organizational variables. To this end, selected scales of previous research are used (Nasution, Mavondo, Matanda, & Ndubisi, 2011; Martin-Rojas, Garcia-Morales, & Mihi-Ramirez, 2014), which have not been developed or validated for this industry or scales that addressed only a single theoretical model among the many pre-existing (Tajeddini, 2011; Fraj et al., 2015).
The only article identified that had a measuring instrument designed for a specific study in the hotel industry (Alonso-Almeida et al., 2016) did not aim to present a way to measure OL, but the factors that can favour and affect it. Thus, the study does not work with the learning process itself, neither have the
17
variables nor the dimensions that make up the process of OL. It also does not expose the results of scale validation procedures (convergent and discriminant validity), which does not guarantee the reliability of the scale.Thereby, a study to present an eclectic instrument was not identified in the literature, in the sense to encompass different theoretical models validated to measure the degree of OL process efficiency in the hotel industry companies and also to capture the vision of employees and managers of this industry. Thus, the main objective of this study is to validate a measuring instrument of OL, which deals with the process itself and reflects the vision of managers and employees, properly adapted to the specificities of the sector. In addition, it is intended to identify differences in the degree of efficiency of the OL process between hotels of different characteristic (size and category) and also between managers and employees in order to provide information if these characteristics influence the process of OL.
The instrument to be validated is based on the study of Lloria and Moreno-Luzon (2014). The choice is due to the theoretical range of the measurement tool developed by them, which incorporated the results of studies; among others, Nonaka (1994), Bontis, Crossan and Hulland (2002), Templeton, Lewis and Snyder (2002), and Tippins and Sohi (2003), as well as the complexity of the phenomenon that this measure is able to capture. The authors considered the instrument useful for effectively designing the organizational change initiatives. From now on, the validated tool can assist managers of the hotel industry to understand the dimensions that involve the process of OL, from knowledge creation to distribution by the organization, and identify dimensions that need special attention in order to improve them. Additionally, previous studies only addressed the vision of senior managers (Tajeddini, 2011; Fraj et al., 2015; Alonso-Almeida et al., 2016), which is considered a limitation because, although these executives are considered as reliable sources information, their opinions may not necessarily be completely objective (Alonso-Almeida et al., 2016). Studies that show the view of the front office employees, responsible for delivering the main product of this industry, are needed to see how OL actually occurs in this context.
2. Organizational Learning and its measurement
The ability to learn from organizations is critical to improving the performance and its long-term success (Dodgson et al., 2013). At the hotel industry learning is considered a turning point in the ability to reduce inefficiencies and adapt to changes (Ghaderi et al., 2014; Fraj et al., 2015) because hotels are one of the most dynamic environments business, where uncertainty and competition between companies in the sector is intense (Kokt & Ramarumo, 2015). The Internet is one of the factors that has redefined the way of doing business in this industry, due to the increase in user-generated content in social networking and websites about hotels’ reputations, changing consumer behaviour and leading hotels to differentiate not only
in their physical environment, but also in the services offered to the market (Fotis, Buhalis, & Rossides, 2011).
Since the 70s, studies highlight the importance of OL as a survival condition for enterprises on an unstable environment by stimulating continuous change, the renewing and quick responses to the challenges that arise (Sanz-Valle et al., 2011; Lloria & Moreno-Luzon, 2014). The concept of OL is widespread in both academic research and business. The different dimensions, from which OL has been studied and analysed, led discussions on the definition of the term. Several reviews of the literature (Huber, 1991; Templeton, Morris, Snyder, & Lewis, 2004), and even attempts to create a general theory (Crossan, Lane, & White, 1999), contributed to the consolidation and progress on the field, especially at the theoretical level. However, a coexistence of multiple forms of OL can still be observed, such as, "learning organizations”, which deals with organizational values needed to be learned (Senge, 1990), and "learning culture", which deals with the diagnostic of learning behaviour (Yang, 2003). As mentioned, this study refers to the perspective that defines OL as a process (Huber, 1991; Templeton et al., 2002), composed of sub-processes by which new knowledge or ideas are developed by a company (Lloria & Moreno-Luzon, 2014). On this point of view, the concepts of learning, knowledge and information relate to each other in such a way that the information serves as a significant entry that generates the learning processes and provides the basis for the acquisition of knowledge (Moreno-Luzón & Lloria, 2008). A review of the literature on OL reveals that some studies have proposed measurement instruments of the organizational learning process and that each of these studies was restricted to a single theoretical model, such as Templeton et al. (2002). In order to overcome these difficulties, Lloria and Moreno-Luzon (2014) developed an eclectic operational measurement tool which reflects the theoretical scope and practice that involves the concept of OL, due to the incorporation of perspectives of different models and typologies created by different authors, which offered relevant sources to determine the items that would be included in the scale and dimensions. Among the studies considered in the development of this scale,the model developed by March (1991)can be highlighted, which develops a typology of OL, distinguishing two types of learning. On one hand, exploitation - which refers to the refinement, implementation and efficiency of a pre-existing knowledge - where the focus would be on the increase of the competence on what is already known. On the other hand, the exploration in which the focus is on the use of new knowledge in order to work with risk, flexibility, variability and experimentation.
Lloria and Moreno-Luzon (2014) also analysed and incorporated in their study the model proposed by Nonaka (1994), which distinguishes between two types of knowledge: explicit and tacit. Explicit knowledge, or encoded, refers to the transmitted knowledge in formal, systematic language. The tacit knowledge
18
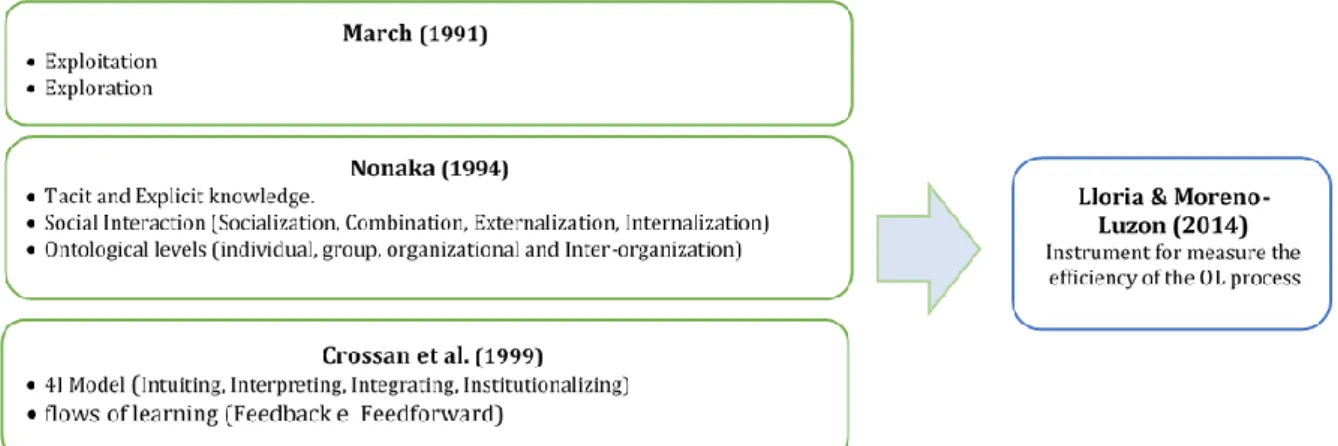
has a personal quality, making it more difficult to be formalized and communicated. To the author, knowledge comes through the conversion of tacit knowledge into explicit one. It also presents the epistemological and ontological levels of OL. As for the epistemological nature, the process of knowledge creation goes through four stages of social interaction, where knowledge is converted from tacit to explicit and again from explicit to tacit: the socialization, the combination, the internalization and the externalization. Thus, the conversion of knowledge must be managed in order to create a link between the different ontological levels (individual, group, organizational and inter-organizational), making it a cyclical process called "the spiral of knowledge creation." In fact, given that the organization itself does not create knowledge, it is the individual knowledge that should be mobilized through social interaction processes to reach the organizational level. Finally, the model proposed by Crossan et al. (1999)was considered, which understands OL as a dynamic process, the primary means source for strategic renewal of a company. Theyproposed the 4I Model, composed of four sub-processes, namely, the intuition, interpretation, integration and institutionalization, related and imputed by each other through procedures of feedback and feed-forward. The authors acknowledge that the flow of information necessary for OL occurs, happens in previously multiple ontological levels proposed by Nonaka (1994), with the exception of inter-organizational level.
These contributions to the model of Lloria and Moreno-Luzon (2014) are summarized in Figure 1. This model gives rise to a questionnaire in order to measure the efficiency of the OL process, administered to managers of 167 large Spanish companies. The questions were operationalized in statements which asked each respondent for their degree of agreement, measured on a Likert scale of seven points, going from (1) "strongly disagree" to (7) "I totally agree". The 18 statements were all drafted in a positive way (e.g. "The people in our company try to understand the way their colleagues and workmates think and act").
Figure 1 - Models and typologies incorporated in the scale of OL by Lloria and Moreno-Luzon (2014)
Source: Authors’ formulation based on the Lloria and Moreno-Luzon (2014). After evaluating the psychometric properties and validity of the
scale, the authors present a measuring instrument with a four-factor structure (Lloria & Moreno-Luzon, 2014):
Factor 1, which represents the Information Systems dimension, with 3 items associated with the treatment of explicit knowledge through formal information systems, such as files and database;
Factor 2, which represents the existence of a Framework for consensus dimension, with 4 items related to the convergence of objectives and values, the existence of a common language and favourable conditions for dialogue; Factor 3, which represents the Institutionalization and
broadening of knowledge dimension, with 5 items related to documentation procedures, incorporation and storage of knowledge as well as possible alliances and agreements on their development with other companies or universities; Factor 4, which represents the Management and genesis of
knowledge dimension, with 6 items, showing the ability of
individuals and groups to learn and the motivation that management of people provides for learning.
The factor loadings of the solution of the proposed model were above 0.60, considered minimally acceptable for instruments under development (Hair, Black, Babin, & Anderson, 2010), with the exception of item V15, which has some value over 0.4. Regarding the characteristics of hotels, Alonso-Almeida et al. (2016) indicate that the size, measured in number of housing units, and the category (3, 4 or 5 star) of the hotels are factors that affect the ability to learn. According to the authors, large hotels, with more than 250 housing units, have greater ability to learn to be better equipped and adopt more advanced management practices than their smaller counterparts. About the category, the authors indicate that the higher the category, the more customers demand and therefore greater propensity to support OL. They also propose that all hotels are able to learn but the intensity of learning will depend on the characteristics of these hotels.
19
3. Methodology
The achievement of the objectives required the definition of four phases, three related to the validation of the OL scale in the hotel industry and the last part describes the differences in the process of OL in different population groups.
3.1 Development version for validation
In the first phase of the study, special attention was given to the translation of the original version of this scale into Portuguese to capture their linguistic nuances, following methodological procedures previously used by several authors (Beaton, Bombardier, Guillemin, & Ferraz, 2000). Subsequently, the scale was adapted to the hotel industry context taking the first version of OL scale in Portuguese to this industry.
This version of the scale underwent a content validation as regards hotel industry. It was analysed by a director of a Portuguese hotel group, by a hospitality consultant in Brazil, by a manager of the Associação Brasileira da Indústria de Hotéis (ABIH) and a manager of the Associação da Hotelaria, Restauração e Similares de Portugal (AHRESP). The aim was to ensure that the scale items were relevant and general to all hotel industry, thus the second version of the OL scale was obtained. Once the content’s validation was concluded, all necessary steps were taken to create a pilot study with employees from 10 hotels, in order to assess the language and the instrument’s content. It was asked to respondents to mark items that were not understandable and that did not fit to the function developed at the hotel. Three items were identified as possible situations that did not fit the context, were not part of the routine of employees (V7, V11, V14, V15 – see Table 2). However, at this stage it was decided to not delete these items and wait for the next phase results.
The final item pool was, therefore, used to validate the survey’s instrument that also consisted of 18 items distributed in the four dimensions designed in the original scale by Lloria and
Moreno-Luzon (2014). The associated questionnaire was also operationalized by statements in which respondents rated their agreement in a seven points Likert scale, ranging from (1) "strongly disagree" to (7) "strongly agree".
3.2 Sample and data collection
Regarding the sample selection criteria, the study considered hotels with 3 stars or more, according to the Brazilian (Portaria no100, de 16 de Junho 2011 do Ministério do Turismo, 2011) and Portuguese (Portaria n.o 309/2015 de 25 de setembro do Ministérios da Economia e do Ambiente, Ordenamento do Território e Energia, 2015) classification. The reason for this choice was the fact that superior hotels are best suited to test the proposed instrument, since they are more professional and compete based on knowledge and innovation (Nieves & Segarra, 2015). The Top 10 hotel groups from the Atlas da Hotelaria 2014 of Deloitte Consultores S.A. (Deloitte, 2015) was selected as the sample. The main managers of hotel groups were contacted by telephone and later an email was sent with a request for authorization for the study and the questionnaire. The questionnaires were administered to 900 employees and managers, but only 354 were filled in. Of these, 59 questionnaires were excluded from the sample for inadequacy or incomplete filling. Thus the effective sample size was of 295 participants, which satisfied the minimum requirement of power by at least 5 to 10 times the amount indicated in the confirmatory factory analysis (CFA) model (Heritage, Pollock, & Roberts, 2014).
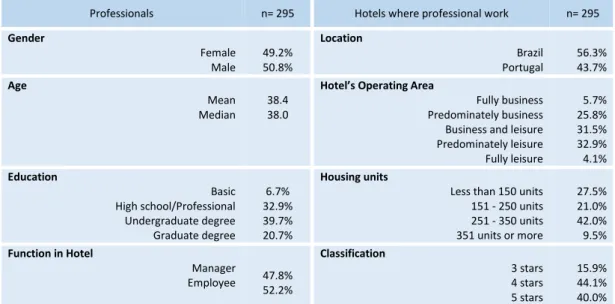
The demographic characteristics of the sample can be seen in Table 1. The sample is mainly composed of employees (52.2%), of the male gender (50.8%), with an average age of 38.40 years and with a university degree (60.4%). Regarding the characteristics of the hotels studied, the sample is mainly formed by hotels that operate predominantly in leisure activities (37%), have 4 stars or more (84.1%) and have more than 251 housing units (51.5%).
Table 1 - Demographic characteristics of the sample
Professionals n= 295 Hotels where professional work n= 295
Gender Female Male 49.2% 50.8% Location Brazil Portugal 56.3% 43.7% Age Mean Median 38.4 38.0
Hotel’s Operating Area
Fully business Predominately business Business and leisure Predominately leisure Fully leisure 5.7% 25.8% 31.5% 32.9% 4.1% Education Basic High school/Professional Undergraduate degree Graduate degree 6.7% 32.9% 39.7% 20.7% Housing units
Less than 150 units 151 - 250 units 251 - 350 units 351 units or more 27.5% 21.0% 42.0% 9.5% Function in Hotel Manager Employee 47.8% 52.2% Classification 3 stars 4 stars 5 stars 15.9% 44.1% 40.0%
20
3.3 Confirmatory Factor Analysis
Seeking not only to confirm the factor’s structure of OL for the hotel industry, but also to show evidence of the construct’s validity, a CFA was conducted (Heritage et al., 2014), this analysis provided an appropriate parameter that allowed comparisons between different models. The analysis was performed by AMOS (v23) software.
Three models were examined. Model 1 tested the structure proposed by Lloria and Moreno-Luzon (2014), a first order model with four factors and 18 items. Model 2 is also a first order model, where 6 items with poor fit in the initial model, which includes four items considered out of context by the participants of the pre-test, were removed. Finally, a model of a single factor representing the OL was tested. The model’s fit was made from the modification indexes (greater than 11; p <0.001) and based on theoretical considerations.
Due to the fact that there is no other accepted universal index besides chi-square test to evaluate the goodness of fit of each model, the following measures of model-data fit, with the minimum recommended values in parentheses, were used: χ2 / df (p> 0.05), Comparative Fit Index (CFI> 0.90), Goodness of Fit Index (GFI> 0.90), Root Mean Square Error of Approximation (RMSEA <= 0.05 or <0.08 acceptable), Modified Expected Cross-Validation Index (MECVI the lower the better), Standard Resting Metabolic Rate (StdRMR <0.05) and Resting Metabolic Rate (RMR <0.05) (Byrne, 2010).
Upon having demonstrated the suitability of the factor’s structure proposed by the sample under study, it is necessary
to evaluate the composite reliability (CR), which according to Fornell and Larcker (1981) is a measure that estimates the internal consistency of the reflective factor items, indicating the extent to which these items are consistent manifestations of the latent factor (CF>= 0.7). The scale’s construct validity was also verified through the convergent and discriminant validity. Convergence was evaluated through the average variance extracted measure (AVE), which reflects the amount of variance captured through the latent construct. It is considered satisfactory when above the minimum recommended value of 0.50 (Fornell & Larcker, 1981). Discriminant validity is verified when the square root of AVE for each construct is greater than the standardised correlation of that construct with all other constructs (Anderson & Gerbing, 1988).
3.4 Organizational Learning differences between population segments
T teste and F test (Oneway ANOVA) were performed to examine differences between the groups to evaluate the differences in the efficiency of the OL process. Significance was tested at the 0.05 level. The independent variables were function in the hotel, classification of the hotel and size. The dependent variables were the participants self-reported mean scores on each factor of the scale.
4. Results
4.1 Scale Validation (CFA)
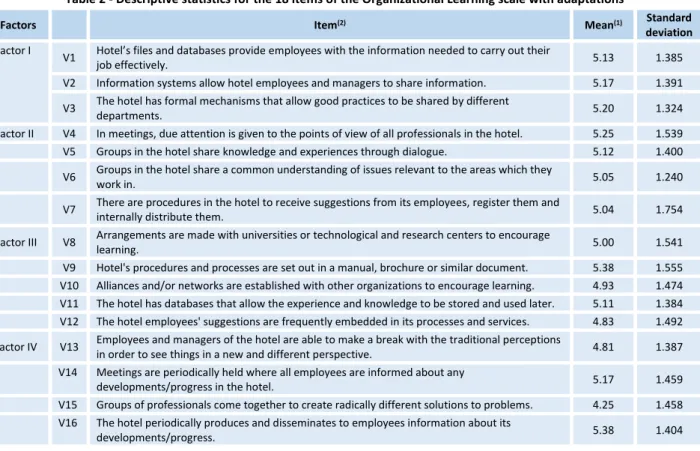
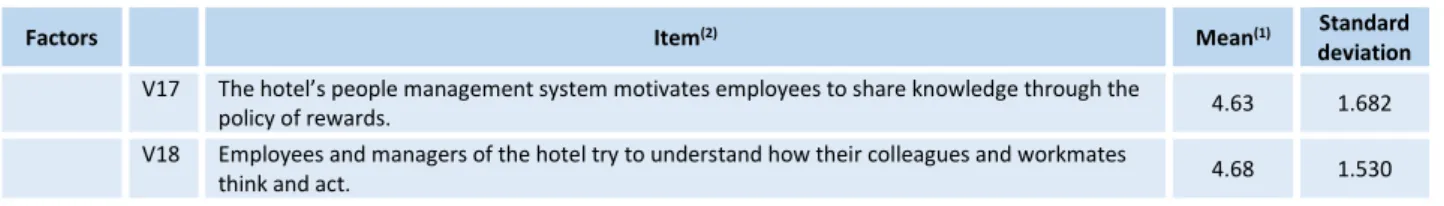
Table 2 presents the means and standard deviations of the 18 items proposed to measure the OL.
Table 2 - Descriptive statistics for the 18 items of the Organizational Learning scale with adaptations
Factors Item(2) Mean(1) Standard
deviation
Factor I
V1 Hotel’s files and databases provide employees with the information needed to carry out their
job effectively. 5.13 1.385
V2 Information systems allow hotel employees and managers to share information. 5.17 1.391
V3 The hotel has formal mechanisms that allow good practices to be shared by different
departments. 5.20 1.324
Factor II V4 In meetings, due attention is given to the points of view of all professionals in the hotel. 5.25 1.539
V5 Groups in the hotel share knowledge and experiences through dialogue. 5.12 1.400
V6 Groups in the hotel share a common understanding of issues relevant to the areas which they
work in. 5.05 1.240
V7 There are procedures in the hotel to receive suggestions from its employees, register them and
internally distribute them. 5.04 1.754
Factor III V8 Arrangements are made with universities or technological and research centers to encourage
learning. 5.00 1.541
V9 Hotel's procedures and processes are set out in a manual, brochure or similar document. 5.38 1.555
V10 Alliances and/or networks are established with other organizations to encourage learning. 4.93 1.474
V11 The hotel has databases that allow the experience and knowledge to be stored and used later. 5.11 1.384
V12 The hotel employees' suggestions are frequently embedded in its processes and services. 4.83 1.492
Factor IV V13 Employees and managers of the hotel are able to make a break with the traditional perceptions
in order to see things in a new and different perspective. 4.81 1.387
V14 Meetings are periodically held where all employees are informed about any
developments/progress in the hotel. 5.17 1.459
V15 Groups of professionals come together to create radically different solutions to problems. 4.25 1.458
V16 The hotel periodically produces and disseminates to employees information about its
21
Factors Item(2) Mean(1) Standard
deviation
V17 The hotel’s people management system motivates employees to share knowledge through the
policy of rewards. 4.63 1.682
V18 Employees and managers of the hotel try to understand how their colleagues and workmates
think and act. 4.68 1.530
Note: (1) Sacle (1) "strongly disagree" to (7) "strongly agree"; n=295. / (2) To access the items in Portuguese contact 1st author.
As noted, Model 1 tested the structure originally proposed by Lloria and Moreno-Luzon (2014), adapted to the hotel industry. To assess the individual reliability of the items through the weights of the factor’s loads, it was found that all the items saturated in their respective factors with a magnitude greater than 0.50 (p <0.001). However, the RMSEA and SRMR indexes presented unacceptable results and, GFI and CFI indexes fit the data poorly. The modification indexes suggested the withdrawal of the items V7, V11, V12, V14, V15 and V16 for saturating in different factors from those suggested in the original version. Model 2 tested a proposed structure with the adjustments suggested by the modification indexes. When assessing the individual reliability of the items through the weights of the factor’s loads, it was found again that all the items saturated in their respective factors with a magnitude greater than 0.50 (p <0.001). Items V7, V11, V12, V14, V15 and V16 were removed by saturating different factors from those suggested in the original version. It is important to note that the items V7, V11, V14 and V15 were indicated by respondents as not applicable to the hotel sector during the pilot test and that item 15 had a low reliability factor in the original scale.
After this, measurement errors of items V1 and V2 of factor I, V5 and V6 of factor II, and 13 and 17 of factor IV were correlated, suggested by the modification indexes, and the revised model was re-evaluated. A good adjustment was obtained, with visible improvements when compared to the original model. The SRMR, RMSEA and MECVI showed decreasing values compared to the original model and GFI and CFI showed higher values, demonstrating a better fit of the model.
In Model 3, the structure of a single factor OL was tested, with 18 items. On evaluating the reliability of individual items, it was found that all items presented adequate factor loadings. After correlated measurement errors of the items V4, V5, V7, V8, V10, V12, V14 and V16, the obtained adjustment for RMSEA was still considered poor.
Model 2, simplified with 12 items showed lower MECVI indicating that this model has better validity for data. Furthermore, the new value of RMSEA, combined with the values of SRMR, GFI and CFI, ensure better fit to the indexes. The Table 3 shows the fit indexes produced by CFA for the three competing models.
Table 3 - Adjustment index for the three models tested according to confirmatory factor analysis.
Model χ2 Df χ2/df GFI CFI RMSEA SRMR MECVI
Model 1 624.046 129 8.838 0.804 0.870 0.114 0.046 2.428
Model 2 130.167 45 2.893 0.932 0.965 0.080 0.037 0.678
Model 3 349.340 129 2.708 0.812 0.911 0.103 0.048 2.761
Upon having demonstrated the suitability of the factor’s structure of Model 2, the composite reliability (CR) was evaluated. The CR of factors proved to be adequate. The values are 0.859 for factor I, 0.915 for factor II, 0.842 for factor III and 0.864 for factor IV. The scale’s construct validity was also verified to check if it actually measured or operationalized the
assessed construct. Table 4 shows that there is a convergent and discriminant validity for all the factors, given AVE proved to be suitable for all factors (factor I = 0.670, factor II= 0.843, factor III= 0.572 and factor IV = 0.517) and the MSV and ASV of the analysed factors are smaller than the AVE of each factor.
Table 4 - Reliability properties and convergent and discriminant validity.
CR AVE MSV ASV Factor I Factor II Factor III Factor IV
Factor I 0.859 0.670 0.615 0.592 0.819
Factor II 0.922 0.798 0.619 0.564 0.784 0.893
Factor III 0.804 0.578 0.573 0.527 0.743 0.676 0.760
Factor IV 0.844 0.644 0.619 0.601 0.781 0.787 0.757 0.803
Note: Satisfactory indications by Fornell and Larcker (1981) and Anderson and Gerbing (1988): CR > 0,7; AVE > 0,5; CR > AVE; MSV < AVE e ASV < AVE.
4.2 Organizational Learning differences between groups Given the second objective, to compare means of the dimensions that make up OL in different population groups, the function performed in the hotel, and characteristics related to
the category and size of hotels were selected, because they were considered relevant in previous studies (Alonso-Almeida et al., 2016). The results show that that managers and employees have a reasonable level of OL (mean values between
22
4 and 5). However, differences in four dimensions are significant (p <0.05), because the managers show a higher mean level, meaning that the level of OL is better for managers than for employees. It also highlights the Management and genesisof knowledge dimension, where the mean level is lower, meaning that the ability of individuals and groups to learn is not achieved in full in this industry (Table 5).
Table 5 - Comparison between mean scores of OL according to the function in hotel.
OL dimensions Function N Mean Standard
deviation t test
Information Systems Manager 141 5.03 0.89 t (287.666) = 3.682; p = 0.000
Employee 154 4.61 1.11
Framework for consensus Manager 141 5.21 0.88 t (275.800) = 4.208; p = 0.000
Employee 154 4.69 1.24
Institutionalization and broadening of knowledge
Manager 141 5.15 1.13
t (293) = 3.340; p = 0.001
Employee 154 4.69 1.21
Management and genesis of knowledge Manager 141 4.35 0.85 t (285.469) = 4.376; p = 0.000
Employee 154 3.85 1.09
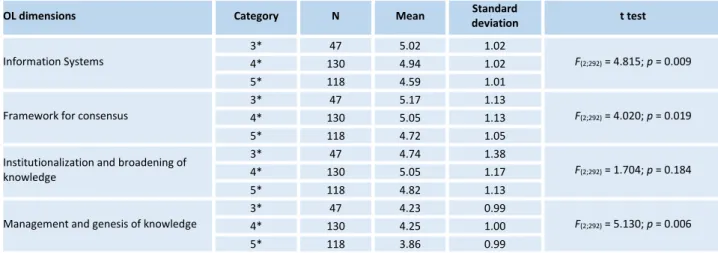
Regarding the category of hotels (3, 4 or 5 stars), it is known that the professionals of 3 star hotels have higher mean than the other professionals in three of the four dimensions, with the exception of Institutionalization and broadening of knowledge dimension (Table 6). The other dimensions present statistically
significant differences (p <0.05). It is noteworthy that the Management and genesis of knowledge dimension, professionals of all categories of hotels have lower values than in other dimensions. Warning of difficulties in this stage of the OL process.
Table 6 - Comparison between mean scores of OL according to the hotel’s category
OL dimensions Category N Mean Standard
deviation t test Information Systems 3* 47 5.02 1.02 F(2;292) = 4.815; p = 0.009 4* 130 4.94 1.02 5* 118 4.59 1.01
Framework for consensus
3* 47 5.17 1.13
F(2;292) = 4.020; p = 0.019
4* 130 5.05 1.13
5* 118 4.72 1.05
Institutionalization and broadening of knowledge
3* 47 4.74 1.38
F(2;292) = 1.704; p = 0.184
4* 130 5.05 1.17
5* 118 4.82 1.13
Management and genesis of knowledge
3* 47 4.23 0.99
F(2;292) = 5.130; p = 0.006
4* 130 4.25 1.00
5* 118 3.86 0.99
Finally, we assessed whether the hotel size, measured in housing units, influences OL. Professionals of smaller hotels (up to 250 uh) appear to have a higher average than those of larger ones (more than 251 uh). These differences are statistically significant for all dimensions (p <0.05). Regarding the means
values of OL, approximately the value of 5, except for Creation and Knowledge Management dimension, where the mean level is again lower, meaning that this dimension needs greater attention from the managers of this industry (Table 7).
Table 7 - Comparison between mean scores of OL according to the hotel`s size.
OL dimensions Size N Mean Standard
deviation t test
Information Systems
Less than 150 units. 81 5.05 0.97
F(3;291) = 7.311; p-value = 0.000
151 - 250 units. 62 5.12 0.83
251 - 350 units. 120 4.50 1.08
351 units or more 32 4.81 1.06
Framework for consensus
Less than 150 units. 81 5.13 1.05
F(3;291) = 7.381; p-value = 0.000
151 - 250 units. 62 5.36 0.85
251 - 350 units. 120 4.64 1.24
23
OL dimensions Size N Mean Standard
deviation t test
Institutionalization and broadening of knowledge
Less than 150 units. 81 4.86 1.33
F(3;291) = 3.178; p-value = 0.024
151 - 250 units. 62 5.29 1.06
251 - 350 units. 120 4.73 1.16
351 units or more 32 5.00 1.04
Management and genesis of knowledge
Less than 150 units. 81 4.25 0.95
F(3;291) = 6.225; p-value = 0.000
151 - 250 units. 62 4.42 0.87
251 - 350 units. 120 3.82 1.07
351 units or more 32 4.12 0.91
4.3 Discussion
This study represents the first evaluation of OL measurement model in the context of the hotel industry in Brazil and Portugal. The results brought some disagreement regarding the original scale. The CFA has shown that the best model has four dimensions and 12 items, as follows: Information Systems, measured by items V1, V2 and V3; Framework for consensus, measured by items V4, V5 and V6; Institutionalization and broadening of knowledge measured by V8 items, V9 and V10; and Management and genesis of knowledge, measured by items V13, V17 and V18. Thus, the validated model contemplates six items less than the original model, eliminated by not fitting the context of hotel industry and saturating at different factors from those suggested in the original version. In addition to this, the original scale was validated in a sample composed only of managers of large Spanish companies. In this study, the scale was performed with managers and employees, bringing to this area a different perspective in terms of different organizational actors. This allowed a more comprehensive view of OL process.
Regarding the differences in levels of efficiency of the OL process between hotel professionals of different size and categories, and also between managers and employees, the results clearly show that there are significant differences in OL. The process is more efficient for managers than for employees. The way the information reaches the professionals and how they transform it into knowledge, and how this knowledge is institutionalized, it is more efficient for managers than employees. This difference may be related to two factors, the first being the fact that opinions of the managers may not necessarily be wholly objective, taking into account their knowledge as was pointed out by Alonso-Almeida et al. (2016), obtaining better results. The second is probably related to the characteristics of the industry, especially the high turnover of employees and limited development opportunities (Fraj et al., 2015). This might hinder the assimilation of information and the generation of knowledge on the part of employees.
If the second explanation is considered, the managers of this industry should be alert to the fact that hotels may be losing creative and intelligent contributions from front office employees, who know the routines and work directly with the
customer, and have more opportunities to perceive the tastes and needs of customers.
Regarding the category of the hotels, the three star hotels have a more efficient OL process than other classifications. It was also found that the size would affect the OL process and that the smaller the hotel, the greater the efficiency of the OL process. These two results are contrary to those found by the studies of Alonso-Almeida et al. (2016). Despite the larger hotels having greater availability of resources, which assists in the distribution of information, they can also be more bureaucratic and less flexible, which could hamper the process of developing new knowledge and changes. Thereby this case also explains the lower degree of efficiency in Management and genesis of knowledge dimension for the five-star hotels and hotels with more than 251 housing units.
The results show that the dimension that most needs to be re-thought is the Management and genesis of knowledge. The way the management motivates people to develop new knowledge requires reformulation. It means that new strategies are needed and rewards to encourage professionals to actively participate in the knowledge creation process in these organizations.
5. Conclusions and implications
The main contribution of this study for the hotel industry was the validation of an instrument to measure the level of efficiency of the OL process for this industry. An instrument that presents dimensions that make up the OL process is able to identify the weak dimensions related to the OL process and organizational characteristics that influence each of the dimensions shown. Based on the validated instrument, managers of hotels can understand the OL process, since the creation of knowledge to its institutionalization, and identify process dimensions that need to be improved, and devise strategies to improve them in order to generate organizational renewal.
Regarding the theoretical contributions, the presented instrument reflects the theoretical complexity of the concept, in the hotel industry, providing an operational measure able to capture different perspective in terms of organizational actors, which can be used in future studies to examine relationships
24
between the OL and other organizational dimensions such as organizational performance.Moreover, as noted in previous studies, there is evidence that OL is influenced by size and category of the hotels where the process occurs. However, contrary to what has been shown by previous studies, smaller hotels and lower categories were those that had better degrees of learning. This difference may be suggesting that the inclusion of employees in the sample changes the perception about the process, especially in large hotels where there is a greater distance between managers and employees, where the processes are more cast, and there is less flexibility, essential for the information flows and knowledge generation (Fraj et al., 2015). The study also indicates that for employees the process needs greater attention, especially in Management and genesis of knowledge. Hotels could be missing opportunities to learn from the experiences of employees who are at the front line, in direct contact with customers, and can better understand the demands of them. Although the scale has been tested with different organizational actors, results achieved do not point to a general conclusion. Ideally, an investigation of this nature should include other countries in order to provide a generalizable model. New tests and reviews are needed for refinement and validation of the structure proposed here, and if applicable, to create new items that can better capture the perspective of employees.
References
Alonso-Almeida, M. del M., Celemín-Pedroche, M. de la S., Rubio-Andrada, L., & Rodríguez-Antón, J. M. (2016). Human and other critical factors in organizational learning in the hotel industry: A contingency approach. Tourism & Management Studies, 12(1), 97–106. Doi: 10.18089/tms.2016.12110.
Anderson, J., & Gerbing, D. (1988). Structural Equation Modeling in Practice: A Review and Recommended Two-Step Approach.
Psychological Bulletin, 103(3), 411–423. Doi:
10.1037/0033-2909.103.3.411.
Beaton, D. E., Bombardier, C., Guillemin, F., & Ferraz, M. B. (2000). Guidelines for the process of cross-cultural adaptation of self-report measures. Spine, 25(24), 3186–3191. Doi:10.1097/00007632-200012150-00014.
Boer, A. V. den. (2015). Dynamic pricing and learning: Historical origins, current research, and new directions. Surveys in Operations Research
and Management Science, 20(1), 1–18. Doi:
10.1016/j.sorms.2015.03.001.
Bontis, N., Crossan, M. M., & Hulland, J. (2002). Managing an organizational learning systems by aligning stocks and flows. Journal of
Management Studies, 39(4), 437–469.
Doi:10.1111/1467-6486.t01-1-00299.
Byrne, B. M. (2010). Structural Equation Modeling with AMOS.
Structural Equation Modeling (Vol. 22). Doi:10.4324/9781410600219.
Crossan, M. M., Lane, H. W., & White, R. E. (1999). An organizational learning framework: From intuition to institution. Academy of
Management Review, 24(3), 522–537.
Deloitte. (2015). Atlas da hotelaria 2014. Lisboa: Delloite Consultores S.A.
Dodgson, M., Gann, D. M., & Phillips, N. (2013). Organizational Learning and the Technology of Foolishness: The Case of Virtual Worlds at IBM.
Organization Science, 1–19.
Doi:http://dx.doi.org/10.1287/orsc.1120.0807.
Fornell, C., & Larcker, D. F. (1981). Evaluating Structural Equation Models with Unobservable Variables and Measurement Error. Journal
of Marketing Research (JMR). Feb1981, 18(1), 39–50. 12p. 1 Diagram.
Fotis, J., Buhalis, D., & Rossides, N. (2011). Social Media Impact on Holiday Travel Planning: The Case of the Russian and the FSU Markets.
International Journal of Online Marketing, 1(4), 1–19.
Doi:10.4018/ijom.2011100101.
Fraj, E., Matute, J., & Melero, I. (2015). Environmental strategies and organizational competitiveness in the hotel industry: The role of learning and innovation as determinants of environmental success.
Tourism Management, 46, 30–42. Doi:
10.1016/j.tourman.2014.05.009.
Ghaderi, Z., Mat Som, A. P., & Wang, J. (2014). Organizational Learning in Tourism Crisis Management: An Experience from Malaysia. Journal of
Travel & Tourism Marketing, 31, 627–648.
Doi:10.1080/10548408.2014.883951.
Hair, J. F., Black, W. C., Babin, B. J. & Anderson, R. E. (2010). Multivariate
data analysis: A global perspective. (7th ed.). Upper Saddle River, NJ:
Pearson.
Heritage, B., Pollock, C., & Roberts, L. (2014). Validation of the organizational culture assessment instrument. PLoS ONE, 9(3), 1–10. Doi: 10.1371/journal.pone.0092879.
Huber, G. P. (1991). Organizational Learning: The Contributing Processes and the Literatures. Organization Science, 2(1), 88–115. Doi:10.1287/orsc.2.1.88.
Kokt, D., & Ramarumo, R. (2015). Impact of organisational culture on job stress and burnout in graded accommodation establishments in the Free State province, South Africa. International Journal of
Contemporary Hospitality Management, 27(6), 1198–1213.
Lloria, M. B., & Moreno-Luzon, M. D. (2014). Organizational learning: Proposal of an integrative scale and research instrument. Journal of
Business Research, 67(5), 692–697.
March, J. G. (1991). Exploration and Exploitation in Organizational Learning. Organization Science, 2(1), 71–87. Doi: 10.1287/orsc.2.1.71. Martin-Rojas, R., Garcia-Morales, V. J., & Mihi-Ramirez, A. (2014). Knowledge-based organization in tourism industry. Engineering
Economics, 25(1), 82–93. Doi:10.5755/j01.ee.25.1.2030.
Moreno-Luzón, M. D., & Lloria, M. B. (2008). The role of non-structural and informal mechanisms of integration and coordination as forces in knowledge creation. British Journal of Management, 19(3), 250–276. Doi:10.1111/j.1467-8551.2007.00544.
Nasution, H. N., Mavondo, F. T., Matanda, M. J., & Ndubisi, N. O. (2011). Entrepreneurship: Its relationship with market orientation and learning orientation and as antecedents to innovation and customer value.
Industrial Marketing Management, 40(3), 336–345. Doi:
10.1016/j.indmarman.2010.08.002.
Nieves, J., & Segarra, M. (2015). Management innovation in the hotel
industry. Tourism Management, 46(February), 51–58. Doi:
10.1016/j.tourman.2014.06.002.
Nonaka, I. (1994). A Dynamic Theory of Organizational Knowledge Creation. Organization Science, 5(1), 14–37. Doi:10.1287/orsc.5.1.14. Portaria n.o 309/2015 de 25 de setembro do Ministérios da Economia e do Ambiente, Ordenamento do Território e Energia. Pub. L. No. Diário da República: 1.a série, N.o 188 (2015). Portugal. Retrieved from www.dre.pt.
Portaria no100, de 16 de Junho, 2011 do Ministério do Turismo. Pub. L. No. Diário Oficial da União (2011). Brasil. Retrieved from http://www.turismo.gov.br/legislacOL/?p=175.
Rana, R., & Oliveira, F. S. (2014). Real-time dynamic pricing in a non-stationary environment using model-free reinforcement learning.
Omega (United Kingdom), 47, 116–126. Doi:
10.1016/j.omega.2013.10.004.
Sanz-Valle, R., Naranjo-Valencia, J. C., Jiménez-Jiménez, D., & Perez-Caballero, L. (2011). Linking organizational learning with technical innovation and organizational culture. Journal of Knowledge
25
Senge, P. (1990). The fifth discipline: The art and practice of learning. NY: Doubleday.
Tajeddini, K. (2011). Customer Orientation, Learning Orientation, and New Service Development: An Empirical Investigation of the Swiss Hotel Industry. Journal of Hospitality & Tourism Research, 35(4), 437–468. Doi:10.1177/1096348010380599
Templeton, G. F., Lewis, B. R., & Snyder, C. A. (2002). Development of a
Measure for the Organizational Learning Construct, 19(2), 175–218.
Templeton, G. F., Morris, S. A., Snyder, C. A., & Lewis, B. R. (2004). Methodological and thematic prescriptions for defining and measuring the organizational learning concept. Information Systems Frontiers, 6(3), 263–276.
Tippins, M. J., & Sohi, R. S. (2003). IT competency and firm performance: is organizational learning a missing link? Strategic Management
Journal, 24(8), 745–761. Doi: 10.1002/smj.337.
Viglia, G., Mauri, A., & Carricano, M. (2016). The exploration of hotel reference prices under dynamic pricing scenarios and different forms of competition. International Journal of Hospitality Management, 52, 46– 55. Doi: 10.1016/j.ijhm.2015.09.010
Yang, B. (2003). Identifying Valid and Reliable Measuresfor Dimensions of a Learning Culture. Advances in Developing Human Resources, 5(2), 152–162.
Received: 14. 03.2017 Revisions required: 23. 06.2017 Accepted: 15.11.2017