Analytics of Student Behaviour in a Learning
Management System as a Predictor
of Learning Success
Bertil P. Marques GILT/ISEP Porto - PORTUGAL [email protected] Jaime E. Villate FEUP Porto - PORTUGAL [email protected]Carlos Vaz Carvalho GILT/ISEP Porto - PORTUGAL
Abstract — Higher Education (HE) teachers are aware that the evolution of technology changed the way students build their knowledge. New forms of access to information and new means of communication allowed creating specialized learning tools. It is now important to understand how the students’ interaction with learning technologies influences their learning success. For that purpose, data referring to the use of a learning management system (LMS) supporting a specific course was collected and analyzed. Results indicate that a minor correlation exists between the effective use of those tools and student success.
Keywords - MOODLE, Academic Portal, ICT, Higher Education.
I. INTRODUCTION
For some time now, Learning Management Systems (LMS) have been used in the context of Higher Education to support online and offline courses. These platforms provide students with an extensive range of documentation, information and communication tools, depending on the structure defined by the teacher [1]. Furthermore, access to the platform is ubiquitous, in time and location, which necessarily changes the way students approach the learning process.
These platforms record and store all the user activity, from entry to exit, like access to files and folders, performed tasks, messages read and sent, assignments submitted, etc [2]. Teachers have access to this data but it is mostly researchers that apply concepts of Data Analysis, Big Data and Learning Analytics to analyze it [3] – [6]. The main reason is because most teachers do not have the required knowledge to apply these techniques. Therefore they need friendly tools, still non-existent, to do that analysis and provide them with the processed information.
Researchers normally use data from three main sources: (1) recorded text, (2) web server log files, and (3) learning software log files [4]. But Krüger et al. add that data is not stored in a systematic way so its thorough analysis requires long and tedious preprocessing [6]. In the same article, authors also present an overview of a system architecture to structure and export that data and its implementation for the Moodle LMS. Black et al. used e-learning tools to generate relevant information, for the teacher and the students, to optimize their learning process. The study combines data-processing and learning analytical to improve higher education learning processes. Authors conclude that activity logs of virtual learning environments provide real knowledge of the use of these environments, but also identify the need for new pedagogical approaches [4]. Alves et al. also studied the access to virtual learning environments (VLEs) and the large quantities of data resulting from both students and teachers' activities developed in those environments [3].
Some authors have used content analysis methods to study the interaction in discussion forums [8], [9]. Using text analysis methods (a process that uses algorithms capable of analyzing collections of text documents in order to extract knowledge), authors find online discussion types. The results of this experiment help teachers monitor online activities that take place in the discussion forums. Other authors have created software agents based on mathematical methods and statistical analysis to perform that data analysis [10] - [12].
In this paper, we present the process of data analysis of the behavior of students in a LMS to measure and contextualize their access (where, how many times, and in what form), their digital paths in the platform (what tools are used, actions or queries, use of resources, forum participation, etc.) and the
correlation with student learning success. The intention was to determine significant correlations that leads to the creation of a tool that allows teachers to make an early identification of students with problems.
This work was developed in the context of a PhD project whose objective was to study, discuss, propose and validate a support model for the adoption of Information and Communication Technologies (ICT) for pedagogical purposes in the HE scenario, and to propose a coherent and consistent model of institutional and pedagogical activity, centered on teachers [7].
II. DATA ANALYTICS AND CORRELATION
The LMS MOODLE collects a set of data that can, when analyzed, give teachers a tool to follow the student behavior in order to identify critical situations and preventing dropouts. Typical data relate to the number of accesses, duration of accesses, paths traversed in the platform, tools used, resources used or downloaded, participations in the forum and other activities [13]. For this study, data was collected during a period of 6 months (from September 1, 2014 to February 29, 2015) from the course on Computer Principles (PRCMP) of the BSc in Computer Engineering (LEI) of the Department of Informatics
Engineering (DEI). The population consisted of 364 individuals.
Figure 1 shows the histogram of the final grades obtained by the students. Approximately 3% of the students failed the course because they did not obtain the minimum grade required.
Figure 1 - Distribution of students according to the final grade of the course.
A. Access per moment of the day
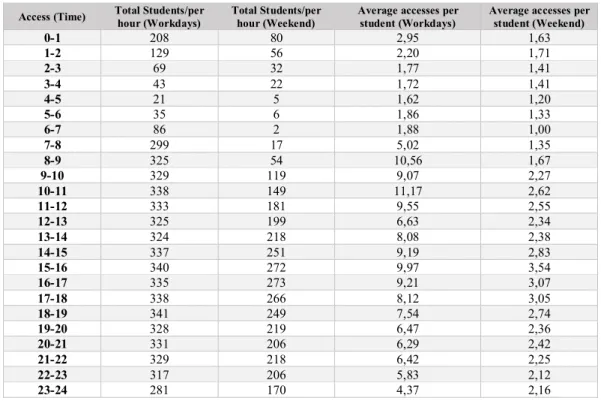
Data related to the distribution of accesses per hour and day was collected to characterize the students’ use of the platform (Table 1).
TABLE 1 - ACCESSES BY STUDENTS (WORKING DAYS AND WEEKENDS)
Access (Time) Total Students/per hour (Workdays) Total Students/per hour (Weekend) Average accesses per student (Workdays) Average accesses per student (Weekend)
0-1 208 80 2,95 1,63 1-2 129 56 2,20 1,71 2-3 69 32 1,77 1,41 3-4 43 22 1,72 1,41 4-5 21 5 1,62 1,20 5-6 35 6 1,86 1,33 6-7 86 2 1,88 1,00 7-8 299 17 5,02 1,35 8-9 325 54 10,56 1,67 9-10 329 119 9,07 2,27 10-11 338 149 11,17 2,62 11-12 333 181 9,55 2,55 12-13 325 199 6,63 2,34 13-14 324 218 8,08 2,38 14-15 337 251 9,19 2,83 15-16 340 272 9,97 3,54 16-17 335 273 9,21 3,07 17-18 338 266 8,12 3,05 18-19 341 249 7,54 2,74 19-20 328 219 6,47 2,36 20-21 331 206 6,29 2,42 21-22 329 218 6,42 2,25 22-23 317 206 5,83 2,12 23-24 281 170 4,37 2,16
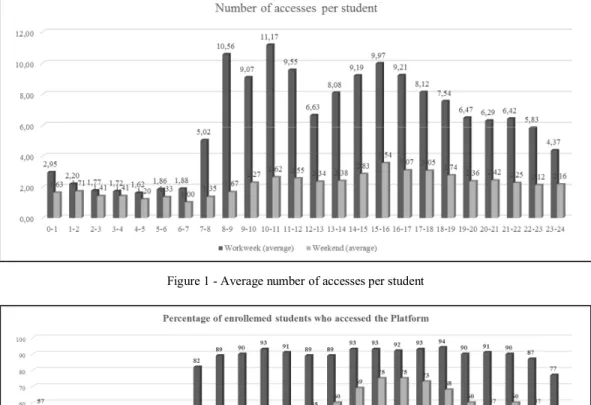
Figure 1 - Average number of accesses per student
Figure 2 - Percentage of enrolled students accessing the LMS in a certain hour
In Figure 1, the average number of accesses per student is shown in hourly intervals, at workdays and at weekends. There are more accesses on working days than on the weekend, and mainly between 8:00 and 24:00 (with a drop in the lunch period and during the dinner period). This hourly trend is also visible at the weekend, but less significant.
This distribution can be explained by the fact that, on working days, students access the LMS to accompany the classes (night classes go until 23:30). In the weekend, however, students enter the LMS to work autonomously. This explains why the total number of accesses is higher in working days than in the weekend. This ratio between working days and weekend is also visible in Figure 2, which shows the percentage of students who accessed the platform throughout the whole semester. Naturally, the use of the tool on weekends is more significative as it reflects the autonomous and self-motivated use of the platform contrary to most working days’ use. Therefore it is quite relevant that about 75% of all the students accessed the platform on weekends for at least one time as it shows a very high commitment level.
B. Total access data by grades
The summary of total accesses made by students is presented in Table 2, ranked by their grades (the grading system uses a scale from 0 to 20 points). The table also presents the normalization (total number of accesses/number of students per range) of those ratings.
TABLE 2 - ACCESS DATA AND NUMBER OF STUDENTS PER GRADE RANGE Range of Grades Stude nts Cumulative number of students Total Accesses Cumulative number of accesses Average number of accesses [0-8] 74 74 6401 6401 86,5 [8-10] 56 130 8333 14734 148,80 [10-12] 62 192 10206 24940 164,61 [12-14] 81 273 13828 38768 170,72 [14-16] 65 338 10880 49648 167,38 [16-18] 24 362 4176 53824 174,00 [18-20] 2 364 310 54134 155,00
From the collected data, we can see that the number of most relevant accesses corresponds to students who scored between 12 and 16, representing more than 40% of the accesses (Figure 3).
Figure 3 - Total number of platform accesses in total mode by grade
So, although it is not mandatory, a frequent use of the platform seems to lead to good results. Figure 4 shows the average number of accesses per student at each classification level. It is clear that students that had success (grade of 10 or higher) have more accesses on average. Curiously the higher ranked students are not the ones with the higher access average which is a phenomenon that deserves further study.
Figure 4 - Average number of accesses per student by grade
C. Correlations of grades and online activities
Table 3 shows several correlation scores calculated using access and participation data from LMS activities and the grades obtained by the students. The idea was to refine the analysis and try to identify which online learning activities would better correlate with the students’ results.
TABLE 3 - SUMMARY OF CORRELATIONS RELATED TO FINAL GRADES
Correlation
Access to documents / Final
Grade Correlation Final = 0,459403
Quizzes / Final Grade Correlation Final= 0,275544 Submission assignments / Final
Grade Correlation Final = 0,14841
Participation Forum / Final
Grade Correlation Final = 0,2243
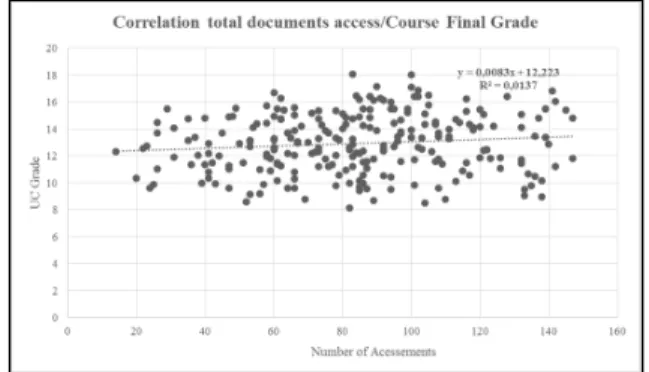
It can be seen that the access to documents (information) has the highest correlation with the learning success. In fact it is the
only number with significance as the other values do not reflect any correlation. Therefore a lengthier analysis was conducted on that aspect.
Figure 5 shows the students’ distribution between the access to course documents (T/TP and PL) and the final grade obtained.
Figure 5- Distribution of accesses to course documents versus students' score
This data suggested performing a higher granularity analysis to identify stronger correlation. Thus, we analyzed the number of accesses to the course documents considering 3 subgroups:
A- Students who did not obtain the minimum grade of the course (8.0 values) and did any number of accesses; B- Students who obtained the minimum grade of the course
(8.0 values) and made up to 150 accesses;
C- Students who obtained the minimum grade of the course (8.0 values) and did more than 150 accesses.
The results are shown in the following figures (Figure 6, 7 and 8).
A. Figure 7 represents the students that did not obtain the minimum grade of the course (8.0 values) and did any number of accesses to the platform.
Figure 6 - Students who did not obtain the minimum grade of the course (8.0 values) and did any number of accesses.
B. Figure 8 represents the students who obtained at least the minimum grade of the course (8.0 values) and made up to 150 accesses to the platform during the course of the course.
Figure 7 - Students who obtained the minimum score of the course (8.0 values) and made up to 150 accessions.
C. Figure 8 shows the graphical correlation between the students who obtained the minimum score of the course (8.0 values) and did more than 150 accesses to the course platform.
Figure 8 - Students who obtained at least the minimum score of the course (8.0 values) and did more than 150 accessions
The correlations obtained with this more granular subdivision were much lower than the correlation already obtained for the complete group, so it did not allow drawing additional conclusions.
The type of data extracted allows obtaining relevant course information. The problems arise when the complexity of the analysis is increased, for example by considering the presence effect in classes, resulting in large volumes of data difficult to be automatically treated. Another relevant problem is that the data used (logs) is very dependent on the structural organization of the course in the learning support platform. To obtain significant results implies a compulsory use of the platform and restructuring the courses according to a given model.
III. CONCLUSIONS
This study’s goal was to identify key factors of the process of acceptance and adoption of learning technologies by the teachers in order to foster the use of technological-based pedagogical tools. In fact, although teachers sometimes do not demonstrate a strong initial motivation, it was shown that it is possible to foster that adoption. However, the need for better tools was highlighted.
Regarding the factors that promoted this adoption, it was clear the need to be easily usable technologies, integrated into the information system of the institution and properly managed, so as to minimize the maintenance efforts of these tools by the user. It was also clear the need for a greater motivation on the part of the agents responsible for these more pedagogical activities. Therefore the need for an analysis of the possibility of creating a friendly tool that alerted teachers to potential problems of students resulting from the analysis of their quantitative and qualitative use of the institutional learning management system. An exhaustive data collection process was organized about every aspect of access and use of the platform tools. This data was then correlated with the students’ success, namely through their final score in the course.
It was verified the difficulty of creating an automatic tool for the treatment of the data collected from the LMS logs. On one part, this difficulty was related to the actual collection of data and the treatment process. On the other side, the collected results only showed minor correlation factors so no significant relation could be established and more data must be collected to achieve significant conclusions.
ACKNOWLEDGMENT
We would like to acknowledge the support of ISEP’s management to this work. Otherwise, the implementation of the case study would not have been possible.
REFERENCES
[1] D. Mota, L.P. Reis, C. Vaz de Carvalho, “Design of Learning Activities -Pedagogy, Technology and Delivery Trends”. ICST Trans. e-Education e-Learning 4: e5. 2014
[2] B.P. Marques, J. Villate, C. Vaz de Carvalho, “Tecnologias da Informação e Comunicação no apoio à aprendizagem no Ensino Superior”, Proceedings of CISTI 2010 - 5ª Conferencia Ibérica de Sistemas y Tecnologías de Información, ISBN: 978-989-96247-3-3, pp: 361-366, Santiago de Compostela, España. 2010
[3] P. Alves, L. Miranda and C. Morais, “Record of undergraduates’ activities in virtual learning environments”. ECEL2015 - 14th European Conference on e-Learning. Hatfield. p.25-33. ISBN 978-1-910810-71-2. 2015.
[4] E. W. Black, K. Dawson, and J. Priem, “Data for Free: Using LMS activity logs to measure community in online courses”. The Internet and Higher Education, 11, 2008, pp. 65-70.
[5] O. A. García and V. A. Secades, “Big Data & Learning Analytics: A Potential Way To Optimize ELearning Technological Tools”, Proceedings of the IADIS International Conference e-Learning 2013 ISBN (Book): 978-972-8939-88-5, Prague, Czech Republic 22-26 July. 2013.
[6] A. Krüger, A. Merceron and B. Wolf, “A Data Model to Ease Analysis and Mining of Educational Data”-, Proceedings of the 3rd International Conference on Educational Data Mining, Pittsburgh, PA, July 11-13. 2010.
[7] B.P. Marques, “Parameters of Adoption of E-Learning Technologies in Higher Education: A Case Study”. - Ph.D. final thesis. Faculty of Engineering of Porto - University of Porto - Defense in December 2015. [8] F.-R. Lin, L.-S. Hsieh, and F.-T. Chuang, Discovering genres of online
discussion threads via text mining, Computers & Education 52: 481–495. doi:10.1016/j.compedu.2008.10.005. . 2009
[9] L. P. Dringus and T. Ellis. Using data mining as a strategy for assessing asynchronous discussion forums, Computers & Education 45: 141–160. doi:10.1016/j.compedu.2004.05.003. 2005.
[10] F. Castro, A. Vellido, A. Nebot and F. Mugica. Applying data mining techniques to e-learning problems, Studies in Computational Intelligence (SCI) 62: 183–221. doi:10.1007/978-3-540-71974-8_8. 2007.
[11] J. Mamčenko and I. Šileikienė, Intelligent data analysis of e-learning system based on data warehouse, olap and data mining technologies, in The Proceedings of the 5th WSEAS International Conference on Education and Educational Technology(EDU ‘06), Tenerife, Canary Islands, Spain, December 16–18, 2006[CD]. Tenerife: WSEAS, 171–175. 2006
[12] S. Preidys, and L. Sakalauskas, Analysis of students’ study activities in virtual learning environments using data mining methods, Ukio Technologinis ir Ekonominis Vystymas, 16:1, 94-108. 2010.
[13] I. Santos, P. Escudeiro, C. Vaz de Carvalho, “ICTWays Network: ICT in Science Classrooms”, Proceedings of CISTI 2014 - 9ª Conferencia Ibérica de Sistemas y Tecnologías de Informacion, Barcelona, España, 2014, ISBN 978-989-98434-3-1