MATURITY IN MANAGEMENT ACCOUNTING: EXPLORATORY STUDY IN PORTUGUESE SME
Raul Manuel da Silva Laureano
Assistant Professor in Department of Quantitative Methods for Management and Economics, Instituto Universitário de Lisboa (ISCTE-IUL)
Researcher for UNIDE-IUL Avenida das Forças Armadas
1649-026 Lisboa, Portugal
Maria João Cardoso Vieira Machado Assistant Professor in Accounting Department, Instituto Universitário de Lisboa (ISCTE-IUL)
Researcher for UNIDE-IUL Avenida das Forças Armadas
1649-026 Lisboa, Portugal
Luís Miguel da Silva Laureano Assistant Professor in Finance Department, Instituto Universitário de Lisboa (ISCTE-IUL)
Researcher for UNIDE-IUL Avenida das Forças Armadas
1649-026 Lisboa, Portugal
Abstract
The purpose of this paper is to characterize the level of maturity of management accounting in Portuguese industrial SMEs. Specifically, the study classifies firms using Kaplan’s Four-Stage model; and introduces a new model to classify them better. The research design is exploratory. The data were collected through interviews with those responsible for management accounting in 58 Portuguese industrial SMEs. The analysis used descriptive and inferential statistics and a cluster analysis was performed to classify firms according to their management accounting characteristics. The results showed that all the SMEs belong to stage 2 of Kaplan’s model and that it is possible to classify them in one of the four stages of the proposed new model. Moreover, the type of firm and the source of capital have no influence on the level of maturity, although larger firms tend to have greater maturity. The study offers evidence that there is a clear difference between management accounting knowledge and practices, which should motivate top management to focus on the continuous training of firm employees on the latest developments in management accounting methods.
Key words: Management accounting practices, Kaplan’s model, SME, Maturity stages
1 - Introduction
This paper aims to produce additional knowledge regarding the management accounting methods used by small and medium-sized industrial enterprises (SME). Several authors have studied whether the most adequate management accounting methods according to the existing theory are being implemented, namely regarding performance evaluation (Sundin et al., 2010; Tayler, 2010; Vila et al., 2010; Herath et al., 2010; Kraus – Lind, 2010; Cokins, 2010; Albright et al., 2010; Neumann et al., 2010; Cardinaels – Veen-Dirks, 2010; Northcott – Smith, 2011; Butler et al., 2011) and product valuation (Hoozée – Bruggeman, 2010; Nassar et al., 2011; Pike et al., 2011; Stout – Propri, 2011; Schoute, 2011).
Previous studies have identified a positive association between a firm’s value and the use of more advanced methods of product valuation (Kennedy – Affleck-Graves, 2001; Cagwin – Bouwman, 2002) and performance evaluation (Hoque – James, 2000; Crabtree – Debusk, 2008). Dearman – Shields (2001) and Machado (2013) state that correct management decisions can be taken as long as managers know about the most adequate methods, even when using less adequate methods according to theory. The results presented lead to the conclusion that it is not enough to study the implementation level of the most adequate accounting management methods, but also the level of knowledge regarding these methods among the decision makers.
Management accounting practices have weak penetration in Portuguese SMEs due to this type of accounting being optional. This justifies carrying out empirical studies in this country as a contribution to the contingency theory, since the latter recognizes that cultural differences among countries represent a differentiating factor in the management accounting methods used (Yang et al., 2006; Macarthur, 2006).
Research on SMEs is of great importance in countries where these firms are the major contributors to the domestic economy, namely in terms of employment (González – Rodríguez, 2008). The accounting methods used by SMEs is a common research topic among several recent empirical studies performed on different geographical areas, such as in France (Demerens et al., 2013), China (Liu, 2012), Italy (Chiarini, 2012), Romania (Fekete et al., 2010) and Canada (Briciu et al., 2009). A recent study developed in Portugal by IAPMEI - Portuguese Agency for Competitiveness and Innovation (IAPMEI, 2008), reports that 99.6% of the total of domestic firms are either small or medium-sized, which gives relevance to the study of this type of firm when characterizing the country’s economic environment.
The main goal of this research is to contribute to better understanding of the characterization of the maturity level of management accounting in Portuguese SMEs.
In searching for the best management practices in SMEs, we delimit our study to the 163 firms classified for three consecutive years as excellence-industry according to IAPMEI (2002) criteria (firms that stand out for their financial and economic performance).
Briciu et al. (2009) perform a comparative study between SMEs from Canada and Romania, two countries located in different continents. The authors conclude that the needs for management accounting information are identical for all SMEs, independent of their geographical area. The conclusions from Briciu et al. (2009) suggest the possibility of generalization of the results of the present study, performed on Portuguese SMEs, to other countries with similar business community.
In the next section we describe Kaplan’s Four-Stage model and find support for the research questions; the methodology applied in sampling and data treatment is presented in section 3 while the results obtained from data analysis are reported in section 4; we conclude in section 5 and present the final arguments.
2 - Kaplan’s four-stage model and research questions
In the late 20th century, Robert Kaplan presented a model where firms are classified according to the level of development of the management accounting practices implemented (Kaplan, 1990). According to the model, each firm is positioned in one of the four stages, each stage representing different accounting management methods: stage 1 is characterized by the use of inadequate methods for financial reporting needs; stage 2 is characterized by the implementation of methods oriented towards financial reporting; stage 3 is characterized by innovation and relevance to management; and stage 4 is characterized by integration.
According to Kaplan (1990), firms that use low-quality accounting information, with significant logging and transaction processing errors, with the sole purpose of meeting financial accounting needs, are integrated in stage 1.
The accounting methods of firms in stage 2 are mainly driven towards external reports (Kaplan, 1990). The necessary information used to produce the reports is duly processed and analyzed and has no significant errors. Companies present accounting management systems oriented towards the fulfilment of financial accounting needs, namely through product valuation in which the main purpose is simply inventory valuation. The allocation of products’ costs is inadequate for decision-making, since the indirect costs are split using criteria sensitive to the quantities produced or sold, such as man-hour and machine-hour (Kaplan, 1990).
Horngren (2004) considers that the search for the most adequate allocation bases to relate indirect costs to products has led to using a single base instead of multiple bases, in a systematic attempt to improve the relation between the chosen bases and the factors that lead to the existence of the cost. Although considered better, multiple base allocation still receives much criticism. Though Cooper (1987a and 1987b) recognizes that using other allocation bases such as machine-hour or the cost of materials, in addition to direct labor, has improved the allocation of indirect costs, they are still inadequate, because all of them are influenced by the quantity produced of each product, which leads to the over-valuation of goods produced in high quantities, and under-valuation of goods produced in small quantities.
Despite the limitations suggested by existing theory regarding product valuation, through one or more allocation bases influenced by the production volume, several empirical studies report on the use of these methods in different countries (Clarke, 1997; Joshi, 2001; Haldma – Lääts, 2002).
Stage 3 includes firms with advanced, but not integrated, information methods. These firms use Activity Based Costing (ABC) as a new solution to allocate indirect costs, which overcomes the limitations of the previous methods mentioned. This advantage does not come from the way that costs unrelated to production volume are treated, but from other factors, such as the number of production orders or the number of products (Cooper, 1988).
The other product valuation methods allocate indirect costs through allocation bases influenced by production volume, which may not reflect the true consumption of organizational resources required by the products (Swenson, 1995). Kennedy – Affleck-Graves (2001) and Cagwin – Bouwman (2002) find a positive impact on the firm when using ABC and conclude in their empirical studies that using ABC leads, on average, to higher earnings. On the other hand, despite the theoretical supremacy of ABC, several empirical studies report a low usage rate of this method. In most countries we can find usage rates of 20% or lower (Blake et al., 2000; Innes et al., 2000; Joshi, 2001; Cotton – Jackman, 2002; Haldma – Lääts, 2002).
This paradox between theory and corporate practice, reported by existing empirical studies, provides researchers with a continuing challenge to study whether firms are using the
most suitable product valuation methods according to theory, namely ABC (Hoozée – Bruggeman, 2010; Nassar et al., 2011; Pike et al., 2011; Stout – Propri, 2011; Schoute, 2011). The management accounting of firms in stage 3 also provides quantitative and qualitative information for performance evaluation, namely through using the Balanced Scorecard (BSC). Development of the BSC resulted from the need to improve traditional financial models, which rely on measurement of past financial performance in a short-term perspective, to a model that includes non-financial measures and allows for future performance evaluation with a medium-term and long-term focus (Kaplan – Norton, 1996b).
Kaplan – Norton (1992) define the BSC as a set of measures that give top management a quick, overall view of the business, integrating financial measures that reflect the actions taken in the past and non-financial or operational measures that will be used as guidelines for future financial performance. The BSC shows up in this phase as a model that enforces strategy and vision as being crucial and decisive in the organization, instead of control (Kaplan – Norton, 1992).
However, corporate experience led to evolution of the concept, with authors stating that the BSC is much more than a set of measures. It is a management system that can lead to progress in critical organizational areas, for example, products, processes, clients and market development. Thus, the BSC evolved from a measurement system to a management system.
Kaplan – Norton (1996a), through observation, found that organizations are transforming their BSC in a new strategic management system, far removed from the initial concept. In the last decade many researchers have still found the BSC to be a relevant research topic (Sundin et al., 2010; Tayler, 2010; Vila et al., 2010; Herath et al., 2010; Kraus – Lind, 2010; Cokins, 2010; Albright et al., 2010; Neumann et al., 2010; Cardinaels – Veen-Dirks, 2010; Northcott – Smith, 2011; Butler et al., 2011). Hoque – James (2000) and Crabtree – Debusk (2008) find a positive impact on the firm when using the BSC, the authors concluding in their empirical studies that its use leads on average to higher earnings.
Firms in stage 4 use the management accounting instruments that characterize stage 3, although they are executed through integrated computer systems, that is, they rely on Enterprise Resource Planning (ERP) systems. Firms in this stage prepare their external reports using information from the management account itself, which constitutes an inverse philosophy when compared to the second stage where accounting management systems are developed from other systems created to satisfy financial accounting needs (Kaplan, 1990).
Several studies previously mentioned allow us to identify the most commonly used management accounting methods, although none of them classifies firms according to the development stage of those same methods. Thus, the main objectives of this research are related to: classification of Portuguese industrial SMEs regarding the level of management accounting using Kaplan’s Four-Stage model; and introduction of a new model to better classify these types of firms.
According to those objectives we identify the following research questions:
Question A – How are industrial SMEs classified according to Kaplan’s (1990) Four-Stage model?
Question B – Is it possible to introduce a new model to differentiate industrial SMEs? Question C – In the case of a positive answer to the previous question, which characteristics can be identified in the SME at each stage of the new model?
3 - Methodology
To answer the proposed research questions we gathered a sample of 58 firms from a universe of 163 Portuguese industrial SMEs consistently classified (three or more consecutive years) as excellence-industry by the IAPMEI (2002, 2008).
The 58 firms that agreed to participate in this study represent a response rate of 36%, which is comparable to other research studies, namely Haldma – Lääts (2002), with a response rate of 34%, Innes et al. (2000), Joshi (2001), with response rates of only 25%, 23% and 24%, respectively.
The necessary data for the study were gathered through interviews held with the managers responsible for management accounting, since we assume they have the information about which we want to collect evidence. We obtained data regarding firm characteristics (location of headquarters, industry, number of workers, amount of capital, capital ownership, corporate legal form and sales volume) and management accounting characteristics (methods of corporate allocation of indirect costs towards product valuation, usage of ABC, usage of BSC, knowledge of ABC, and knowledge of BSC). Kaplan’s Four-Stage model (Kaplan, 1990) considers that firms with more advanced accounting methods are those using the ABC and the BSC. However, the current empirical study shows evidence of extremely low adoption rates of both methods among SMEs, which led us to the inclusion of knowledge variables (Dearman – Shields, 2001; Machado, 2013).
Non-respondents can lead to biased results, namely if these non-participating firms have homogeneous characteristics different from the respondents. According to Van der Stede et al. (2005), firm size can be relevant in the existence of bias. We compare the size of respondent and non-respondent firms using the average number of workers as a proxy, as suggested by Van der Stede et al. (2005). We find no significant differences between the groups of firms (t(161)=1.165; p-value=0.246). This allows us to conclude that our results, although not applicable to all Portuguese industrial SMEs, may characterize a sub-group of those firms, those consistently classified as showing excellence in the current century.
Abernethy et al. (1999) concluded that regardless of the research method used, a generalization based solely on a single research paper is necessarily limited and therefore untrustworthy. These authors believe that generalization in managerial accounting has to be achieved through a series of consecutive studies with new samples, in different places and different periods.
To answer the first question (Question A) we rely on descriptive analyses of the main management accounting practices (the methods of allocating indirect costs in product valuation, use of ABC, and use of the BSC) in the participating firms.
Dearman – Shields (2001) concluded that, even using management accounting methods considered by the existing theory as inadequate, managers can still make correct management decisions, as long as they have knowledge of the adequate alternative methods. This knowledge allows them to know that the information gathered by the firm’s implemented methods is skewed (Dearman – Shields, 2001). From the authors’ conclusions, we find it is important not only to study use of ABC and BSC, but also the amount of knowledge held by the management accounting manager regarding these methods.
For Question B we use cluster analysis, which is a multivariate data analysis technique classifying firms according to a set of characteristics, identifying clusters with high internal homogeneity, that is, among firms of the same group, and with high external heterogeneity, that is, between groups (Hair et al., 2010). Since the characteristics related to management accounting practices (the methods of allocating indirect costs in product valuation, knowledge of ABC, and knowledge of BSC) are all nominal, we use the hierarchical clustering method.
After several experiments with different clustering methods, we chose the solution that uses the chi-squared distance measurement and the Average Linkage (within groups) clustering method. According to Hair (2010), this method combines the clusters so that the average distance between all possible pairs of firms in each resulting group is the minimum. Internal validation of the clusters was performed through contingency tables between the identified cluster and each of the management accounting practices used to classify firms, and
also through chi-squared independence tests which showed evidence of the relation between the cluster and the characteristics used in the clustering process. Characterizing these relations allowed us to match each cluster to the maturity stage included in the proposed new model to classify firms’ level of management accounting.
Lastly, the answer to Question C (which corresponds to external validation of the homogeneous clusters) relies on a bivariate descriptive analysis to characterize the relation between the maturity stage and each firm characteristic (capital ownership, corporate legal form, capital, sales, and number of workers). The results obtained showed robustness when using the chi-squared independence test and the Spearman test of the coefficient significance of the ordinal correlation.
4 - Results and discussion
4.1. - Sample description
Table 1 allows us to characterize the 58 participating SMEs. These are mostly joint stock companies (56.9%) and with 100% of domestic capital (94.83%). On average, the amount of capital is 1.4 million euros, with a standard deviation (SD) of 1.4 million euros, but half the firms have, at the most, capital of 998.8 thousand euros. Sales are, on average, 8.5 million euros (SD=9.4 million euros) and half the firms have sales of 5.5 million euros or more. The number of workers ranges from 10 to 416 and, on average, firms have 95 employees (SD=67 workers).
Table 1 –Characteristics of participating firms
Characteristics Firms %
Capital ownership 100% domestic 55 94.83
Minority foreign stake 1 1.72
Majority foreign stake 2 3.45
Total 58 100.00
Corporate legal form Private limited 25 43.10
Joint stock 33 56.90
Total 58 100.00
Characteristics Firms Average SD Min. P.25 P.50 P.75 Max.
Capital (x1,000€) 58 1,362.8 1,411.4 7.0 303.0 998.8 1,735.0 6,500.0
Sales (x1,000€) 58 8,469.4 9,358.7 1,716.8 4,063.6 5,531.4 9,538.9 64,000.0
Nº of workers 58 94.6 67.4 10 51 82 119 416
4.2. - Industrial SME classification according to Kaplan’s Four-Stage model
Regarding the first research question, the data collected allow us to conclude that all firms are classified in stage 2 of Kaplan’s (1990) Four-Stage model. From the results in Table 2, we find that all firms have implemented management accounting methods for product valuation, methods considered in the model as inadequate for the decision-making process: 24.14% of firms only value their products through direct costs; the remaining firms (75.86%) value their products through allocation bases influenced by the production level, with the most commonly used being machine-hour; none of the firms use ABC. Only 5.17% of firms rely on evaluation performance instruments, with the BSC being used in all these cases. We conclude that the maturity level of these firms regarding management accounting methods is low, which leads us to Question B.
Table 2 – Management accounting methods used
Methods Firms %
Methods of Allocating Indirect Costs Without allocation 14 24.14
Single base 28 48.28
Multiple bases 16 27.59
Total 58 100.00
Usage of Activity Based Costing Yes 0 0.00
No 58 100.00
Total 58 100.00
Usage of Balanced Scorecard Yes 3 5.17
No 55 94.83
Total 58 100.00
4.3. Introducing a new model to classify SMEs
In the second research question we aim to introduce a new model that allows for SME classification according to the level of management accounting. Since none of the firms uses ABC and only three use the BSC, this model is sustained on the method used in product valuation and on knowledge of ABC and BSC. The studies of Dearman – Shields (2001) and Machado (2013) give support to the inclusion of the variables on knowledge.
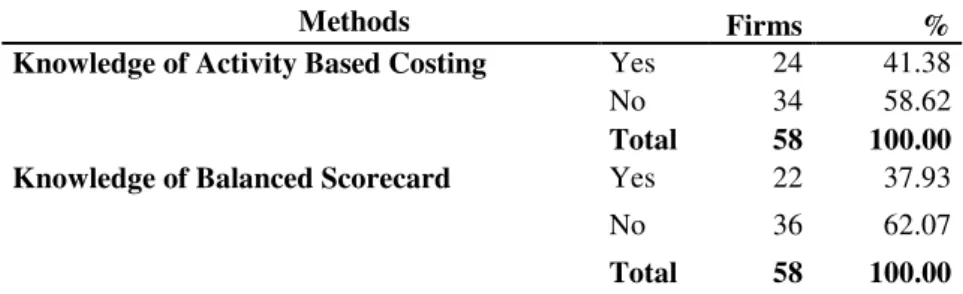
Table 3 shows that the majority of managers do not know ABC (58.62%) or BSC (62.07%).
Table 3 –Knowledge of management accounting methods
Methods Firms %
Knowledge of Activity Based Costing Yes 24 41.38
No 34 58.62
Total 58 100.00
Knowledge of Balanced Scorecard Yes 22 37.93
No 36 62.07
Total 58 100.00
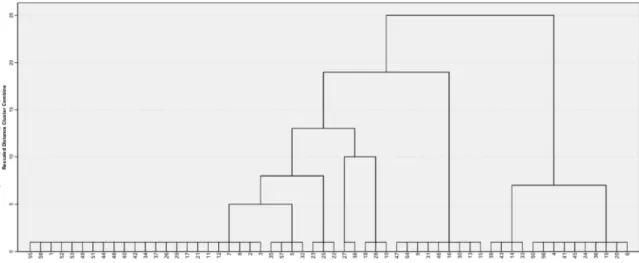
We apply cluster analysis to cluster firms in homogeneous groups according to the following characteristics: method of allocating indirect costs; knowledge of ABC; and knowledge of BSC. After looking into different solutions, we opted for a four-group solution sustained by the dendrogram analysis (Figure 1) and the fusion coefficients (not reported) resulting from the Average Linkage (within groups) cluster method and the chi-squared association measure (measure of characteristics’ similarity).
The resulting clusters have significantly different sizes: 30, 5, 9 and 14 firms from cluster 1 to 4, respectively. Table 4 allows us to characterize the clusters according to the characteristics used to identify them. From these results we are able to introduce a new model, called Maturity Stages of Management Accounting.
Table 4 –Different management accounting methods by maturity stage
Management accounting methods
Maturity
Stage 1 Stage 2 Stage 3 Stage 4
Firms % Firms % Firms % Firms %
Methods of Allocating Indirect Costs Without allocation 9 100.00 5 16.67 0 0.00 0 0.00 Single base 0 0.00 21 70.00 3 60.00 4 28.57 Multiple bases 0 0.00 4 13.33 2 40.00 10 71.43 Total 9 100.00 30 100.00 5 100.00 14 100.00 Knowledge of Activity Based Costing Yes 0 0.00 5 16.67 5 100.00 14 100.00 No 9 100.00 25 83.33 0 0.00 0 0.00 Total 9 100.00 30 100.00 5 100.00 14 100.00 Knowledge of Balanced Scorecard Yes 0 0.00 8 26.67 0 0.00 14 100.00 No 9 100.00 22 73.33 5 100.00 0 0.00 Total 9 100.00 30 100.00 5 100.00 14 100.00
Firms are characterized by the following four stages of maturity: maturity stage 1 includes all firms that do not allocate indirect costs and where managers do not know the ABC and BSC methods; maturity stage 2 includes firms where the majority (70%) use a single allocation base of indirect costs, but where managers do not know ABC (83.33%) or BSC (73.33%); maturity stage 3 includes firms that allocate indirect costs, either with a single base (60%) or using multiple bases (40%), all managers have knowledge of ABC, but none regarding BSC; maturity stage 4, the most advanced, is characterized by firms that mostly use multiple allocation bases of indirect costs (71.43%) and where all managers have knowledge of both the ABC and BSC methods.
The analysis reveals a clear differentiation between the different stages of maturity, allowing us to state that firms in each stage are homogeneous and different from the other stages regarding management accounting methods, that is, we can consider that the stages resulting from the cluster analysis are internally validated. This validation is also confirmed by the result of the chi-squared independence test and by the level of association between each of the management accounting practices and the stage of maturity. In fact, all the results (see Table 5) show the existence of strong associations, measured by the Cramer’s V, and
they are also significant (all significance probabilities associated with the results of the chi-squared test are almost null, that is, under 0.001, thus rejecting the null hypothesis that both characteristics are independent).
Table 5 – Relation between stage of maturity and the different management accounting methods (results of the chi-squared independence test)
Management Accounting Methods Chi-squared df p-value exact Cramer's V Methods of Allocating indirect costs 50.010 6 <0.001 0.657 Knowledge of Activity Based Costing 40.823 3 <0.001 0.839 Knowledge of Balanced Scorecard 33.081 3 <0.001 0.755 n = 58 firms
The results show that, in fact, it is possible to classify SMEs according to their level of management accounting. Maturity stage 4 is where management accounting practices are most developed.
4.4. Firm characteristics in each maturity stage of the new model
After introducing the new model to classify SMEs in four stages of maturity according to the level of management accounting, it is important to identify the firm characteristics used to discriminate between the different stages.
Looking at Table 6, we have a clear understanding that the type of corporate legal form and capital ownership are not predictors of management accounting characteristics. In fact, in the first three maturity stages, all firms have exclusively domestic capital and in maturity stage 4 a great majority of firms (78.57%) also have 100% domestic capital. Likewise, in all maturity stages we find a similar percentage of firms, between 55.56% for maturity stage 1 and 60% for maturity stage 3, that are joint stock companies
Table 6 –Influence of capital ownership and corporate legal form on stage of maturity
Characteristics
Maturity
Stage 1 Stage 2 Stage 3 Stage 4
Firms % Firms % Firms % Firms %
Capital ownership
100% domestic 9 100.00 30 100.00 5 100.00 11 78.57
Minority foreign stake 0 0.00 0 0.00 0 0.00 1 7.14
Majority foreign stake 0 0.00 0 0.00 0 0.00 2 14.29
Total (χ2(9)=9.943;p-value exact=0.164) 9 100.00 30 100.00 5 100.00 14 100.00 Corporate legal form Private limited 4 44.44 13 43.33 2 40.00 6 42.86 Joint stock 5 55.56 17 56.67 3 60.00 8 57.14 Total (χ2 (3)=0.027;p-value exact=1.000) 9 100.00 30 100.00 5 100.00 14 100.00
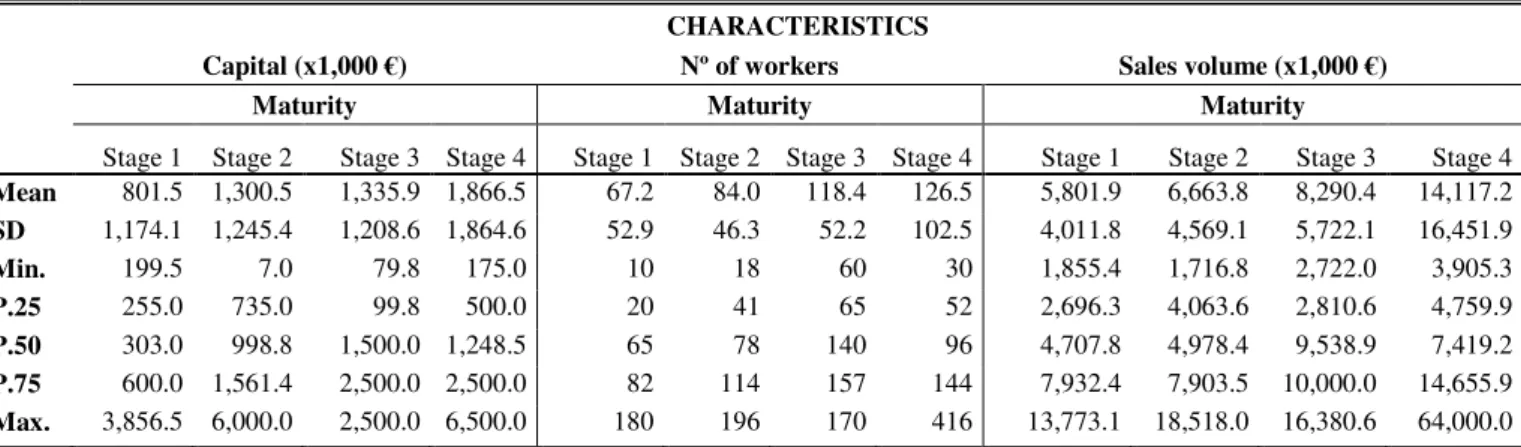
When analyzing the influence of the quantitative characteristics that proxy for firm size (amount of capital and number of workers) and for the level of activity (sales volume), we find, going from maturity stage 1 to maturity stages 3 or 4, a slight trend of firms being bigger and reporting a higher sales volume, both on average and in terms of the median (see Table 7).
In maturity stage 1, firms have, on average, capital of 801.5 thousand euros (SD=1,174.1 thousand euros), a sales volume of 5,801.9 thousand euros (SD=4,011.8 thousand euros) and 67 workers (SD=53 workers). In maturity stage 4, two of these three factors double in value, with averages of 1,866.5 thousand euros (SD=1,864.6 thousand euros) for capital, 14,117.2 thousand euros (SD=16,451.9 thousand euros) for sales volume, and 127 workers (SD=103 workers) for the number employed.
Despite the dispersion around the mean, we find similar results using the median value. First, in maturity stage 1, half the firms have a maximum capital of 303.0 thousand euros, a maximum sales volume of 4,707.8 thousand euros and a maximum number of 65 workers. On the other hand, in maturity stage 4, and for the same percentage of firms, we find maximum values of 1,248.5 thousand euros for capital, 7,419.2 thousand euros for sales volume and 96 for the number of workers.
Table 7 –Influence of firm size and level of activity on the stage of maturity
CHARACTERISTICS
Capital (x1,000 €) Nº of workers Sales volume (x1,000 €)
Maturity Maturity Maturity
Stage 1 Stage 2 Stage 3 Stage 4 Stage 1 Stage 2 Stage 3 Stage 4 Stage 1 Stage 2 Stage 3 Stage 4 Mean 801.5 1,300.5 1,335.9 1,866.5 67.2 84.0 118.4 126.5 5,801.9 6,663.8 8,290.4 14,117.2 SD 1,174.1 1,245.4 1,208.6 1,864.6 52.9 46.3 52.2 102.5 4,011.8 4,569.1 5,722.1 16,451.9 Min. 199.5 7.0 79.8 175.0 10 18 60 30 1,855.4 1,716.8 2,722.0 3,905.3 P.25 255.0 735.0 99.8 500.0 20 41 65 52 2,696.3 4,063.6 2,810.6 4,759.9 P.50 303.0 998.8 1,500.0 1,248.5 65 78 140 96 4,707.8 4,978.4 9,538.9 7,419.2 P.75 600.0 1,561.4 2,500.0 2,500.0 82 114 157 144 7,932.4 7,903.5 10,000.0 14,655.9 Max. 3,856.5 6,000.0 2,500.0 6,500.0 180 196 170 416 13,773.1 18,518.0 16,380.6 64,000.0
We find a positive and weak relation (Spearman coefficients between 0.2 and 0.3) between capital, number of workers and sales volume, and the maturity stages of management accounting (see Table 8). We should point out, however, that the relations are only statistically significant at a 0.05 significance level, for sales volume and number of workers, and at a significance level of 0.1, for capital. Since we find differences between the maturity stages in respect of characteristics not directly related to management accounting, we can consider that the homogeneous groups identified using cluster analysis are externally validated.
Table 8 –Spearman correlation coefficients between firm size and level of activity, and maturity stage
Capital Nº of workers Sales volume
Maturity stages Spearman 0.240 0.278 0.278
p-value 0.069 0.035 0.035
5 - Conclusions
This paper aims to contribute to knowledge of the management accounting methods implemented by industrial SMEs. Regarding the first research question, Kaplan’s (1990) Four-Stage model was used to classify the management accounting level of Portuguese industrial SMEs. The information gathered lets us conclude that all firms are included in stage 2, which does not allow for their differentiation.
With the previously mentioned limitation, we raised the second research question which led to the inclusion of other management accounting characteristics to differentiate these types of firms. Consequently, we proposed a new model, named Management Accounting Maturity Stage, which classifies firms in four stages of maturity. Its pillars rely on knowledge of the management accounting methods (ABC and BSC) and on methods of allocating indirect costs in product valuation.
Maturity stage 1 is characterized by the difficulty of carrying out product valuation due to the inexistence of methods of allocating indirect costs, and by the fact that those responsible for management accounting do not know the ABC and BSC methods. In maturity stage 2, most firms already carry out product valuation with indirect costs, but use a single allocation base, which is considered inadequate by the referenced theory; the majority of managers do not know ABC and BSC. In the most advanced stages, maturity stage 3 includes firms that already evaluate their products including indirect costs, although the majority still use only one allocation base; all managers know ABC, which according to the relevant theory can improve decision making; none of those in charge of management accounting knows the BSC. Maturity stage 4 is where management accounting characteristics are most developed: all firms evaluate their products including indirect costs and the majority already use multiple allocation bases; all managers have knowledge of the ABC and BSC methods.
The third research question was defined with the main objective of analyzing which characteristics of SMEs are present in each new maturity stage. The results show that corporate legal form and capital ownership are not determinants for identification of the stage of maturity. However, other characteristics can be associated with the stage of maturity: firm size, proxied by the amount of capital and number of workers; and level of activity, proxied by sales volume. Smaller firms with lower sales volume are associated with maturity stage 1; larger firms with higher sales volume are associated with maturity stage 4.
The main limitation of this research is the small number of participating firms. However, it contributes clearly to knowledge of management accounting in two ways. First, using Kaplan’s (1990) Four-Stage model, all Portuguese industrial SME are classified in the same stage of maturity, not allowing for their differentiation; using the proposed new model we are able to differentiate these firms in four stages of maturity. Secondly, it uses knowledge of management accounting methods as a differentiating factor, something which motivates top management to focus on the continuous training of employees on the latest developments in management accounting methods. Other studies have reported that the needs for management accounting information are identical to all SMEs, independent of their geographical area, which suggests that the present findings on Portuguese SMEs can be generalized to other countries with similar business community.
Despite this important contribution for countries with a large number of SMEs, the evidence suggests the need for future research as a way to validate implementation of this new model in other industrial and non-industrial SMEs.
Abernethy, M.A. – Chua, W.F. – Luckett, P.F. – Selto, F.H. (1999): Research in managerial accounting: Learning from others’ experiences. Accounting and Finance 39(1): 1-27.
Albright, T. – Burgess, C.M. – Hibbets, A.R. – Roberts, M.L. (2010): Four steps to simplify multimeasure performance evaluations using the balanced scorecard. The
Journal of Corporate Accounting & Finance 21(5): 63-68.
Blake, J. – Amat, O. – Wraith, P. (2000): Developing a new national management accounting framework: the Spanish case. European Business Review 12(3): 122-128. Briciu, S. – Groza, C. – Gânfãlean, I. (2009): International Financial Reporting Standard
(IFRS) will support management accounting system for Small and Medium Enterprise (SME)?. Annales Universitatis Apulensis Series Oeconomica 11(1): 308-317.
Butler, J. – Henderson, S.C. – Rainborn, C. (2011): Sustainability and the balanced scorecard: integrating green measures into business reporting. Management
Accounting Quarterly 12(2): 2-11.
Cagwin, D. – Bouwman, M. (2002): The association between activity-based costing and improvement in financial performance. Management Accounting Research 13(1): 1-39.
Cardinaels, E. – Veen-Dirks, P.M. (2010): Financial versus non-financial information: the impact of information organization and presentation in a balanced scorecard.
Accounting, Organizations and Society 35(6): 565-578.
Chiarini A (2012): Lean Production: mistakes and limitations of accounting systems inside the SME sector. Journal of Manufacturing Technology Management 23(5): 681-700. Clarke, P. (1997): Management accounting practices in large Irish manufacturing firms.
IBAR- Irish Business and Administrative Research 18(1): 136-152.
Cokins, G. (2010): The promise and perils of the balanced scorecard. The Journal of
Corporate Accounting & Finance 21(3): 19-28.
Cooper, R. (1987a): The Two-Stage Procedure in Cost Accounting: Part One. Journal of
Cost Management Summer: 43-51.
Cooper, R. (1987b): Does Your Company Need a New Cost System?. Journal of Cost
Management Spring: 45-49.
Cooper, R. (1988): The Rise of Based Costing – Part One: What Is an Activity-Based Cost System?. Journal of Cost Management Summer: 45-54.
Cotton, B. – Jackman, S. (2002): Activity based costing: not an easy ABC. Chartered
Accountants Journal of New Zealand 81(4): 35-37.
Crabtree, A.D. – Debusk, G.K. (2008): The effects of adopting the balanced scorecard on shareholder returns. Advances in Accounting 24(1): 8-15.
Dearman, D.T. – Shields, M.D. (2001): Cost knowledge and cost-based judgment performance. Journal of Management Accounting Research 13(1): 1-18.
Demerens F. – Pare J.-L. – Redis J. (2013): Investor Skepticism and Creative Accounting: The Case of a French SME Listed on Alternext. International Journal of Business 18(1): 59-80.
Fekete, S. – Damagum, Y. M. – Mustata, R. – Matis, D. – Popa, I. (2010): Explaining accounting policy choices of SME’s: An empirical research on the evaluation methods. European Research Studies 13(1): 33-48.
González, P. – Rodríguez, T. (2008): Una aproximación al modelo de toma de decisiones usado por los gerentes de las micro, pequeñas y medianas empresas ubicadas en Cali, Colombia desde un enfoque de modelos de decisión e indicadores financieros y no financieros. Universo Contábil 6(3): 140-155.
Hair, J. – Black, B. – Babin, B. – Anderson, R. and Tatham, R. (2010): Multivariate Data
Haldma, T. – Lääts, K. (2002): Contingencies influencing the management accounting practices of Estonian manufacturing companies. Management Accounting Research 13(4): 379-400.
Herath, H. – Bremser, W. – Birnberg, J. (2010): Joint selection of Balanced Scorecard targets and weights in a collaborative setting. Journal of Accounting Public Policy 29(1): 45-59.
Hoozée, S. – Bruggeman, W. (2010): Identifying operational improvements during the design of a time-driven ABC system: the role of collective worker participation and leadership style. Management Accounting Research 21(3): 185-198.
Hoque, Z. – James, W. (2000): Linking Balanced Scorecard Measures to Size and Market Factors: Impact on Organizational Performance. Journal of Management Accounting
Research 12(1): 1-17.
Horngren, C.T. (2004): Management accounting: some comments. Journal of Management
Accounting Research 16(1): 207-211.
IAPMEI (2002): National business structure. Lisboa: Gabinete de Estudos do Instituto de Apoio às Pequenas e Médias Empresas e ao Investimento.
IAPMEI (2008): On SMEs in Portugal. Lisboa: Direção de Planeamento e Estudos do Instituto de Apoio às Pequenas e Médias Empresas e ao Investimento.
Innes, J. – Mitchell, F. – Sinclair, D. (2000): Activity-based costing in the U.K.’s largest companies: a comparison of 1994 and 1999 survey results. Management Accounting
Research 11(3): 349-362.
Joshi, P.L. (2001): The international diffusion of new management accounting practices: The case of India. Journal of International Accounting Auditing & Taxation 10(1): 85-109.
Kaplan, R.S. (1990): The Four-Stage Model of Cost Systems design. Management
Accounting February: 22-26.
Kaplan, R.S. – Norton, D.P. (1992): The balanced scorecard: measures that drive performance. Harvard Business Review 70(1): 71-79.
Kaplan, R.S. – Norton, D.P. (1996a): Using the balanced scorecard as a strategic management system. Harvard Business Review 74(1): 75-85.
Kaplan, R.S. – Norton, D.P. (1996b): The balanced scorecard: translating strategy into
action. MA, Boston: Harvard Business School Press.
Kennedy, T. – Affleck-Graves, J. (2001): The Impact of activity-Based Costing Techniques on Firm Performance. Journal of Management Accounting Research 13(1): 19-45. Kraus, K. – Lind, J. (2010): The impact of corporate balanced scorecard on corporate
control: a research note. Management Accounting Research 21(4): 265-277.
Liu, Z. (2012): The construction of SME accounting information system. Management &
Engineering 7(1): 1838-5745.
Macarthur, J. (2006): Cultural influences on German versus U.S. management accounting practices. Management Accounting Quarterly 7(2): 10-16.
Machado, M.J. (2013): Balanced Scorecard: Empirical Study on Small and Medium Size Enterprises. RBGN – Review of Business Management 15(46): 129-148.
Nassar, M. – Husam, A. – Sangster, A. (2011): The diffusion of Activity-based costing: in Jordanian industrial companies. Qualitative Research in Accounting and Management 8(2): 180-200.
Neumann, B.R. – Roberts, M.L. – Cauvin, E. (2010): Information search using the balanced scorecard: what matters?. The Journal of Corporate Accounting & Finance 21(3): 61-66.
Northcott, D. – Smith, J. (2011): Management performance at the top: a balanced scorecard for boards of directors. Journal of Accounting & Organizational Change 7(1): 33-56.
Pike, R. – Tayles, M. – Manson, N. (2011): Activity-based costing user satisfaction and type of system: a research note. British Accounting Review 43(1): 65-72.
Schoute, M. (2011): The relationship between product diversity, usage of advanced manufacturing technologies and activity-based costing adoption. British Accounting
Review 43(2): 120-134.
Stout, D. – Propri, J. (2011): Implementing Time-Driven Activity-Based Costing at Medium-Sized Electronics Company. Management Accounting Quarterly 12(3): 1-11. Sundin, H. – Granlund, M. – Brown, D.A. (2010): Balancing multiple competing
objectives with a balanced scorecard. European Accounting Review 19(2): 203-246. Swenson, D. (1995): The Benefits of Activity-Based Cost Management to the
Manufacturing Industry. Journal of Management Accounting Research 7(1): 167-180. Tayler, W.B. (2010): The balanced scorecard as a strategy-evaluation tool: the effects of
implementation involvement and a causal-chain focus. The Accounting Review 85(3): 1095-1117.
Van Der Stede, W.A. – Young, S.M. – Chen, C.X. (2005): Assessing the quality of evidence in empirical management accounting research: the case of survey studies.
Accounting, Organizations and Society 30(7): 655-684.
Vila, M. – Costa, G. – Rovira, X. (2010): The creation and use of scorecards in tourism planning: a Spanish example. Tourism Management 31(2): 232-239.
Yang, H.L. – Yang, G.G.L. – Wei-Pang, W. (2006): Employee demography moderate involvement of decision making and adoption of management accounting innovations for Chinese accountants. Journal of American Academy of Business 9(2): 338-343.