A MULTI-SCENARIO ANALYSIS TO IMPROVE
LAYOUT EFFICIENCY
Simão Duarte Lobato
Project submitted as partial requirement for the conferral of Master’s in Management of Services and Technology
Supervisor:
Prof. Doctor Ana Lúcia Martins, Assistant Professor, ISCTE Business School, Department of Marketing, Operations and General Management
Co-supervisor:
Prof. Doctor Teresa Sofia Grilo, Assistant Professor, ISCTE Business School, Department of Marketing, Operations and General Management
A MUL
TI
-SCEN
A
R
IO
A
N
ALY
SIS TO
IMP
R
O
V
E
LAYOU
T
EFF
IC
IENC
Y
Simão
Du
arte L
ob
at
o
i
Acknowledgments
Throughout the whole project, I was lucky enough to have crucial support, which led me to the conclusions of this challenge.
For this reason, I would like to thank my supervisors, not only for their support in the literature review and in the entire structural organization of my work, but also the permanent readiness to clarify any technical doubts, offering me the right solutions to improve.
Secondly, I want to thank my friend Alexandre Alves for his help in proofreading, for all his advice and critical discussions, leading me to a greater reflection on the subjects under investigation.
The support of my co-worker Sandra Timóteo was extremely important for all clarification of questions and for the help in my adaptation phase to the industrial unit. For that, a very special thank you.
iii
Abstract
The ability to compete is paramount and efficiency, regardless of the organisations’ overall approach, is an issue companies continuously strive for. In every supply chain, the logistics costs represent a large portion of overall costs, and hence the warehousing costs. Although the storage of products by itself does not add value to the customer, it has an immediate impact on these operation costs.
Lauak Portugal is a partner factory of Groupe Lauak, a French group that owns a set of industrial companies supplying the aeronautical market. Aiming the layout costs reduction, it is inside its final products warehouse that this research is carried out.
Excluding inventory costs, the picking activity alone represents about 55% of the warehousing costs (Drury, 1998). Additionally, travelling during the picking activity is estimated to require about 50% of the time of the resources (Tompkins et al., 2010). Supported by this assumptions, 44 scenarios are analysed and compared, mixing storage assignment policies and alternative picking routes strategies.
Both qualitative and quantitative approaches are used in this research, based on data collected from interviews, observation, documentation and archival records. A case study approach is conducted following literature recommendations (Voss et al., 2002; Yin, 2018).
Findings showed that travelling distance can be reduced by about 64% when the class-based storage is used, following their picking frequency, along with a pre-selected picking route.
Key Words: Logistics, ABC Analysis, Picking, Warehousing, Storage Assignment JEL Classification System: M11; D24; L62; Y40
iv
Resumo
A capacidade de competir é primordial e a eficiência, independentemente da abordagem geral das organizações, é uma questão que as empresas continuamente se esforçam para atingir. Em todas as cadeias de abastecimento, os custos logísticos representam uma grande parte dos custos totais e, consequentemente, dos custos de armazenagem. Embora o armazenamento de produtos por si só não acrescente valor ao cliente, ele tem um impacto imediato sobre os custos de operação.
Lauak Portugal é uma fábrica parceira do Groupe Lauak, um grupo francês que possui um conjunto de empresas industriais que abastecem o mercado aeronáutico. Visando a redução dos custos de layout, é dentro do seu armazém de produtos finais que esta pesquisa é realizada.
Excluindo os custos de stock, a atividade de picking por si só representa cerca de 55% dos custos de armazenagem (Drury, 1998). Além disso, estima-se que as deslocações durante a atividade de picking represente cerca de 50% do tempo dos recursos (Tompkins et al., 2010). Com base nestas premissas, 44 cenários são analisados e comparados, misturando políticas de armazenamento e diversas rotas de picking.
Ambas as abordagens qualitativa e quantitativa são utilizadas nesta pesquisa, com base em dados recolhidos a partir de entrevistas, observação, documentação e registros de arquivos. Estas abordagens são conduzidas com base nas recomendações da literatura (Voss et al., 2002; Yin, 2018).
Os resultados mostraram que a distância percorrida pode ser reduzida em cerca de 64% quando a políticas de armazenamento “Class-Based” é utilizada, seguindo a frequência de picking, juntamente com uma rota de picking pré-definida.
Key Words: Logistics, ABC Analysis, Picking, Warehousing, Storage Assignment JEL Classification System: M11; D24; L62; Y40
v
Executive Summary
Competitiveness is paramount and efficiency, regardless of the company’s overall approach, is an issue companies continuously strive for. Although the storage of a product itself does not add value to the customer (Tompkins and Smith, 1998; Carvalho, 2018), it has an immediate impact on the warehouse operation costs (Tompkins and Smith, 1998; Rushton et al., 2017).
Warehousing costs are an essential key in the overall costs a company has to support and, not considering inventory costs, the picking itself represents about 55% of the warehousing costs (Drury, 1998). Additionally, travelling during the picking activity is a major cost in warehousing, and it requires about 50% of the time of the resources (Tompkins et al., 2010). Even small savings in this travelling time can have a generous impact in the costs of the operation.
Lauak Portugal is based in Setúbal, Portugal, and it is specialized in transforming metal sheets in single aircrafts components and outside structures. This aerospace environment was the selected one to be the study field of this research. Service quality and fulfilment of due dates to the customers are relevant in this industry. Although most products are developed jointly with the customers, the cost issue is a key aspect in maintaining the competitiveness of the plant itself within the group.
The purpose of this research is to improve the internal costs in its finished product warehouse, which is considered as critical for the plant, affecting directly the delivery process to the final customer and, hence, the competitiveness.
Based on three conditions developed by Yin (2018), the methodology adopted in this project complies with the guidance of a case study, and it is structured following the recommendations purposed by Voss et al. (2002) and Yin (2018). The project went through several steps:
1. Identification of the initial situation, which undertook both qualitative and quantitative approaches. Qualitative using interviews to the managers of the area and the plant to perceive the warehouse purpose and the overall organisation of the facility; and quantitative as to collect data concerning distances and volumes of activity inside the warehouse.
2. Generation of theoretical scenarios, based on the literature, resulting from (a) picking routes and (b) storage assignment (Hausman et al., 1976; Ratliff and
vi Rosenthal, 1983; Goetschalckx and Ratliff, 1988; Hall, 1993; Petersen and Aase, 2004; De Koster et al., 2007; Roodbergen et al., 2008; Chan and Chan, 2011; Çelk and Süral, 2014; Carvalho et al., 2018). 66 scenarios were initially considered ([(a)=22] * [(b)=3]), but only the ones suited for the company were analysed in depth (22 picking routes and 2 storage assignment);
3. Simulation to evaluate the efficiency of different scenarios, allowing the travelled distances comparison between each of them. Data collection was mostly conducted using direct observation and measurements, as the plant’s information system did not have that information systematised. Although time-consuming, this approach allowed for a better quality of data.
Findings showed that the picking routes did not have much impact on the distance travelled during the picking activity, when analysed in absolute values, which is contrary to findings from other researchers (see, for instance, Rushton et al., 2017). When the analysis is made considering relative values, the conclusions showed to be more surprising. The unexpected findings might result from the space constraints in some areas of the warehouse, as it does not follow a typical shape. The layout and the products’ organisation based on the families, on the other hand, showed to be a significant aspect in reducing travelling distance as they can reach savings between 38,45% and 46,25%, when the storage strategy is random, and above 64% when it is class-based.
Although this research was developed in a specific factory, the proposed methodology can be adapted so other companies, which desire to evaluate their internal policies, can find more efficient storage solutions.
vii
Index
Acknowledgments ... i Abstract ... iii Resumo ... iv Executive Summary ... v Index ... vii Figure Index ... xiTable Index ... xiii
1 Introduction ... 1 1.1 Problem Statement... 1 1.2 Research Question ... 2 1.3 Objectives ... 2 1.4 Methodology ... 3 1.5 Scope ... 3
1.6 Structure of the Project ... 3
2 Literature Review ... 5
2.1 Logistics Management... 5
2.2 Warehousing Management ... 8
2.2.1 Warehouse Typologies ... 9
2.2.2 Warehouse Operations ... 10
2.3 Picking and Storage Processes ... 14
2.3.1 Routing Policies ... 15
2.3.2 Storage Assignment ... 16
2.4 Conclusion ... 18
3 The Company: LAUAK Portugal ... 19
3.1 Warehouses ... 19
3.2 Warehouse Processes Description ... 21
4 Methodology ... 23
4.1 Methodology Approach ... 23
4.2 Case Study’s Stages ... 23
4.2.1 Step I – Characterizing the Current Operation in the Warehouse. ... 24
4.2.2 Step II – Defining a Set of Alternative Theoretical Scenarios ... 26
4.2.3 Step III – Assessing and Comparing Alternative Theoretical Scenarios. ... 28
4.2.4 Step IV – Presenting Recommendations for the Company. ... 28
viii
5.1 Defining a Set of Alternative Theoretical Scenarios ... 29
5.1.1 Data Details ... 29
5.1.2 Selected Theoretical Scenarios ... 31
5.2 Assessing and Comparing Alternative Theoretical Scenarios ... 31
5.2.1 Assessing Alternative Theoretical Scenarios ... 31
5.2.1.1 Picking Routes Application ... 32
5.2.1.2 ABC Analysis ... 34
5.2.2 Travelled Distances per Scenario - Random Storage Strategy (SA - 1) ... 39
5.2.3 Travelled Distances per Scenario - Class-Based Storage Strategy (SA - 2) ... 40
5.2.4 Global Comparison ... 41
5.3 Recommendations for the Company ... 44
6 Conclusion ... 45
7 References ... 47
8 Appendix ... 51
Appendix A – Unstructured Interviews Script ... 51
Appendix B – PR – 1 Representation ... 52 Appendix C – PR – 2 Representation ... 53 Appendix D – PR – 3 Representation ... 54 Appendix E – PR – 4 Representation ... 55 Appendix F – PR – 5 Representation ... 56 Appendix G – PR – 6 Representation ... 57 Appendix H – PR – 7 Representation ... 58 Appendix I – PR – 8 Representation ... 59 Appendix J – PR – 9 Representation ... 60 Appendix K – PR – 10 Representation ... 61 Appendix L – PR – 11 Representation ... 62 Appendix M – PR – 12 Representation ... 63 Appendix N – PR – 13 Representation ... 64 Appendix O – PR – 14 Representation ... 65 Appendix P – PR – 15 Representation ... 66 Appendix Q – PR – 16 Representation ... 67 Appendix R – PR – 17 Representation ... 68 Appendix S – PR – 18 Representation ... 69 Appendix T – PR – 19 Representation ... 70 Appendix U – PR – 20 Representation ... 71 Appendix V – PR – 21 Representation ... 72
ix
Appendix W - Distance Matrix ... 73
Appendix X – Available Volume per Shelf, in cm3 ... 74
Appendix Y – ABC Analysis: PFBE Family ... 76
Appendix Z – ABC Analysis: ESKU Family ... 87
Appendix AA – ABC Analysis: FAI Family ... 90
Appendix BB – Class-Based Reallocation: PFBE Family ... 93
Appendix CC – Class-Based Reallocation: ESKU Family ... 104
xi
Figure Index
Fig. 1 - Logistics Attributes (Adapted from Carvalho et al., 2018) ... 6
Fig. 2 - Flow-through (in the left) and U-Flow (in the right) Typologies (Adapted from Carvalho et al., 2018) ... 9
Fig. 3 - Typical Distribution of Warehouse Operating Expenses, Source: Adapted from Drury (1988) ... 14
Fig. 4 - Typical Distribution of an Order Picker’s Time, Source: Adapted from Tompkins et al. (2010) ... 14
Fig. 5 - Final Product Warehouse's Layout ... 20
Fig. 6 - Research Steps ... 23
xiii
Table Index
Table 1 - Logistics Activities (Adapted from Stock and Lambert, 2001) ... 7
Table 2 - Selected Picking Routes ... 27
Table 3 - Distances Matrix (Shelves: PFBE – A, PFBE – H, PFBE – I1, PFBE – I2, and PFBE – J) ... 29
Table 4 - Exemplification of Products Volume... 30
Table 5 - Types of Storage ... 30
Table 6 - Theoretical scenarios under study ... 31
Table 7 - A Picking list from the Scenario 0 ... 32
Table 8 - Application of the PR – 1 ... 33
Table 9 - ABC Classification ... 35
Table 10 - Family, Class, and Sub-Family Segregation ... 35
Table 11 – Products’ Reallocation ... 36
Table 12 - Travelled Distances per Scenario (SA – 1) ... 39
Table 13 - Travelled Distances per Scenario (SA – 2) ... 40
Table 14 - Picking Routes' Total Travelled Distance per Storage Assignment Strategy ... 42
1
1 Introduction
This first chapter will introduce a succinct view behind the project’s framework, that justifies the investigation relevance. The respective research question is then established, acting as a guideline to the project development. Afterwards, the main goal is highlighted, as well as the specific milestones required to reach that major objective. Right after that, the overall methodology adopted in this project is disclosed. The last two sub-chapters are intended for the scope of the project and its structure.
1.1 Problem Statement
Keeping a product stored for a certain period does not add any value to the final customer, which is something that has been gaining companies’ attention over time (Tompkins and Smith, 1998; Carvalho et al., 2018). For this reason, and because warehouses might be a competitive factor in many supply chains, companies began to care about that activity which has an immediate impact on their costs (Tompkins and Smith, 1998; Rushton et al., 2010). Since then, managers all over the globe decided to put some effort in making warehouse’s internal processes more efficient, once they are expensive and should be aligned with the whole supply chain’s strategy (Rushton et al., 2010).
This research focuses on a company – Lauak Portugal – a partner plant of an aerospace metallurgic French group: Groupe Lauak. Having plants in many different countries, the group plants compete among themselves for company contracts. Service quality and fulfilment of due dates to customers are relevant in this industry. Although most products are developed jointly with the customers, the cost issue is a pertinent aspect for maintaining the competitiveness of the plant within the group. It is thus essential to continuously monitor costs while looking for strategies that allow reducing them. Warehousing costs, and particularly picking-related costs, play a vital role in this search.
In accordance with Tompkins and Smith (1998), Bowersox et al. (2002), Rushton
et al. (2010), Bartholdi and Hackman (2017) and Carvalho et al. (2018), a traditional
warehouse has 4 main activities: receiving, storage, picking, and shipping. The company considers that the activity that has the highest impact on the internal warehousing processes is the picking activity. In fact, Drury (1988) showed that, excluding inventory costs, the picking activity alone represents about 55% of the warehousing costs. In
2 addition, among all the company’s warehouses, the picking in the final product warehouse emerged as one of the critical processes inside this plant. The fact that the company does not have any pre-selected picking policy or storage assignment strategy, these warehousing processes are delaying all sales and shipping procedures upstream.
Other research, this time conducted by Tompkins et al. (2010), stated that travelling between and across aisles, searching for product’s location during the picking, represents 50% of the total time spent inside a warehouse. Based on this statistic, and after discussing it with the company, it was decided to propose a solution that would reduce the travelled distances inside the warehouse, being this variable considered as the criterion of analysis.
Considering these assumptions, the purpose of this research is to improve the warehousing costs, contributing to its competitiveness inside the group, by analysing, simulating, and improving the picking process.
1.2 Research Question
The research question by which the project is being guided for is: “How to improve the picking processes efficiency in the final product warehouse of Lauak?”
1.3 Objectives
This project aims the assessment of picking policies to reduce warehousing costs. For that, there are some specific milestones that need to be accomplished. The first one is to map the warehouse’s internal processes, in order to understand the internal dynamic. After that, and to study the routes pickers take inside the warehouse, its measurements are critical to the analysis. Thus, it is needed to collect the distances across and between aisle and shelves. Then, after the picking routes’ selection, several alternative theoretical scenarios are developed and simulated.
Being this said, the milestones of this project are:
• To map the warehouse internal processes; • To measure the warehouse distances;
3 • To compare the current situation with the developed scenarios;
•
To present final recommendations for the company.1.4 Methodology
This research is based on a case study approach (Voss et al., 2002; Yin, 2018), and involves several consecutive research steps:
1. Step I – Characterizing the Current Operation in the Warehouse; 2. Step II – Defining a Set of Alternative Theoretical Scenarios;
3. Step III – Assessing and Comparing Alternative Theoretical Scenarios; 4. Step IV – Presenting Recommendations for the Company;
1.5 Scope
Lauak Portugal owns four warehouses: two for raw material (thin and thick), one for work-in-process and one for the final product. The company considered that the picking process in the final product’s warehouse is consuming an excessive amount of time and, for this reason, this project is focused in this specific warehouse.
1.6 Structure of the Project
This project is structured as follows:
Chapter 1 – Introduction: The project’s introduction, where the major objective, respective milestones, research question, methodology, scope and structure are briefly presented.
Chapter 2 – Literature Review: Acting as the theoretical support to the project, this chapter will develop the concepts, techniques, and strategies which previous investigations and international literature have published related to logistics, warehousing management, picking routes, and storage strategies.
4 Chapter 3 - The Company: LAUAK Portugal: This chapter will be used to present the company, contextualizing its activity and describing the warehouse’s current situation, where its internal processes, strategies adopted, and ways of work are identified.
Chapter 4 – Methodology: With the theoretical background analysed in chapter 2, the choices made on this project are going to be justified in the methodology phase, as well as the steps that need to be taken in order to achieve the major goal.
Chapter 5 – Case Study: In the Case Study’s chapter, the analysis is then detailed. The methods behind the travelled distances’ calculations are going to be explained, as well as how the products reallocation was performed. This chapter finishes with the results’ assessment, followed by the improvements suggestions.
Chapter 6 – Conclusion: The conclusions are finally presented, attempting the reflection about the developments, results, limitations, and further work.
5
2 Literature Review
The purpose of this chapter is to present the theoretical background that will support the project. This will lead to a literature review over the approaches and tools adopted by the researchers in their previous studies, to address similar challenges.
Recognizing warehouse management as the scope of this project, the logistics’ concept will be first developed. Then, warehouse internal operations are clarified, describing the different features related to this project, detailing the adopted layout design.
2.1 Logistics Management
It is not easy to define Logistics because it depends on the environment where it lies in. However, a definition adopted by some authors (Stock and Lambert, 2001; Rushton et al., 2010; Carvalho et al., 2018), belongs to the Council of Supply Chain Management Professionals (CSCMP, 2013: 117), which defined Logistics as:
“The process of planning, implementing, and controlling procedures for the efficient and effective transportation and storage of goods including services, and related information from the point of origin to the point of consumption for the purpose of conforming to customer requirements.”
Rushton et al. (2010: 4) defined this concept as “a diverse and dynamic function that has to be flexible and has to change according to the various constraints and demands imposed upon it and with respect to the environment in which it works.”
Another perspective, this time suggested by Bowersox et al. (2002) is that Logistics is a supply chain process that combines internal and external activities creating and moving value downstream to satisfy customer requests.
Lastly, Christopher (2016: 2) defines Logistics as “the process of strategically managing the procurement, movement, and storage of materials, parts and finished inventory through the organization and marketing channels.”
All these previous perspectives may seem complex, but it is possible to make them simpler to understand when logistics’ main purpose is clarified. According to Carvalho
6
et al. (2018), logistics aims to offer the highest possible level of customer service, while
attempts to decrease lead time response and service costs. Christopher (2016), based on Ohmae (1982), presented his view over this problem, saying that, in order to achieve competitive advantage, it is crucial that companies focus themselves on “The strategic three C’s”: Company, Customer and Competitors. This advantage will rise if companies are able to adapt themselves to the market, differentiating from the competitors, always trying to offer what customer is willing to pay for (Christopher, 2016). After establishing that, companies must ask themselves three questions, to make sure the strategy is going into the right direction: (1) are the market segment and customer requirements well defined; (2) are the internal processes correctly structured to answer to those customer needs; and (3) do competitors have better operational conditions, making possible to reach the desired competitive advantage (Ohmae, 1983).
Carvalho et al. (2018) supported Christopher (2016) meaning that the logistics concept’s complexity may decrease when companies fully understand the three “Logistics Attributes” (Fig. 1). In order to decide which strategy should companies follow, the balance between the Time, Cost, and Service Quality must be as much accurate as possible, being designated as “Trade-offs”.
Fig. 1 - Logistics Attributes (Adapted from Carvalho et al., 2018)
The upper attribute represents the amount of time logistics service is performed, depending on how long the customers are willing to wait for a service/good. The cost is related with the system efficiency, meaning that the cheaper a company can make its process, the more efficient the logistic process is. The same is for the service quality: the better the service provided, the more valuable the process becomes.
Depending on the service/good it is being provided/sold, each vertex has its own relevance. It is impossible to offer the three attributes at the same time, but all of them need to be (somehow) incorporated in the strategy. For this reason, companies need to
Time
Cost Service
7 assess the system and decide which attribute the client values most, in order to choose where the focus should be.
Depending on the researcher, literature can identify several logistics activities that help companies serving the final customer in the shortest possible time, aiming the lowest possible cost, at the best service quality.
Coyle et al. (1992) mentioned the transportation, packaging, materials handling, order processing, and forecasting as the main logistics activities companies should consider. Inventory and warehouse management, facilities network and information/communication control are later added to the list by Bowersox et al. (2002) and Rushton et al. (2010). Stock and Lambert (2001) and Carvalho et al. (2018) also stated other two logistics activities: procurement and reverse logistics; and production planning and client service, respectively.
It is possible to group these activities into distinct categories. Carvalho (1996) suggested five categories: Facilities Management, Inventory Management, Communication, Material Handling, and Transportation. Stock and Lambert (2001) clustered them as it is shown in Table 1.
Table 1 - Logistics Activities (Adapted from Stock and Lambert, 2001)
Activities Description
Transportation Physical movement or flow of goods across the supply chain and between players.
Packaging Protect the product from damages during storage and transportation stages.
Materials Handling Control the movements of raw materials, in-process inventory, and finished goods between storage areas, and from production last stage to the logistics first stage.
Order Processing Necessary actions considered to ensure production flow continuity, performed after customer request.
Warehousing Activities assigned to manage the warehouse space required to store the inventory.
Communication Being considered as the “vital link between the entire logistics process”, communication guarantees the equal information sharing across the supply chain, without being at the same place.
8 Among these 6 logistics activities, warehousing management is going to be developed in the next section, detailing the typologies and the main operations performed inside the warehouses.
2.2 Warehousing Management
Warehousing activity is responsible for the storage of all types of goods (raw materials, parts, goods-in-process, finished goods), simplifying their movement from the very first supplier to the player the product is being produced for (Vonderembse and White, 1996; Stock and Lambert, 2001; Rushton et al., 2010).
This logistics activity, in most of the cases, does not add any value to the final customer by itself, despite being essential to the whole chain (Tompkins and Smith, 1998; Christopher, 2016; Carvalho et al., 2018). As Ballou mentions (2004: 470), “storage become an economic convenience rather than a necessity”. Warehousing activities help companies managing their gap between supply and demand, decreasing supply chain vulnerability and decoupling demand from production capabilities (Ballou, 2004; Rushton et al., 2010; Bartholdi and Hackman, 2017; Carvalho et al., 2018). Once production and consumption occur in different places, the closer the product is to the final customer, the better (Carvalho et al., 2018). In some cases (e.g. wines, cheeses), products need a holding stage to be completed, a place where they can be kept during the transformation phase. The warehouse appears in this scenario as that place that holds the products, adding in this case valued attributes to the products (Ballou, 2004). Based on this, inventory is seen, not only as a company asset, but also as a dangerous variable expense that requires an effective control system in order to lead to success (Coyle et al., 2012).
Among the literature, there are several reasons that justify the fact that companies have stock held in their warehouses. Some authors defended that stock should be held so it will be possible to achieve economies of scale, by producing-to-stock, always keeping the production line supplied, and getting quantity discounts through high volumes of bought products (Coyle et al. 1992; Vonderembse and White, 1996; Stock and Lambert, 2001; Ballou, 2004; Rushton et al., 2010; Coyle et al., 2012). Safety stock is also mentioned as a reason that justifies holding stock, since it helps minimizing supply or demand uncertainties and avoiding stock-outs (Coyle et al., 1992; Vonderembse and White, 1996; Rushton et al., 2010; Coyle et al., 2012). Stock can be also used to place the products
9 closer to the final customer, absorbing demand oscillations and, consequently, better quality service (Vonderembse and White, 1996; Stock and Lambert, 2001; Ballou, 2004). Holding stock is considered an advantage when it is used to support the production line, when the production lead time is longer than the client order lead time, and to prevent the seasonal effect that some companies may have (Coyle et al., 1992; Rushton et al, 2010; Coyle et al., 2012).
It does not matter how the products are stored, or the reason why companies do it, but once the products are stored, they need to be handled carefully, always attempting to minimize the internal costs.
2.2.1 Warehouse Typologies
When it is time to choose which layout a company should implement, it is important to remember that it must be planned to minimize the travel distance and facilitating internal flows (Bowersox et al., 2002; Carvalho et al., 2018).
The layout typology can be classified based on the products flow inside a warehouse, in which the two most used are Directional or Flow-through and Broken or U-flow (Carvalho, 1996) (see Fig. 2). If the receiving and shipping areas are located on opposite sides, products follow a directional or flow-through configuration. The other classification is when receiving and shipping areas are adjacent to each other, making the products go in and out on the same side of the warehouse (Rushton et al., 2010; Bartholdi and Hackman, 2017; Carvalho et al., 2018). Companies also have other options, such as the L-flow in which the receiving and shipping area are not located side by side, neither in opposite sides, or a mixture between these three typologies (Rushton et al., 2010).
Fig. 2 - Flow-through (in the left) and U-Flow (in the right) Typologies (Adapted from Carvalho et al., 2018)
10 Concerning flow-through, managers can take some advantage by using this typology because it reduces the travelling time inside the warehouse, as well decreases the traffic and internal congestion because the receiving and shipping area are on opposite sides (Carvalho, 1996; Carvalho et al., 2018). When a company decides to adopt the U-flow, average travelled distance is reduced, the space allocated to the reception and shipping areas decreases (since it is at the same place), and it is indicated for a better storage allocation (Carvalho, 1996; Carvalho et al., 2018).
No matter which layout typology a company implements, all warehouses have the same overall main internal functions. The following subchapter presents and describes each of them.
2.2.2 Warehouse Operations
Each warehouse has its own internal activities. However, all of them have the same four main functions (Tompkins and Smith, 1998; Bowersox et al., 2002; Rushton
et al., 2010; Bartholdi and Hackman, 2017; Carvalho et al., 2018): Receiving the product
from a certain source; Storage them until the moment they are needed; at that time,
Picking them to satisfy an order and Shipping the products to the user that requested them.
• Receiving
Associated to this function, it is the confirmation process. Every time a warehouse receives a product to store, picker needs to confirm that everything is in accordance with the agreed. Carvalho et al. (2018) referred that reception and checking may consist in seven steps: planning the receptions orders, the arrival of the vehicle, unloading process, checking its cargo, palletizing it (depending on the product characteristics), stablishing a storage location and update the stock in the system.
• Storage
After assigning a location to the new product, it is time to store it. According to Hausman et al. (1976), there are three ways to do it: first, attributing a fixed/dedicated location to each product, and it can only be stored in that place; second, every product is
11 randomly stored in empty places during the reception period, leading to a higher average travel time (Glock and Grosse, 2012); and lastly, class-based location, characterized by different storage zones, where each product has a single associated area, yet randomly stored inside it. These three storage techniques will be further developed in sub-chapter 2.3.2.
Regardless of the technique implemented, companies still have to choose between several storage system options. According to Carvalho et al. (2018), these systems can be divided into manual and automatic. In terms of manual options, it is possible to find the conventional rack, in which the palletized products are stored on regular shelves, allowing the unitary and direct access to each reference. This system is indicated for warehouses that have a big amount of references. Another option is Drive-in/through rack, which also stores palletized products, yet with far fewer references to store, attempting to equalize the number of shelves with the references. Cantilever rack is a structure that holds bulky cargos which are difficult to store on regular shelves due to the products’ shape. The last manual system is the gravitational rack. This time, the references are stored at one end and, through gravitational force and a rolling platform, they slide to the opposite end.
In the automatic storage systems, it is possible to identify the vertical and horizontal carousels and the self-supporting warehouses. The first one (sometimes called as Kardex), is a vertical or horizontal structure that makes the references come to a single point by the shelves’ movement. It is indicated for references with small dimensions. Self-supporting warehouse works as a Kardex but for bigger references. Contrary to the previous, the whole infrastructure where the warehouse is in, is only used for this purpose. The entire storage mechanism is automatic where the cargo is moved aided by elevators computer controlled and not by the shelves’ movement as the Kardex. This type of system is usually used for references with big dimensions.
• Picking
After the product being stored, it is ready to be picked. An order request is issued by the customer and all the service process begins. Hall (1993: 76) defined picking as the one “which items are retrieved from stocking locations in a warehouse.” Besides that, Carvalho et al. (2018: 308) says that picking activity has a direct impact in the logistics triangle in which “the faster the picking, the quicker the customer delivery (Time); the
12 more efficient the picking, the lower the cost to the customer (Cost); and the more effective the picking (without errors), the higher the service quality”.
Tompkins and Smith (1998) argued that order picking is considered, by warehouse professionals, as the most critical function in their distribution operations. For this reason, the strategy adopted needs to be carefully designed. Depending on that choice, picking can be performed in four different ways (Van den Berg and Zijm, 1999; Tompkins and Smith, 1998; Ballou, 2004; Rushton et al., 2010; Carvalho et al., 2018).
1. Picking by Order – Guided by an order list, picker has the responsibility to collect every item from it. Orders are not mixed in the same list.
2. Picking by Line – In this method, picker collects the quantity to satisfy several orders at the same time, from each location.
3. Zone Picking – Warehouses are divided into areas and the picker collects all the items stored per zone, changing after collecting all the products from that zone. 4. Batch Picking – A few numbers of orders are assigned to one single picker, who
is responsible for collecting all the products from these order lists. The procedure is repeated after finishing the current lists.
Picking by order is more appropriate when each order has many lines to pick (Carvalho et al., 2018). Although it is the simplest picking strategy when the picking is paper-based, this method offers to the companies the solution with the lower probability of error. However, the productivity is the lowest one, due to the time picker needs to complete an order (Tompkins and Smith, 1998; Carvalho et al., 2018). When the performance is analysed per client, this method provides the quicker response, even though it is considered the one that spends the most time travelling (Tompkins and Smith, 1998; Rushton et al., 2010).
When companies decide to use picking by line, the number of picking errors will increase, maintaining productivity levels high (Carvalho et al., 2018). According to the same authors, this method requires some special attention when is being performed because products need to be separated for all the orders, after the collection. For that reason, it is the advisable method when companies have few lines to pick (Carvalho et
al., 2018).
Resembling picking by order, is zone picking. It is most likely to be used when companies operate different systems and equipment inside the same warehouse
13 (Tompkins and Smith, 1998; Carvalho et al., 2018), when the orders are usually too big for a single picker (Rushton et al., 2010), or if there is any justification for the physical storage segregation (Rushton et al., 2010). Thus, if companies implement zone picking, pickers are allocated to a specific system, increasing the number of picking errors, towards picking by line, yet showing higher productivity, but with a lower number of errors when compared to picking by order (Carvalho et al., 2018).
The same way zone picking is for picking by order, batch picking is for picking by line (Carvalho et al., 2018). The difference between these last two types is the number of orders picked at once. Whereas picking by line collects every product from the list, in the batch picking mode picker should only select one to four lines to pick at once (Carvalho et al., 2018; Tompkins and Smith, 1998). If companies decide to select this method, the error margin will decrease, since each picker is dealing with a small number of lines (Carvalho et al., 2018). Thus, “the higher the number of orders in each group, the greater the productivity, but also the greater the possibility of error” (Carvalho et al, 2018: pp. 310). Rushton et al. (2010) argued that companies can benefit in terms of travelling time with this method.
In order to select the best picking strategy, companies must consider some factors that have influence on the picking performance. According to Rushton et al. (2010), the product range, the order size, and the equipment used by the picker to collect them are examples of these factors.
• Shipping
In order to finish the warehouse activities, after picking all orders, they need to be properly prepared and marshalled, to be ready for expedition. Knowing that each product has its own packaging requirements, they are packed and put in line in the waiting area, waiting for the arrival of the mean of transportation.
According to De Koster and Van der Poort (1998), Van den Berg and Zijm (1999), De Koster et al. (2007) and Tompkins et al. (2010), Drury (1988) concluded that about 55% of the total costs inside a warehouse is associated to the picking process. The same research allocated 10% and 15% of the warehousing costs to the Receiving and Storage processes, respectively, and 20% to the Shipping processes. This information is
14 useful to understand the impact that Picking has on the warehouse costs, meaning that a small improvement can lead to changes of great value.
A few years later, Tompkins et al. (2010) uncovered the time proportion associated to each picking activity. They concluded that 10% is assigned to setup the order list, 20% searching the products, and 15% to pick them, whereas 50% of the time is used to travel between shelves and across aisles. Bartholdi and Hackman (2017) reinforce this discrepancy saying that travel is pure waste, increasing labour costs and adding no value to the process. Charts in the Figs. 3 and 4 show these studies’ conclusions.
Based on these conclusions, even if a small improvement is implemented, the impact will be felt due to the high representativity of the picking process in the total costs (55%). Moreover, the investigation conducted by Tompkins et al. (2010) allowed to identify the key picking related task that should be improved so as to reduce the time spent in the global picking process.
This project moves on describing the picking process, detailing picking route policies and storage assignment strategies most used by companies.
2.3 Picking and Storage Processes
In order to control this sensitive activity, companies usually use picking routes policies and storage product strategies (De Koster et al., 2007; Roodbergen et al., 2008; Çelk and Süral, 2014).
20% 55% 15% 10% Shipping Picking Storage Receiving 5% 10% 15% 20% 50% Other Setup Pick Search Travel
Fig. 3 - Typical Distribution of Warehouse Operating Expenses, Source: Adapted from Drury (1988)
Fig. 4 - Typical Distribution of an Order Picker’s Time, Source: Adapted from Tompkins et al. (2010)
15
2.3.1 Routing Policies
According to Hall (1993), Traversal, Mid-Point and Largest Gap Return Strategy are described as the three basic routes used inside a warehouse:
• Traversal Strategy – In this method, the picker enters at one side of the aisle, crossing it, and exits on the opposite side.
• Mid-Point Strategy – Here, the picker enters on an aisle and picks all the products from one side until the exact middle point. When the picker reaches that point, s/he returns, picking the other side of the aisle, exiting from the same side s/he entered.
• Largest Gap Return Strategy – This happens when picker enters and exits on the same entry point, but the return point is not the exact middle point.
When these basic routes are individually compared, Hall (1993) describes the traversal strategy as the simplest strategy, due to its ease with which the route is drawn. In addition, Goetschalckx and Ratliff (1988) argued that it is significantly better to use traversal policy in every aisle, rather than the return (or mid-point, in Hall’s language) strategy. Manzini et al. (2007) studied the impact of several variables on the picking cycle time and concluded that the return (or mid-point, in Hall’s language) is the best strategy when it comes to a quadratic warehouse, and traversal when a company operates in a rectangular one.
Companies might have some issues in trying to find the best route for their order pickings. However, De Koster and Van Der Poort (1998) and Roodbergen and De Koster (2001a) argued that this problem may be simply solved by using a heuristic, known as S-shape. It consists in moving across aisles in S-shape curves, while products are being picked (De Koster and Van Der Poort, 1998; Roodbergen & De Koster, 2001a). It is basically a traversal strategy, where the picker does not need to cross an aisle if there is no picking to do (De Koster et al., 2007; Çelk and Süral, 2014).
This procedure can be used by some companies due to its simplicity, but the real savings arise when companies select an optimal algorithm as a picking method (De Koster and Van der Poort, 1998). For that, according to Goetschalckx and Ratliff (1988), Jarvis and McDowell (1991), Cormier and Gunn (1992), Roodbergen and De Koster (2001b)
16 and Bartholdi and Hackman (2017), Ratliff and Rosenthal (1983) have suggested a solution that minimizes distance and/or time travelled inside a warehouse.
In accordance with Ratliff and Rosenthal (1983), the procedure to construct the algorithm is as follows: guided by the order list, the first step is to select the closest shelf to the entry point, with this representing the beginning of the route. After picking that product, a second shelf must be chosen. This shelf should be the one closest to the shelf that was initially selected. The order picker should follow this procedure until the order list is completed.
2.3.2 Storage Assignment
After receiving the products from the suppliers (or from the plant itself), there is “a set of rules which can be used to assign products to storage locations” (De Koster et
al., 2007: 488). This process is mentioned as “Storage Assignment” in the literature in
the area.
Yet there are several different ways to associate a location to a reference, literature identifies three basic types (Hausman et al., 1976; Petersen and Aase, 2004; De Koster et al, 2007; Chan and Chan, 2011; Carvalho et al., 2018):
• Randomly Storage – References are stored in any available space where the product can fit at the storage moment.
• Fixed or Dedicated – An exact location is associated to the references, and they have their own location and cannot be stored in any other.
• Class-based Location – Being a mixture of random and fixed storage, the warehouse is divided into zones/areas and each product is associated with one single zone/area and cannot be stored in any other location. Inside each area, products are randomly stored, depending on the available space.
Even though it is considered as the most used due to its simplicity, Random Storage approach depends on a computer to control the operation, once a product’s location changes every time it is stored (De Koster et al, 2007; Carvalho et al., 2018). Besides that, in order not to lose the track of the products, the computer system needs to be constantly updated (Carvalho et al., 2018). With this storage assignment, picker needs to travel a greater distance to do the same picking list (Stock and Lambert, 2001; Carvalho
17
et al., 2018) if products have different rotation levels. On the other hand, the space
utilization is more efficient due to the possibility to use any available space in the warehouse (Stock and Lambert, 2001; Carvalho et al., 2018).
When products have a fixed location, the major disadvantage, contrary to the random, is the low utilization of space, once companies must keep the space available for the products’ maximum stock, even when the product is out of stock (De Koster et al, 2007; Carvalho et al., 2018). However, companies do not need to worry about increasing the warehouse dimensions because they were designed to store every reference, at its maximum stock level (Carvalho et al., 2018). Another advantage is the fact that order pickers, after repeating the process repeatedly, they begin to know where the references are stored, making the search procedures easier (De Koster et al, 2007).
Finally, class-based location appeared to try to combine the advantages of the two previous methods (Chan and Chan, 2011; Carvalho et al., 2018). Rao and Adil (2013) argued that this method may increase the warehouse’s performance up to 40%, when compared to the random storage. Nevertheless, the distances travelled can also be reduced in this method, since the products with greater turnover are stored closer to the entry point, making the most frequent trips shorter (Chan and Chan, 2011).
Based on Pareto’s research, about wealth issues around the world (Carvalho, 1996; Tompkins and Smith, 1998), ABC analysis purposes a storage solution, by dividing the products into three distinct classes – A, B, and C. The first one, considered as the most sensitive, owns 20% of the total products, representing 80% of the total sales, operational cost, volume, picking frequency or other characteristic, depending on the criterion selected as the most relevant for such classification. Since these products are very valuable when compared to the others, their location inside the warehouse must be at the nearest aisle to the entry point. Thus, the picker collects value products as close as possible from the entry point, decreasing the travelled distance, caused by the high picking frequency. Group B is responsible for 30% of the total products, representing 15% of the chosen criterion. Due to their medium relevance, products within this group should be stored in the middle of the warehouse, right after the group A. Behind them, the area is reserved for group C (not that relevant products), which holds the remaining 50% of the total products, assuming 5% of the criterion (Jarvis and McDowell, 1991; Carvalho, 1996; Vonderembse and White, 1996; Tompkins and Smith, 1998; Stock and
18 Lambert, 2001; Rushton et al., 2010; Bartholdi and Hackman, 2017; Carvalho et al., 2018).
The criteria to segregate the products into these three categories varies according to the main goal of the analysis. Whereas Onwubolu and Dube (2006) have chosen operational costs, Balaji and Kumar (2014) refer weight and product shape, Vonderembse and White (1996) use annual dollar usage value, Carvalho (1996) and Dutta et al. (2017) considered annual revenue, whereas Carvalho et al. (2018) and Bartholdi and Hackman (2017) did the analysis using the sales volume as the main criterion to segregate the products.
2.4 Conclusion
This previous chapter allowed (1) to define and develop the theoretical concepts in a general way, clarifying the basis warehousing management; and (2) the selection of the best practices that the literature recognizes as the most indicated when it comes to improving routes during the picking process.
Managers have been striving for finding the best route inside the warehouse during the picking process a couple of decades. For this reason, it is possible to conclude that all the studies done so far have created the needed theoretical basis to guide this project in the right direction.
Literature review allowed the perception that the picking processes may have a huge impact on warehousing costs. However, there is also several ways to improve them, making them more efficient.
By simulating several scenarios, combining picking routes along with storage allocations, this project attempts to study the impact of these alternative scenarios in the total travelling distance in the picking process.
19
3 The Company: LAUAK Portugal
Groupe LAUAK is a French group that owns a set of industrial companies which supplies the aeronautical market. Having begun its activity in 1975 by producing small sheet metal parts in France, it has been expanding their business through assembly of heat exchanges, fuel tanks and aircraft structures over 25 years. Nowadays, the group owns 7 plants over France, Portugal, Mexico and Canada, employing about 1500 people.
In 2003, the group opened a plant in Portugal responsible for transforming metal sheet in a wide range of aircraft components. Apart from these individual parts, LAUAK Portugal is also specialized in assembling structures for a specific range of aircrafts. Among them are Fuel Tanks (for Dassault F7X, T3 and T4 Falcon 900), Cockpit Layout (for Airbus A320 and A350), and Cargo Door Frame (for Airbus A320), either for domestic or foreign customers. On this list are Airbus, Embraer, Ogma, Dassault, Daher, and Liebherr. Counting with more than 650 employees working in this plant, LAUAK Portugal is accredited by ISO 9001, 9100 and 14001, and by Nadcap in the fields of surface treatment, non-destructive quality controls, heat treatment, and welding processes.
The next two subchapters describe the final product warehouse's layout under investigation and the respective internal processes.
3.1 Warehouses
LAUAK Portugal owns four warehouses: two for raw material (thin and thick), one for work-in-process and another for the final products. The final product warehouse was selected for analysis in this project because the company considered that the picking process was taking longer than desired, delaying all sales and transportation procedures downstream. It only stores small aircraft components, ready to be sent to the final customers.
This warehouse, with almost 100 square meters (12,78 x 7,62 meters), has three horizontal aisles (hereafter referred to as A1 [Bottom Aisle], A2 [Middle Aisle], and A3 [Top Aisle]), and it is disposed in 44 shelves. It follows a U-flow configuration, being divided into three product families:
20 • FAI: prototypes waiting for quality approval to be shipped to the customer; • ESKU: products belonging to a partner factory of the group;
• PFBE: finished products, owned by LAUAK Portugal, being considered the most relevant family inside this warehouse.
The warehouse layout, designed in centimetres, is represented in figure 5.
Fig. 5 - Final Product Warehouse's Layout
A2 [Midd le A isl e] A3 [ Top A isl e] A1 [ B o tt om Ais le]
21
3.2 Warehouse Processes Description
Finishing the manufacturing processes, all the products pass through a final quality control phase. After being declared as suitable for selling, they are moved to the following section – Sales. There, if a sales order had been already issued, the products are sold and continue to the packaging section, going straight to the shipping waiting area, right after that. Otherwise, after the selling and packaging activities, they need to be stored until a selling order is issued.
When the products need to wait for a new selling order, it is assigned a family section (FAI, ESKU, or PFBE) so they can be stored in the right place. Regardless on the product family, products are randomly stored on the shelves that are dedicated to its particular family. There are different boxes on the shelves to accommodate small and medium size products. Large items are freely placed on the shelves itself.
Picker generates everyday an order list containing the products that have an issued order request. This list is structured according to the delivery date, which means that the first product that appears on the list is the product that needs to be delivered first. Random is the storage assignment adopted by the company and there is no picking route pre-stablished.
23
4 Methodology
It is intended with this chapter the presentation and description of the project’s methodology. Beginning with the methodology approach selected, the steps taken to reach the main goal are then clarified and justified.
4.1 Methodology Approach
According to Yin (2018), three conditions must be verified to characterize a research method as a case study. According to this author, researchers should use a case study’s methodology when:
1. A “how” or “why” question is answered;
2. The event under investigation cannot be manipulated by the researcher; 3. The research must attempt to solve a contemporary and real-life problem;
Based on these three conditions, the methodology adopted in this project complies with the guidance of a case study, and it is structured following the recommendations purposed by Voss et al. (2002) and Yin (2018).
Yin (2018) argues that a case study can be used for three purposes: exploratory, descriptive, or explanatory studies. Once this project describes a real-world context phenomenon and can be used in other investigations to study similar problems, the purpose of this project is exploratory and descriptive. Besides that, this study can be classified as a single case due to the fact that the environment under investigation only represents one business situation, not taking into account other companies’ influences.
4.2 Case Study’s Stages
This project was developed following several consecutive research steps, as mentioned in Figure 6.
Fig. 6 - Research Steps
Step I Characterizing the Current Operation in the Warehouse. Step II Defining a set of alternative theoretical Scenarios. Step III Assessing and Comparing Alternative Theoretical Scenarios. Step IV Presenting Recommendations
24
4.2.1 Step I – Characterizing the Current Operation in the Warehouse.
Characterizing the current operation in the LAUAK’s final products warehouse requires the use of several sources of information. Particularly, four sources were used to ensure the detailed and accurate data collection of both qualitative and quantitative information (Yin, 2018): documentation, archival records, informal interviews, and direct and participant observation.
Qualitative Data
To collect qualitative data, one crucial source in a case study environment are unstructured interviews (Yin, 2018). Different company’s employees, in different hierarchical roles, were selected to ensure the information veracity, enabling the full understanding of the internal processes (Voss et al., 2002). The Head of Logistics, the Warehouse Picker, and the Warehouse Manager were the main stakeholder in this data collecting process. Direct observation and official documents were other sources used in the qualitative data collection.
To start this data collection process, it was created a script (Appendix A), acting as a supportive tool to the unstructured interviews.
The project’s specifications were initially explained by the Head of Logistics, as well as all the requirements and desired milestones. Afterwards, a visit to the factory was also carried out, where it was possible to superficially understand the processes of the whole plant and visualize the respective connection and flows between them.
Following this first contact with the company, the warehouse process description was presented by the picker. Aiming at achieving a detailed mapping of the process, informal questions related to the daily tasks have been asked, such as the way other sections interact with the final product warehouse and the tasks’ sequence performed on a daily basis. Other subject addressed in the interview, and very important to the analysis, was the layout adopted by the company for both the warehouse itself and the shelfs’ sequential order.
The warehouse manager was also interviewed, this time attempting to clarify more specific points. For a better understanding of the company strategy, questions concerning the warehouse improvements, implemented over the past years, were also asked. The
25 warehouse manager explained the storage assignment strategy used by the company, mentioning restrictions that might exist.
At a higher decision level, the Head of Logistics was interviewed once again, this time to understand tactical choices the company had made. The objective was to clarify the reason why the company was using the random storage strategy and a non-defined picking route.
Content reliability and validation can be increased when multiple sources are used to investigate the same environment, being this designated as Triangulation (Eisenhardt, 1989; Voss et al., 2002; Yin, 2018). Thus, after concluding this methodological stage, it was decided to see in the field, by direct observation, what had been addressed in the interviews (Yin, 2018). At the same time the picker was being interviewed, movements of products inside the warehouse were followed daily for one and a half weeks. The storage and picking processes were meticulously monitoring to guarantee that all the required information to characterize the internal processes had been collected.
Thought participant-observation (Yin, 2018), storage and picking activities were performed, in their totality, during three days for a better understanding and to ensure the information validation.
Quantitative Data
To gather the quantitative data, it was used other three different sources (Yin, 2018): archival records, direct and participant observation.
Once it is attempted to decrease the travelled distance inside the warehouse during the picking process, the distances between and across aisles and shelves needed to be measured. As no information existed concerning these distances, the warehouse was measured using participant-observation. This action also allowed the creation of the warehouse’s layout representation (Fig. 5).
After knowing these measures, picking routes calculations could be initiated. Picker’s performance was tracked through direct-observation for one month, being considered the reference scenario in this analysis (hereafter referred to as Scenario 0). It is considered in this scenario the current daily operations in the warehouse, either for picking route or storage assignment.
This period, September to be exact, was considered by the company a standard month, representing the overall operations over the year. During this period, every picked
26 item, as well the respective movements to reach them, were closely followed and registered.
Another data needed in this analysis are the products and shelves’ volumes and the daily stock. As the company did not have any information concerning the products and shelves’ volumes, the data was collected in the field by participant-observation, in the field. To calculate the product average stock, a monthly basis analysis was carried out where the everyday stock was extracted directly from the company’s ERP. Yin (2018) designates this way of data collection as “Archival Records”.
4.2.2 Step II – Defining a Set of Alternative Theoretical Scenarios
After collecting all the needed information to proceed with the analysis, several alternative theoretical scenarios were selected and defined, considering different picking routes policies and storage assignment strategies.
Picking Routes
According to Hall (1993), Traversal, Mid-Point, and Largest Gap Return strategies are the three basic picking routes (PR) performed inside a warehouse. When these three basic routes are combined, 21 different picking routes are created. For a better understanding, a graphical representation can be found on the appendix’s chapter (Appendix B to Appendix V).
In this analysis, apart from these 21 PR, Ratliff and Rosenthal (1983) created a heuristic, which is often mentioned as one that offers an optimal picking route, minimizing the travelled distances inside the warehouse (Goetschalckx and Ratliff, 1988; Jarvis and McDowell, 1991; Cormier and Gunn, 1992; Roodbergen and De Koster, 2001b; Bartholdi and Hackman, 2017). The algorithm published by these authors was also used, creating the 22nd picking route in this research. S-Shape Curves strategy is not specified in this analysis because it is equivalent to the Transversal strategy in this specific warehouse.
Combining all the basic picking routes route and the heuristic, 22 PR were considered in this case study, as summarized in Table 2.
27
Table 2 - Selected Picking Routes
Picking routes Number of routes Strategy PR-1 to PR-18 18
Largest Gap Return Strategy in one aisle and Transversal in the other two, changing the aisle in which the route is started (6 scenarios starting in aisle A1, 6 scenarios starting in aisle A2
and 6 scenarios starting in aisle A3).
PR-19 1 Largest Gap Return Strategy in every aisle. PR-20 &
PR-21 2
Middle-Point strategy in one aisle (A2 or A3) and transversal in
the other two.
PR-22 1 The algorithm proposed by Ratliff and Rosenthal (1983).
The reason behind the selection of these picking routes was the attempt to analyse the difference between a basic picking route performance and an optimal heuristic, as also studied by Roodbergen and De Koster (2001b). In this case, the 3 basic picking routes are suggested by Hall (1993) and the optimal heuristics by Ratliff and Rosenthal (1983).
Storage Assignment Strategies
Hausman et al. (1976), De Koster et al., (2007), Chan and Chan (2011), Glock and Grosse (2012), and Carvalho et al., (2018) identified Random, Class-Based, and Fixed/Dedicated as the three most used storage assignment strategies in companies nowadays (hereafter to as SA – 1, SA – 2, and SA – 3, respectively).
Class-Based (SA-2) and Fixed/Dedicated (SA-3) Storage Assignments will be considered using ABC analysis as a basis to classify each product, considering as criterion the picking frequency during Scenario 0 (real picking/storage movements performed by the picker). It was decided to select ABC analysis because it is one of the most used methods when it comes to storage allocation, as concluded from Chapter 2.3.2 (Le-Duc and De Koster, 2005; Chan and Chan, 2011).
The 22 picking routes (PR) and the 3 storage allocations (SA) considered should be compared with the Scenario 0, which is characterized by a specific warehouse layout, storage assignment and picking route, according to current daily operation in the warehouse.
28
4.2.3 Step III – Assessing and Comparing Alternative Theoretical Scenarios.
In this methodological step, all the studied scenariosaregoing to be assessed and compared in terms of the total travelled distance inside the warehouse during the picking activity and compared with Scenario 0.
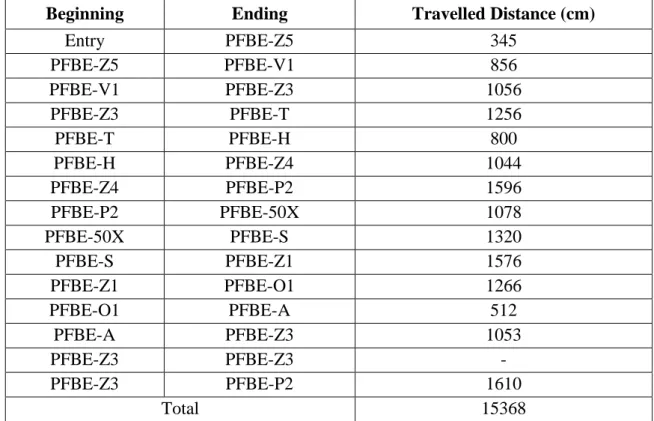
Based on Roodbergen et al. (2008) and Carvalho et al. (2018), to calculate these distances, the following Equation (1) should be used:
∑𝑛𝑖=1∑𝑛𝑗=1𝐷𝑖𝑗 ∗ 𝑇𝑖𝑗 (1)
in which n represents the number of visited shelves plus one (to include the entrance), i and j represents a location point inside the warehouse (it can be the entrance or a shelf),
Dij represents the distance between a location point i and j (with i ≠ j), and Tij represents
the frequency in which the distance between location point i and j is travelled.
4.2.4 Step IV – Presenting Recommendations for the Company.
According to Voss et al. (2002), a case study is only completed when the results obtained are shared with the companies’ superior boards, looking for company’s validation. In this case, the feedback was gotten after their presentation in an informal meeting to the Head of Logistics.