www.ambi-agua.net E-mail: ambi.agua@gmail.com
This is an Open Access article distributed under the terms of the Creative Commons Attribution License, which permits unrestricted use, distribution, and reproduction in any medium, provided the original work is properly cited.
Microclimate in understories of a mango orchard and a degraded area
in the Eastern Amazon
ARTICLES doi:10.4136/ambi-agua.2129
Received: 29 Apr. 2017; Accepted: 28 Jun. 2018
Juliana Chagas Rodrigues1*; Izildinha Souza Miranda2;
Adriano Marlisom Leão de Sousa2
1Escola Superior de Agricultura Luiz de Queiroz (Esalq-USP), Piracicaba, SP, Brasil
Programa de Pós-Graduação em Engenharia de Sistemas Agrícolas (PPGESA). E-mail:rodriguesjc@usp.br
2Universidade Federal Rural da Amazônia (UFRA), Belém, PA, Brasil
Instituto Socioambiental e dos Recursos Hídricos (ISARH). E-mail: izildinha.miranda@ufra.edu.br, adriano.souza@ufra.edu.br
*Corresponding author
ABSTRACT
Changes in land use alter regional microclimate. This study compared the microclimate in understories of a mango orchard and a degraded area in the municipality of Salinópolis, in the northeast of the Brazilian State Pará, eastern Amazon. In both environments, the microclimate was monitored through collecting data on the following variables: maximum, minimum and average air temperature, air thermal amplitude and vapor pressure deficit. The microclimate was monitored daily during four seasons: early rainy season, late rainy season, early dry season and late dry season, between December 2015 and November 2016. Vegetation coverage was the most important factor to soften maximum and average air temperature in the understories. Lower values of meteorological variables were observed in the mango orchard understory, especially during late rainy season and late dry season, except for minimum air temperature, which was lower in the understory of the degraded area, especially during the late rainy season. The microclimate in the understory differed between both environments, and mango orchards may ameliorate the understory microclimate more efficiently than degraded areas; therefore, the mango orchard can be used as an alternative for the rehabilitation of degraded areas. Keywords: air relative humidity, air temperature, thermal comfort.
Microclima em sub-bosque de pomar de mangueiras e de vegetação de
área degradada na Amazônia Oriental
RESUMO
Rev. Ambient. Água vol. 13 n. 4, e2129 - Taubaté 2018
distintas, denominadas início da estação chuvosa, estação chuvosa, estação de transição e estação menos chuvosa, no período de dezembro de 2015 a novembro de 2016. A cobertura vegetal foi fator determinante na atenuação das temperaturas máximas e médias do ar no sub-bosque. Os menores valores das variáveis meteorológicas foram obtidos no sub-bosque do pomar de mangueiras, principalmente, nas estações chuvosa e menos chuvosa, exceto a temperatura mínima do ar que foi menor no sub-bosque da área degradada, sobretudo, no início da estação chuvosa. Os microclimas no sub-bosque diferem entre os dois ambientes, e o pomar de mangueiras pode melhorar o microclima no sub-bosque quando comparado ao sub-bosque da área degradada; portanto, o pomar de mangueiras pode ser utilizado como alternativa para reabilitação de áreas degradadas.
Palavras-chave: conforto térmico, temperatura do ar, umidade relativa do ar.
1. INTRODUCTION
The occupation process of the Amazon, from the 1960s and 1970s, occurred along the highways where population growth occurred through intense migratory movement and the expropriation of land in the region. This process brought as the main problem deforestation that persists to the present day. As a consequence, the expansion of agriculture, livestock and logging, especially related to the length of the roads, the number of settled families and the indigenous lands (Becker, 2005).
The conversion of forested areas (greater roughness) into agricultural cultivation (e.g. grain crops), pasture or bare land (less roughness), decreased the turbulent exchange of heat in the boundary layer of this tropical region, and promoted reduction evapotranspiration, thereby increasing surface temperature (Perugini et al., 2017). It is clear that changes in land use may result in regional microclimate alterations.
The presence of trees reduces the average air temperature by 1.25ºC (Pinheiro et al., 2013), the maximum air temperature by 0.77ºC (Pezzopane et al., 2015), the air thermal amplitude by 2.40ºC, and the vapor pressure deficit of the understory by 0.34 kPa (Pezzopane et al., 2010). Therefore, planting trees may ameliorate understory microclimate (Pezzopane et al., 2010; 2015; Pinheiro et al., 2013), especially in degraded areas with a history of land use changes.
Tree species with desirable functional characteristics for the recovery of degraded areas (e.g. broad canopy and high tolerance to changes in soil moisture) may be obtained by using non-native trees for forest restoration (Chazdon et al., 2016). In such a context, one species may be used to restore at least one ecosystem function through understory microclimate amelioration.
The use of mango orchards (Mangifera indica L.) is an alternative for restoration of
degraded areas. It is a tropical tree species, with a broad canopy and evergreen leaves, that can tolerate long dry periods and low-nutrient soils, and also has efficient nutrient absorption (Ganeshamurthy and Reddy, 2015). Additionally, mango trees produce fruit that is a source of nutrients, vitamins and dietary fiber (Kumar et al., 2015). In this scenario, mango trees may be used to provide ecosystem services for trapping (soil quality and food production), and regulation (climatic regulation) (Ganeshamurthy and Reddy, 2015; Kumar et al., 2015). In Brazil, the mango is the 7th most-produced fruit, and in 2015 the country produced 976,815 t of
mango and harvested 64,305 ha, with yield of 15.19 t ha-1 (IBGE, 2015).
Rev. Ambient. Água vol. 13 n. 4, e2129 - Taubaté 2018
2.
MATERIALS
AND
METHODS
The study was conducted in the understories of two distinct environments: a mango orchard (MO) and an regenerating forest area (DA) separated by a linear distance of 1.5 km, where the vegetation of secondary forests predominates. Both areas are located in the municipality of Salinópolis, northeast of the Pará State, eastern Amazon, Brazil. The soil type in the area is Dystrophic Yellow Latosol (EMBRAPA, 2013). According to Köppen, local climate is Am subtype, tropical rainy with a short dry season (Alvares et al., 2013). Average air temperature and humidity are 27ºC and 82.5% in the region, respectively; average wind speed
and insolation are 1.75 m s-1 e 2,100 h, respectively; while mean annual precipitation is
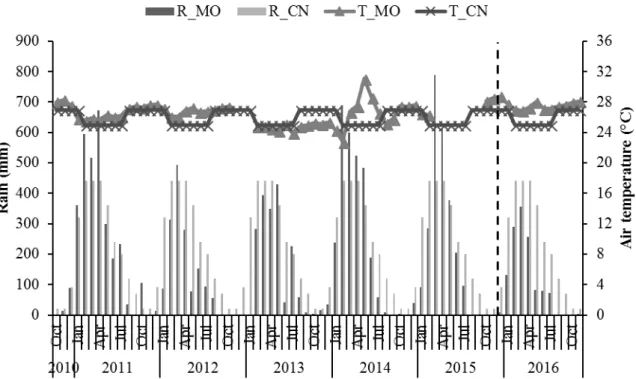
2,750 mm (Ramos et al., 2009). Figure 1 shows rainfall and the average air temperature above the canopy of mango trees and the climatological normal of Salinópolis according to Ramos et al. (2009).
Figure 1. Rain (bar) and the average air temperature (lines) above the canopy of mango trees (October 2010 to November 2016) and the climatological normal (1961-1990) of Salinópolis, Pará. Highlight for the period of this study. R_MO: Rain in the mango orchard; R_CN: Rain in the climatological normal; T_MO: Average air temperature in the mango orchard; T_CN: Average air temperature in the climatological normal.
The Tommy Atkins mango variety (00°39’50.50” S, 47°17’04.10” W, height: 17 m) was
planted between 1991 and 1993 in partnership with a culture of soursop (Annona muricata L.).
Afterwards, the orchard was abandoned. From 2003, the cultural practices inherent to the culture were carried out, as well as the cleaning of the area by the burning of vegetation residues. This process extinguished the soursop plants. Currently, the orchard has a total area of 25 ha cultivated in a non-irrigated system, spaced 10 x 10 m (100 plants ha-1), and the average height
of the plants is 6.5 m. The average fruit yield in the orchard is 15.66 t ha-1 (Rodrigues et al.,
2013). Before the implantation of the mango orchard, the vegetation of secondary forest predominated in the region.
The regenerating forest area (00°40’09.44” S, 47°17’47.58” W, height: 22 m) was used for
the cultivation of cashew trees (Anacardium occidentale L.). In 2012, after productivity
Rev. Ambient. Água vol. 13 n. 4, e2129 - Taubaté 2018
initial stages of succession, called “capoeirinha”. Ecosystem services were lost in this area, with
a reduction of physicochemical soil quality in comparison to the surrounding open ombrophylous forest with palms. The changes in land use through which this area passed have caused its degradation; therefore, this area was denominated as degraded area. The degraded area had high soil bulk density (1.82 g cm-3), low total porosity (29%); and a small quantity of
organic matter (10.21 g kg-1), while in the forest the values were 1.74 g cm-3; 32%; and
21.52 g kg-1, 10-20 cm deep in the soil. Before the implantation of the cashew trees, secondary
forest vegetation predominated in the region.
A 100 x 100 m plot was installed in each area, where data were collected on the understory microclimate from December 2015 to November 2016. A meteorological station was installed on the ground at the center of each plot. Thermohygrometers were installed 1.5 m above the ground to collect daily data of maximum, minimum and average air temperature, and air humidity. An HMP155A (Vaisala) thermohygrometer was used in the mango orchard, while in the degraded area the thermohygrometer used was part of an integrated Vantage Pro2 (Davis) meteorological station.
Rain data were collected daily with a TB4, Campbell Scientific pluviometer, installed at a height of 10.5 m above the mango trees’ canopy. All sensors were connected to an automated data collection system (datalogger), which collected information every ten seconds. Every ten minutes, means were calculated and stored with total amount of data collected. In the mango orchard, a Campbell Scientific CR1000 datalogger was used, while in the degraded area, the datalogger was integrated into the meteorological station.
Using the data of air temperature and relative humidity, we obtained the air thermal amplitude and vapor pressure deficit. Air thermal amplitude was calculated from the difference between maximum air temperature and minimum air temperature. Vapor pressure deficit was calculated from the difference between saturated vapor pressure (Equation 1) and the actual vapor pressure, which was obtained from relative air humidity (Pereira et al., 2002). Vapor pressure deficit data was always collected between 10h00 and 15h00, because this is the period of the day with greatest atmospheric demand for water in the region.
𝑒𝑠 = 0.6108 ∗ 10237.3+𝑇7.5∗𝑇 (1)
where: es is the saturated vapor pressure (kPa) and T is the average air temperature (°C). The microclimate was monitored between December 2015 and November 2016. This period was divided into four seasons: early rainy season (ERS – December 2015 to February 2016); late rainy season (LRS – March to May 2016); early dry season (EDS – June to August 2016); and late dry season (LDS – September to November 2016), according to the classification proposed by Moraes et al. (2015) for rainfall on Pará coast.
Rev. Ambient. Água vol. 13 n. 4, e2129 - Taubaté 2018
3.
RESULTS
AND
DISCUSSION
Total rainfall between December 2015 and November 2016 was 1279.40 mm (Figure 2), which was lower than the mean annual rainfall levels in the region, 2750 mm (Ramos et al., 2009). Lower rainfall levels have been related to the occurrence of the El Niño ocean-atmosphere phenomenon (2015-2016).
The highest rainfall levels were registered during LRS (693.80 mm) and lowest levels were registered during LDS (4.20 mm) (Figure 2). In both cases, rainfall levels were lower than mean rainfall levels for each period of the year on the Pará coast, which are between 1200 and 1500 mm (LRS) and between 400 and 600 mm (LDS) (Moraes et al., 2015). During the early rainy season and early dry season, registered rainfall levels were 428.60 and 152.80 mm, respectively.
Figure 2. Rain (bars) above the mango trees canopy and air temperature (lines) in the understory of the studied environments, in four seasons, in Salinópolis, Pará. T_MO: Average air temperature in the mango orchard; T_DA: Average air temperature in the degraded area; Tx_MO: Maximum air temperature in the mango orchard; Tx_DA: Maximum air temperature in the degraded area; ERS: Early rainy season; LRS: Late rainy season; EDS: Early dry season; LDS: Late dry season.
Maximum air temperature differed between the understories of the mango orchard and the degraded area (p<0.001) (Table 1). The mango orchard reduced maximum temperature in the understory by an average of 1.63ºC in relation to the degraded area The greatest reduction in maximum air temperature in the understories between the mango orchard and the degraded area was observed during LDS (2.65ºC).
Reduction of maximum air temperature in understories has been observed in other studies, where the mean reduction was 0.77ºC in forest understories, in São Carlos, São Paulo State (Pezzopane et al., 2015) and 2.20ºC, in the understory of macadamia nut trees (Macadamia integrifolia Maiden & Betche), in São Mateus, Espírito Santo State (Pezzopane et al., 2010), in
relation to other environments outside of the understory.
Rev. Ambient. Água vol. 13 n. 4, e2129 - Taubaté 2018
less vegetation, minimum air temperature is usually lower, because having less vegetation facilitates the passage of longwave radiation (coming from Earth), leading to atmospheric cooling. This mainly occurs during the night, when the radiation balance is governed by longwave balance (Pereira et al., 2002).
Mean air temperature in the understory differed between the mango orchard and the degraded area only during LRS (p=0.041) and LDS (p<0.001) (Table 1). The mango orchard reduced mean air temperature in the understory by 0.37ºC in comparison to the degraded area. Similar results were observed in São Carlos, where average air temperature was reduced by 0.25ºC in the forest understory with more vegetation coverage in comparison with the other understory (Pezzopane et al., 2015). This was lower than the results found in Jussari, Bahia State, where the reduction of the average air temperature was 1.25°C in the understory of the forest areas and a shaded cacao crop (Theobroma cacao L.) (Pinheiro et al., 2013).
Table 1. Mean of the maximum, minimum and average temperatures, air temperature amplitude and vapor pressure deficit (mean ± standard deviation) in the understory of the studied environments, and analysis of variance, degrees of freedom of the residue, F, significance, and t test in four seasons of the year in Salinópolis, Pará.
Season Environment ANOVA
MO DA DF F
Maximum air temperature (°C)
ERS 30.60 ± 0.67 A 31.73 ± 1.16 B 122 44.95*** LRS 30.30 ± 1.03 A 31.89 ± 0.45 B 107 38.95*** EDS 30.20 ± 0.43 A 31.33 ± 0.25 B 107 110.98*** LDS 30.73 ± 0.46 A 33.38 ± 0.38 B 101 366.30***
Minimum air temperature (°C)
ERS 25.62 ± 1.36 A 25.08 ± 1.17 B 122 4.22* LRS 24.96 ± 1.25 A 25.01 ± 1.16 A 107 0.03ns
EDS 24.49 ± 1.37 A 24.28 ± 1.03 A 107 0.38ns
LDS 26.22 ± 0.54 A 26.28 ± 0.58 A 101 0.09ns
Average air temperature (°C)
ERS 27.72 ± 0.89 A 27.61 ± 1.15 A 122 0.29ns
LRS 27.43 ± 0.98 A 27.94 ± 0.69 B 107 4.29* EDS 27.22 ± 0.67 A 27.45 ± 0.28 A 107 1.89ns
LDS 27.88 ± 0.28 A 28.74 ± 0.24 B 101 103.47*** Air thermal amplitude (°C)
ERS 4.98 ± 1.00 A 6.65 ± 0.79 B 122 75.96*** LRS 5.34 ± 1.20 A 6.88 ± 1.21 B 107 23.48*** EDS 5.71 ± 1.47 A 7.05 ± 1.18 B 107 12.59** LDS 4.51 ± 0.55 A 7.10 ± 0.53 B 101 236.32***
Vapor pressure deficit (kPa)
ERS 1.05 ± 0.31 A 1.05 ± 0.43 A 122 0.00ns
LRS 0.86 ± 0.30 A 1.03 ± 0.19 B 107 4.92* EDS 1.12 ± 0.13 A 1.22 ± 0.10 B 107 8.76** LDS 1.30 ± 0.11 A 1.67 ± 0.14 B 101 120.06***
ANOVA: Analysis of variance; MO: Mango orchard; DA: Degraded area; DF: Degrees of freedom of the residue; ERS: Early rainy season; LRS: Late rainy season; EDS: Early dry season; LDS: Late dry season. The level of significance is indicated (*: p<0.05, **: p<0.01, ***: p<0.001, ns: not significant).
Rev. Ambient. Água vol. 13 n. 4, e2129 - Taubaté 2018
maximum and average air temperature (Figure 2). The influence of vegetative cover was greater during the diurnal period than during the nocturnal period, mainly in the late dry season, causing greater alteration in the maximum temperature than in the minimum (Figure 3), corroborating Pezzopane et al. (2010). Different intensities of tree cover systems influence the amelioration of microclimate as observed in this study; agreeing with the results obtained by Pinheiro et al. (2013) when the average air temperature in a forest understory area and a shaded cacao crop were compared.
Air thermal amplitude in the understory differed between the mango orchard and the degraded area (p<0.001) (Table 1). Smaller air thermal amplitude was observed in the understory of the mango orchard in comparison with that of the degraded area; air thermal amplitude was reduced on average by 1.78ºC. However, a greater reduction has already been observed during LDS (2.59ºC). The values of air thermal amplitude in the understory observed in our study (Table 1) were similar to those observed in other studies, varying on average between 0.72ºC and 2.40ºC (Pezzopane et al., 2010; 2015). Areas with vegetative cover act as thermal insulators, hampering the passage of heat brought by sunlight towards the ground, and reducing the variation in air thermal amplitude (Pereira et al., 2002).
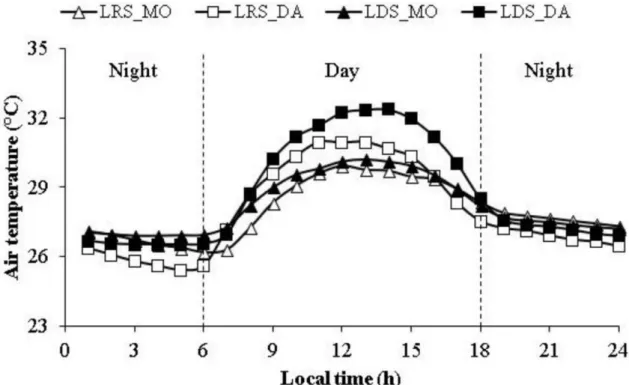
Figure 3. Average hourly average air temperature (T) in understories during the late rainy and the late dry season, in two environments, during daytime and night time, in Salinópolis, Pará. MO: Mango orchard; DA: Degraded area. LRS_MO: late rainy season in the mango orchard; LRS_DA: late rainy season in the degraded area; LDS_MO: late dry season in the mango orchard; LDS_DA: late dry season in the degraded area.
Rev. Ambient. Água vol. 13 n. 4, e2129 - Taubaté 2018
vegetation is not so efficient. Because of this, the thermal discomfort in this environment is evident.
The vapor pressure deficit in the understory differed between both environments during LRS (p=0.029), EDS (p=0.004) and LDS (p<0.001) (Table 1). The vapor pressure deficit increased, on average, 0.16kPa in the understory of the degraded area compared to the understory of the mango orchard. The vapor pressure deficit presented higher values during LDS when compared to LRS in both environments (Figure 4), due to the higher demand of water from the atmosphere during LDS.
Lower values of vapor pressure deficit in mango orchard understory showed that, due to the greater aerodynamic resistance of the vegetation, the evaporating capacity of the air is reduced. The distribution of mango trees in the orchard creates a wind barrier. When this barrier is transposed, the wind enters the understory at a slower speed and with less power to affect the vapor pressure gradient between the evaporating surface and the air. Such a condition reduces the vapor pressure deficit in the understory of mango orchard, differing from what was observed in degraded area.
Figure 4. Demand average daily vapor pressure deficit (VPD) in the understory during the late rainy and late dry season, in two environments, during daytime and night time, in Salinópolis, Pará. MO: Mango orchard; DA: Degraded area. LRS_MO: late rainy season in the mango orchard; LRS_DA: late rainy season in the degraded area; LDS_MO: late dry season in the mango orchard; LDS_DA: late dry season in the degraded area.
Rev. Ambient. Água vol. 13 n. 4, e2129 - Taubaté 2018
4. CONCLUSIONS
The microclimates of the mango orchard understory and the degraded area understory differ, especially during the late dry season. The mango orchard ameliorates microclimate in the understory in comparison with the vegetation of the degraded area, mainly, due a reduction of maximum air temperature and air thermal amplitude, therefore providing the important ecosystem service of climate regulation. Mango tree orchards grown as rustic fruit trees and to soften the understory microclimate may be used as an alternative for the rehabilitation of degraded areas, since they provide ecosystem services, such as food production and climate control.
5.
ACKNOWLEDGEMENTS
This research was funded by the Conselho Nacional de Desenvolvimento Científico e Tecnológico (CNPq – Process No. 482732/2012-1) and Fundação Amazônia de Amparo a Estudos e Pesquisas (FAPESPA – Process No. 136/149069-2014). The Coordenação de Aperfeiçoamento de Pessoal de Nível Superior (CAPES) that provided a scholarship to the first author.
6.
REFERENCES
ALVARES, C. A.; STAPE, J. L.; SENTELHAS, P. C.; GONÇALVES, J. L. M.; SPAROVEK,
G. Köppen’s climate classification map for Brazil. Meteorologische Zeitschrift, v. 22,
n. 6, p. 711-728, 2013. http://dx.doi.org/10.1127/0941-2948/2013/0507
BECKER, B. K. Geopolítica da Amazônia. Estudos Avançados, v. 19, n. 53, p. 71-86, 2005. http://dx.doi.org/10.1590/S0103-40142005000100005
CHAZDON, R. L.; BRANCALION, P. H. S.; LAESTADIUS, L.; BENNETT-CURRY, A.; BUCKINGHAM, K.; KUMAR, C. et al. When is a forest a forest? Forest concepts and definitions in the era of forest and landscape restoration. Ambio, v. 45, n. 5, p. 538-550, 2016. http://dx.doi.org/10.1007/s13280-016-0772-y
EMPRESA BRASILEIRA DE PESQUISA AGROPECUÁRIA. Sistema brasileiro de classificação de solos. 3. ed. Brasília, 2013. 353 p.
GANESHAMURTHY, A. N.; REDDY, Y. T. N. Fitness of mango for colonization in low fertility soils and dry lands: Examination of leaf life-span, leaf nutrient resorption, and nutrient use efficiency in elite mango varieties. Agricultural Research, v. 4, n. 3, p. 254-260, 2015. http://dx.doi.org/10.1007/s40003-015-0164-8
INSTITUTO BRASILEIRO DE GEOGRAFIA E ESTATÍSTICA. Produção Agrícola Municipal 2015: Culturas temporárias e permanentes. Rio de Janeiro, 2015. 57 p. KUMAR, P.; SHARMA, S. D.; SHARMA, N. C.; DEVI, M. The path coefficient analysis of
yield components for leaf nutrient concentrations in mango (Mangifera indica L.) under
rainfed agroclimatic conditions of north-west Himalaya. Scientia Horticulturae, v. 190, p. 31-35, 2015. http://dx.doi.org/10.1016/j.scienta.2015.02.042
Rev. Ambient. Água vol. 13 n. 4, e2129 - Taubaté 2018
PEREIRA, A. R.; ANGELOCCI, L. R.; SENTELHAS, P. C. Agrometeorologia: Fundamentos e aplicações práticas. Guaíba: Agropecuária, 2002. 478 p.
PERUGINI, L.; CAPORASO, L.; MARCONI, S.; CESCATTI, A.; QUESADA, B.; NOBLET-DUCOUDRÉ, N. et al. Biophysical effects on temperature and precipitation due to land cover change. Environmental Research Letters, v. 12, n. 5, p. 1-13, 2017. https://doi.org/10.1088/1748-9326/aa6b3f
PEZZOPANE, J. R. M.; BOSI, C.; NICODEMO, M. L. F.; SANTOS, P. M.; CRUZ, P. G.; PARMEJIANI, R. S. Microclimate and soil moisture in a silvopastoral system in southeastern Brazil. Bragantia, v. 74, n. 1, p. 110-119, 2015. http://dx.doi.org/10.1590/1678-4499.0334
PEZZOPANE, J. R. M.; MARSETTI, M. M. S.; SOUZA, J. M.; PEZZOPANE, J. E. M. Condições microclimáticas em cultivo de café Conilon a pleno sol e arborizado com nogueira macadâmia. Ciência Rural, v. 40, n. 6, p. 1257-1263, 2010. http://dx.doi.org/10.1590/S0103-84782010005000098
PINHEIRO, M. P.; OLIVEIRA FILHO, J. A.; FRANÇA, S.; AMORIM, A. M.; MIELKE, M. S. Annual variation in canopy openness, air temperature and humidity in the understory of three forested sites in southern Bahia State, Brazil. Ciência Florestal, v. 23, n. 1, p. 107-116, 2013. http://dx.doi.org /10.5902/198050988445
RAMOS, A. M.; SANTOS, L. A. R.; FORTES, L. T. G. Normais climatológicas do Brasil 1961-1990. Brasília: INMET, 2009. 465 p.