Isotopic traceability in body tissues and in different breeding periods of broilers
[Rastreabilidade isotópica em tecidos corporais e em diferentes períodos de criação de frangos de corte]
R.P. Oliveira1, C. Ducatti1, A.S. Carrijo2†, A.C. Pezzato3, J.C. Denadai1*, J.R. Sartori3, V.C. Cruz4
1Instituto de Biociências - Universidade Estadual Paulista - UNESP - Botucatu, SP 2
Faculdade de Medicina Veterinária e Zootecnia - Universidade Federal do Mato Grosso do Sul, MS 3
Faculdade de Medicina Veterinária e Zootecnia - Universidade Estadual Paulista - UNESP - Botucatu, SP 4
Campus Experimental de Dracena - Universidade Estadual Paulista - UNESP - Dracena, SP †in memorian
ABSTRACT
The inclusion of poultry viscera meal (VM) in broiler diets to possibly replace it with strictly vegetable diet (VE) and vice-versa, using the technique of carbon and nitrogen stable isotopes in different tissues was traced. One hundred ninety-two one-day-old chicks that had been distributed randomly were used in twelve experimental treatments with four replications of four chicks each. The treatments consisted of vegetable diet (VG) for diets containing FV going after a certain age or the reverse, in which the birds began feeding VM on diet and then switched to VE diet. At 42 days of age, samples of pectoral muscle (Pectoralis major), keel and tibia were collected, with later determination of isotopic ratios (13C/12C and 15N/14N). The stable isotopes
technique couldn’t trace the use of VM in feeding broilers when this ingredient was part of broiler diets only in the first seven, 14 or 21 days of age. However, this technique can be applied to younger poultry that have been sampled before a possible change in diet, since they can have the isotopic signature of feeding stabilized around two weeks of age.
Keywords: broiler, poultry viscera meal, stable isotopes, carbon-13, nitrogen-15
RESUMO
Rastrearam-se a inclusão de farinha de vísceras de aves (FV) em dietas de frangos por ocasião de eventual substituição de dieta contendo FV por dieta estritamente vegetal, e vice-versa, por isótopos estáveis de carbono e de nitrogênio. Foram distribuídos aleatoriamente 192 pintos de um dia de idade, em 12 tratamentos com quatro repetições de quatro aves. Os tratamentos constituíam-se de dieta de vegetais (VG) passando para dietas contendo FV, após certa idade, ou o inverso, em que as aves começaram se alimentando de dieta FV e depois passaram para dieta VG. Aos 42 dias de idade, foram coletadas amostras de músculo peitoral (Pectoralis major), quilha e tíbia, para determinação das razões isotópicas (13C/12C e 15N/14N). A técnica dos isótopos estáveis somente não foi capaz de rastrear a utilização de FV na alimentação de frangos de corte, quando esse ingrediente fez parte da dieta das aves apenas nos primeiros sete, 14 ou 21 dias de idade. Entretanto, há a possibilidade da aplicação dessa técnica em aves mais jovens, amostradas antes de eventual mudança de dieta, pois elas podem ter a assinatura isotópica da alimentação estabilizada em torno de duas semanas de idade.
Palavras-chave:frango, farinha de vísceras de aves,isótopos estáveis, carbono-13, nitrogênio-15
Recebido em 15 de agosto de 2011 Aceito em 5 de julho de 2012
*Autor para correspondência (corresponding author) E-mail: [email protected]
INTRODUCTION
According to Cerutti (2002), many worldwide episodes which scared and threatened the consumption of animal and vegetable products
Spongiform Encephalopathy (BSE) or “mad cow
disease” in many European countries, Canada,
United States and Japan (OIE, 2005) are worth mentioning. Furthermore, governmental and nongovernmental actions as well as cultural and religious influences set the tendencies regarding the production and consumption of said products (e.g.: green, organic, Halal certified chicken etc.). Consequently, many importing markets, such as the European Union and the Middle East, require that poultry not be fed animal origin ingredients and chemical growth promoters.
To that purpose, traceability is shown to be a key tool in certifying meat and other products, which is essential for the survival and success of companies in an increasingly more competitive and demanding globalized world. In order for poultry traceability to be successful, the sector must not wait again for importers to force initiatives or place an embargo on local production. Problems involving sanitation and technical barriers in Brazil are examples of how a traceability programs can validate the quality of the national product and even protect Brazilian exporters from potential questioning (Belchior, 2003).
The stable isotopes technique was initially used in geological and archaeological studies. Its application has been growing steadily in the last decades in agricultural, ecological and physiological researches and is a promising alternative for studies of processes related to nutrient digestion, absorption and metabolism in humans and animals, as well as in studies to identify the origin and quality of animal and vegetable origin products (Gannes et al., 1998).
According to Carrijo et al. (2006), the technique of carbon and nitrogen stable isotopes can be used as a tool to trace the inclusion of animal origin by-products in broiler diets by analyzing the isotopic ratio of the pectoral muscle (Pectoralis major). Moreover, the author suggests that the improvement of this technique can enable the certification according to which broilers for the external market were fed exclusively vegetable origin ingredients.
Each tissue or biochemical fraction may have its
own isotopic “memory”, which can be a function
of the isotopic ratio of feed for its synthesis, of subsequent feeds and biochemical turnover rate of the tissue (Tieszen, 1978). Tissues with quick
isotopic turnover will reflect more recent diets whereas those with slower turnover rates will reflect more remote diets (Hobson and Clark, 1992a). Therefore, the choice of each kind of tissue for isotopic analysis will depend on individual interests. Furthermore, isotopic turnover also depends on animal growth (Zuanon, 2003), which causes this estimate to have different values for the same tissue in
different phases of an animal’s life.
According to the concept that animals reflect the isotopic signal of their diets (DeNiro and Epstein, 1978), after a certain time interval, broilers as well as other breeding animals can be fed diets containing animal origin ingredients in the early breeding period with a later replacement with vegetable diet in hopes to imprint the isotopic signal of the second diet on their tissues when it is time to slaughter them.
With the development of the stable isotope technique for traceability and certification of
broilers’ diet pattern, it became necessary to
know the behavior of the isotopic signature in different tissues in poultry, owing to an eventual diet substitution containing animal origin ingredients for a strictly vegetable diet and vice versa. The aim of this paper is to verify the ability to trace the use of poultry viscera meal (VM) in broiler diets in several phases of the breeding period by using the technique of carbon and nitrogen stable isotopes in different tissues.
MATERIALS AND METHODS
The experiment was conducted in the bioclimatic chambers of an Avian Nutrition Laboratory. One hundred ninety-two male one-day-old Cobb chicks, obtained from a batch of broiler breeders at 43 weeks of age, vaccinated in the commercial hatchery against Gumboro, Marek and Bouba were used. The chicks were housed in metallic cages with the following dimensions: 0.50m high, 0.50m wide and 0.60m deep, equipped with individual feeders and nipple drinkers, where they were randomly distributed in twelve treatments with a capacity of four chicks per cage.
and tibia) in 13C (-18.74±0.14; -17.78±0.10; and -16.57±0.42‰, respectively) and 15N (5.43±0.31; 5.74±0.27; and 6.08±0.24‰; respectively), at the beginning of the experiment.
A 24-hour lighting program was adopted and room temperature was controlled in order to keep it at thermal comfort (thermo neutral temperature) for the broilers during the whole breeding period (Sartori, 2000). Both food and the water were provided ad libitum.
The experimental treatments are identified in Table 1. The inclusion percentage of VM in diets was stipulated at 8% according to the information regarding practical levels that were adopted and collected from companies which produce broiler chickens. At first, the chickens in treatments T2, T3, T4, T5 and T6 underwent a
strictly vegetable diet (0% VM or VE) and went on to diets containing viscera meal (8% VM or VM) after a certain age (VE/VM at Y days,
where Y represents chickens’ age at changing
diet). The opposite was applied to the chickens in treatments T7, T8, T9, T10 and T11, which started their breeding period with a diet containing VM and then went on to a vegetable diet (VM/VE at Y days). The chickens in treatment T12 followed a diet containing VM throughout the whole experimental period (VM up to 42 days). Broiler tissues in all treatments were compared to their respective tissues of the
“green chicken pattern” (control group T1), not having animal origin ingredients in their diets throughout the whole breeding period (VE up to 42 days).
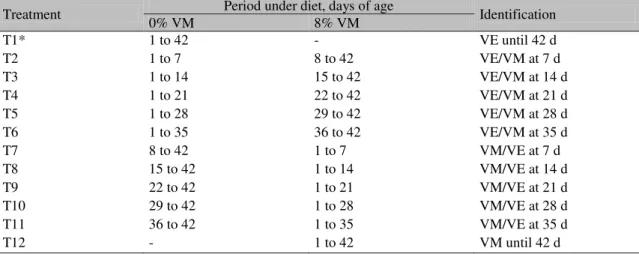
Table 1. Identification of experimental treatments (T) and period in which broilers were submitted to each diet
Treatment Period under diet, days of age Identification
0% VM 8% VM
T1* 1 to 42 - VE until 42 d
T2 1 to 7 8 to 42 VE/VM at 7 d
T3 1 to 14 15 to 42 VE/VM at 14 d
T4 1 to 21 22 to 42 VE/VM at 21 d
T5 1 to 28 29 to 42 VE/VM at 28 d
T6 1 to 35 36 to 42 VE/VM at 35 d
T7 8 to 42 1 to 7 VM/VE at 7 d
T8 15 to 42 1 to 14 VM/VE at 14 d
T9 22 to 42 1 to 21 VM/VE at 21 d
T10 29 to 42 1 to 28 VM/VE at 28 d
T11 36 to 42 1 to 35 VM/VE at 35 d
T12 - 1 to 42 VM until 42 d
*T1 = Control group (standard “green chicken”)
T2, T3, T4, T5 and T6 received vegetables diets (0% VM or VG), starting to receive VM (8% VM or VM) only after a certain age (VG/VM at Y days; Y stands for the birds age at the moment of diet changing; 7, 14, 21, 28, and 35 days, respectively).
T7, T8, T9, T10 and T11, which first received VM and then started to receive vegetables only (VM/VG at Y days; 7, 14, 21, 28, and 35 days, respectively). T12: VM diet to 42 days. VE = vegetable meal; VM = viscera meal.
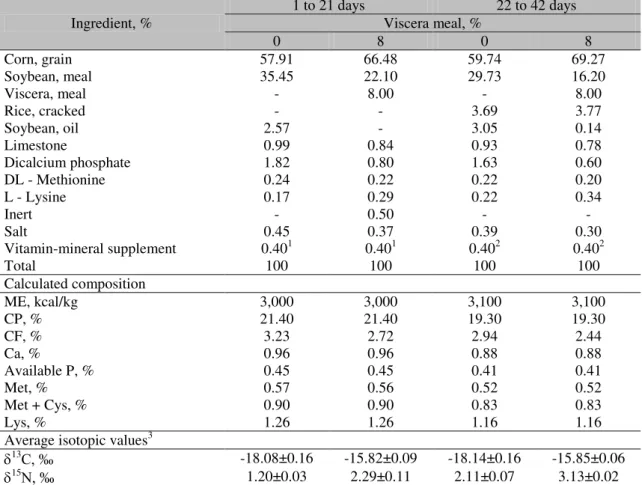
Food was formulated as to meet the nutritional requirements recommend by Rostagno et al. (2000) for a feeding program consisting of two nutritional levels, from 1 to 21 (starter diets) and from 22 to 42 days of age (grower diets). Nutritional contents of both diets were isoenergetic, isoproteic, isocalcic, isophosphoric and isoaminoacidic for methionine + cystine and lysine.
Table 2 shows percentage compositions, calculated nutritional contents and isotopic
Table 2. Percentage composition of ingredients, nutritional values calculated and average isotopic values for initial and grower experimental diets of broilers (1 to 21 and 22 to 42 days of age)
Ingredient, %
1 to 21 days 22 to 42 days
Viscera meal, %
0 8 0 8
Corn, grain 57.91 66.48 59.74 69.27
Soybean, meal 35.45 22.10 29.73 16.20
Viscera, meal - 8.00 - 8.00
Rice, cracked - - 3.69 3.77
Soybean, oil 2.57 - 3.05 0.14
Limestone 0.99 0.84 0.93 0.78
Dicalcium phosphate 1.82 0.80 1.63 0.60
DL - Methionine 0.24 0.22 0.22 0.20
L - Lysine 0.17 0.29 0.22 0.34
Inert - 0.50 - -
Salt 0.45 0.37 0.39 0.30
Vitamin-mineral supplement 0.401 0.401 0.402 0.402
Total 100 100 100 100
Calculated composition
ME, kcal/kg 3,000 3,000 3,100 3,100
CP, % 21.40 21.40 19.30 19.30
CF, % 3.23 2.72 2.94 2.44
Ca, % 0.96 0.96 0.88 0.88
Available P, % 0.45 0.45 0.41 0.41
Met, % 0.57 0.56 0.52 0.52
Met + Cys, % 0.90 0.90 0.83 0.83
Lys, % 1.26 1.26 1.16 1.16
Average isotopic values3
13C, ‰ -18.08±0.16 -15.82±0.09 -18.14±0.16 -15.85±0.06
15N, ‰ 1.20±0.03 2.29±0.11 2.11±0.07 3.13±0.02
1
Initial vitamin-mineral supplement Vaccinar (levels per kg of diet): vitamin A, 14,000 IU; vitamin D3, 2,500IU; vitamin E, 25mg; vitamin K3, 3mg; thiamine, 2mg; riboflavin, 5mg; pyridoxine, 4mg; vitamin B12, 25mcg; niacin, 35mg; pantothenic acid, 12mg; biotin, 0.10mg; folic acid, 1mg; choline, 800mg; antioxidant (B.H.T.), 2mg; selenium, 0.18mg; iron, 50.10mg; manganese, 78mg; iodine, 0.70mg; copper, 10mg; zinc, 55mg. 2Grower vitamin-mineral supplement Vaccinar (levels per kg of diet): vitamin A, 10,000IU; vitamin D3, 2,000 IU; vitamin K3, 2mg; thiamine, 2mg; riboflavin, 4mg; pyridoxine, 4mg; vitamin B12, 20 mcg; niacin, 30mg; pantothenic acid, 10mg; biotin, 0.06mg; folic acid, 1mg; choline, 600mg; antioxidant (B.H.T.), 2mg; selenium, 0.18mg; iron, 50.10mg; manganese, 78mg; iodine, 0.70mg; copper, 10mg; zinc, 55mg. 3Average isotopic values of 13C and 15N in regards to the international standard Peedee Belemnite (PDB) and atmospheric nitrogen (N2), respectively.
At 42 days of age, four chickens per treatment (n=4) were randomly sampled, weighed and slaughtered by cervical dislocation for sample collection of pectoral muscle, keel and tibia to conduct isotopic analyses.
The pectoral muscle samples were collected by removing a slice of approximately 5mm in the transversal direction of the middle longitudinal third of the left P. major. To obtain keel samples, the cartilaginous prolongation of the sternum was dissected and an insertion was made with the bone wedged by a transversal cut forming a right angle with its dorsal surface. The bone samples
were obtained by collecting the middle longitudinal third of the left tibia, which had its marrow content removed by washing with distilled water. All tissue samples were properly identified and frozen at -18ºC. Subsequently, the samples were processed and analyzed isotopically using methods described by Carrijo et al. (2006).
data generated by the error matrices for each tissue, regions (ellipses) were delimited with 95% confidence limits to assess differences between the averages of the experimental treatments and the average of the control group (strictly vegetable diet).
RESULTS AND DISCUSSION
The results of the isotopic analyses (13 C and 15
N) of diets used in this study are found in Table 2. It was observed that 15N values were enriched, both from vegetable diet to diet with VM and from starter diets (1 to 21 days of age) to grower diets (22 to 42 days of age) in the same diet. That probably occurred due to the variations in percentage composition of ingredients in diets. VM diets contained a smaller amount of soybean meal and bigger amounts of corn and VM (15
N
= 4.25‰) compared to vegetable diets. Similar
enriching observed from starter diets to grower diets can be attributed to the same fact, since grower diets also contained a smaller percentage of soybean meal, over cracked rice.The ingredients used in making diets were not isotopically analyzed for nitrogen and carbon. However, soybean is known to have a value of 15
N that approaches the value of standard atmospheric N2 (15N 0.0±1.0‰), since it fixes nitrogen in the air and shows a fractionation factor of 15N around a unit, generally below
1.003‰ (Kohl and Shearer, 1980; Handley and Raven, 1992; Werner and Schmidt, 2002). The value of 15N shown by plants not able to fix atmospheric nitrogen depends on the abundance of that isotope in the soil and the manure used, as is the case of corn (Choi et al., 2002), and probably rice. Sleiman et al. (2004), evaluating corn and rice samples in some Brazilian states, found average values of 4.77±1.16‰ and 9.23±0.72‰ for 15N, and -11.74±0.40 and -28.87±0.42 for 13
C, respectively.
Similarly to the example of enriching occurred in the 15
N values described above, the same thing was observed for 13C values in experimental diets because when VM is included (13
C = -16,60‰) in formulating the diet, a smaller amount of soybean meal and oil was required for its balancing in comparison to the
corresponding isoenergetic and isoproteic vegetable diet. Moreover, the inclusion of an energetic ingredient was increased, in this case, the corn. That happens because photosynthetic cycle C3 plants (e.g.: soybean, rice, wheat) have a modal value of 13C = -27.6‰ compared to the PDB pattern, and in photosynthetic cycle C4 plants (e.g.: corn, sorghum, sugarcane), that modal value is 13C = -12,6‰ (Vogel, 1993). Grower diets would be richer in 13C comparing to starter diets because in nutritional terms they are more energetic and less proteic, which causes the percentage composition of ingredients to change in the same diet, even though these values do not show significant differences. To do that, grower diets would have more corn and less soybean meal. However, small amounts of cracked rice were included in grower experimental diets in order to minimize the possible variation of 13C in comparison to the starter diets so that possible factors of carbon isotopic fractionation would be better calculated between tissues and their respective diets without varying the concentration of 13
C in the diet as a whole.
Those observations concerning 13C and 15N values in both broiler diets and other species are fundamental to identify the presence of animal origin by-products in feeding, since the diet’s
isotopic signature is reflected in animals’
organisms. According to DeNiro and Epstein (1976; 1978), an animal is what it consumes isotopically, up to ±2.0‰ for 13C and up to ±3.0‰ for 15N, although each tissue of the same animal can have a particular isotopic signature, fractionation factor (Hobson and Clark, 1992b) and isotopic turnover (Hobson and Clark, 1992a).
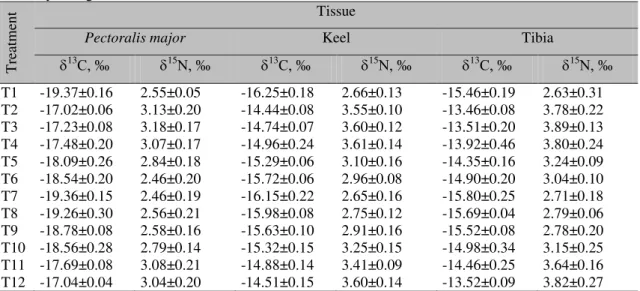
The average values of 13C and 15N for Pectoralis major, keel and tibia in broilers at the end of the experimental period are shown in Table 3. The results of the statistical analysis of isotopic pairs (13C and 15
Table 3. Average values of 13C and 15
N with respective standard deviations of different broiler tissues at 42 days of age
T
rea
tm
en
t Tissue
Pectoralis major Keel Tibia
13C, ‰ 15N, ‰ 13C, ‰ 15N, ‰ 13C, ‰ 15N, ‰
T1 -19.37±0.16 2.55±0.05 -16.25±0.18 2.66±0.13 -15.46±0.19 2.63±0.31 T2 -17.02±0.06 3.13±0.20 -14.44±0.08 3.55±0.10 -13.46±0.08 3.78±0.22 T3 -17.23±0.08 3.18±0.17 -14.74±0.07 3.60±0.12 -13.51±0.20 3.89±0.13 T4 -17.48±0.20 3.07±0.17 -14.96±0.24 3.61±0.14 -13.92±0.46 3.80±0.24 T5 -18.09±0.26 2.84±0.18 -15.29±0.06 3.10±0.16 -14.35±0.16 3.24±0.09 T6 -18.54±0.20 2.46±0.20 -15.72±0.06 2.96±0.08 -14.90±0.20 3.04±0.10 T7 -19.36±0.15 2.46±0.19 -16.15±0.22 2.65±0.16 -15.80±0.25 2.71±0.18 T8 -19.26±0.30 2.56±0.21 -15.98±0.08 2.75±0.12 -15.69±0.04 2.79±0.06 T9 -18.78±0.08 2.58±0.16 -15.63±0.10 2.91±0.16 -15.52±0.08 2.78±0.20 T10 -18.56±0.28 2.79±0.14 -15.32±0.15 3.25±0.15 -14.98±0.34 3.15±0.25 T11 -17.69±0.08 3.08±0.21 -14.88±0.14 3.41±0.09 -14.46±0.25 3.64±0.16 T12 -17.04±0.04 3.04±0.20 -14.51±0.15 3.60±0.14 -13.52±0.09 3.82±0.27
*T1 = Control group (standard “green chicken”)
T2, T3, T4, T5 and T6 received vegetables diets (0% VM or VG), starting to receive VM (8% VM or VM) only after a certain age (VG / VM at Y days; Y stands for the birds age at the moment of diet changing; 7, 14, 21, 28, and 35 days, respectively).
T7, T8, T9, T10 and T11, which first received VM and then started to receive vegetables only (VM / VG at Y days; 7, 14, 21, 28, and 35 days, respectively).
T12: VM diet to 42 days
VE = vegetable meal; VM = viscera meal
In treatments T2, T3, T4, T5 and T6 chicks were at first fed a vegetable diet and after a certain age (7, 14, 21, 28 and 35 days, respectively) received a diet with an 8% VM inclusion until their slaughter age (42 days).
For Pectoralis major it was observed that only treatments T2, T3 and T4 were different from the control group, since those trust regions did not go beyond any axis in the graph (Figure 1A). However, it is clear that all five treatments (T2, T3, T4, T5 and T6) were different compared to the control group when tissues were keel (Figure 1B) and tibia (Figure 1C).
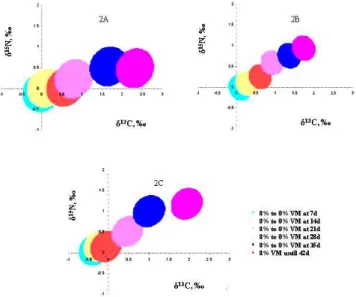
The results of the statistical analysis of isotopic
pairs for broiler’ tissues related to the six last
treatments, compared with the control group, are shown in Figure 2.
In treatments T7, T8, T9, T10 and T11 the broilers followed with 8% VM inclusion in the first breeding phase and went on to a vegetable diet after a certain age (7, 14, 21, 28 and 35 days, respectively), only in treatment T12 were the broilers raised under a diet containing VM throughout the experimental period.
In Figure 2A it was shown that the values for isotopic pairs for Pectoralis major in treatments T11 and T12 differed significantly from those in the control group. However, when analyzing the data for keel (Figure 2B) and tibia (Figure 2C), besides treatments T11 and T12, treatment T10 also differed from the control group.
Generally the differences between the 15N averages in treatments compared with the control group are slighter than the 13C averages in the same comparison in all tissues, which attaches great importance to 15N value in detecting the use of VM in feeding broilers. Thus, trust regions in the graphs shown spread farther apart along the carbon axis than along the nitrogen axis. That probably reflects carbon and nitrogen isotopic differences between vegetable and VM diets, of
which the latter is 2.27‰ richer in 13C and
1.05‰ in 15
N. Carrijo et al. (2006) showed that the diet with 8% of meat and bone meal was
Figure 1. Trust regions for 13C and 15N values of tissues in 42-day-old broilers from different treatments (vegetable meal/viscera meal at Y days). The values of the axes measure the differences in the treatment averages compared to the average in the control group (vegetable meal up to 42 days). 1A: Pectoralis major muscle; 1B: keels; 1C: tibias.
Figure 2. Trust regions for 13C and 15N values for tissues in 42-day-old broilers from different treatments (viscera meal/vegetable diet at Y days). The values of the axes measure the differences in the treatment averages compared to the average in the control group (vegetable diet up to 42 days). 2A: Pectoralis major muscle; 2B keels; 2C: tibias.
Compared to P. major, keel and tibia showed more suitable to detect VM feeding in broilers by stable isotopes technique when a vegetable diet was replaced by a diet with VM inclusion in some phase of the breeding period or vice versa,
as it evidences the differences in treatments compared with the control group.
great part, with the differences in amino acid concentrations in these tissues. Most amino acid compositions in the muscular tissue of the chicken breast are constituted for essential amino acids (Moran Jr., 1999), which, when incorporated in the tissues, show a slight change regarding their isotopic ratio in diet (Pinnegar and Polunin, 1999). On the other hand, collagen, which constitutes about 90% of the bone organic matrix (Knott and Bailey, 1998) and, therefore, a larger source of nitrogen in the bone, has more non-essential amino acids in its constitution (Hobson et al., 1993). Non-essential amino acids are entirely synthesized, or at least, partially modified inside the animal organism and, thus, may suffer an increase in 15N value when animals are fed diets containing VM, which makes a larger amount of 15N available for the synthesis of such compounds and provide these intact amino acids by means of proteins in the diet. The amino acids in the proteins in keel cartilage as well as their content of glicosaminoglican molecules (Luo et al., 2002) could possibly suffer similar enriching during the synthesis of this tissue. On the other hand, variations observed among tissues for values of 13
C may be related, in part, to the differences in percentage composition in their biochemical fractions, such as lipids, carbohydrates and proteins. Lipidic fractions can, comparatively, have a depletion of 13C (DeNiro and Epstein, 1978).
When considering keel and tibia results in a situation where vegetable diet represented the first diet for chickens, all treatments were different from the control group, even in those where chickens followed a VM diet only in the last breeding week (T6). However, when the second diet was vegetable, one or two feeding final weeks (T11 and T10, respectively) were not sufficient to imprint an isotopic signature similar to the control group. 15N enrichment at 0.30‰
and 0.41‰ in the averages of treatment T6 for
keel and tibia, respectively, compared to the control group, were sufficient to detect VM feeding during the last breeding week. On the other hand, in order for treatments T10 and T11 to be similar to the control group, the 15N
“impoverishing” value should have a higher
magnitude because poultry would have a carbon isotopic signature, and probably nitrogen, that would be totally stabilized in tissues around 12 to
17 days of age (Ducatti, 2004; Cruz et al., 2005), with enriching compared to the control group of
0.94‰ for keel and 1.19‰ for tibia.
If the VM diet has been less abundant in 15N, the statistical differences found for each tissue may not have been detected, mainly if the tissue under analysis was P. major, which had less enriching of that isotope compared to the control group and lower accuracy in the trust regions between the tissues studied. On the other hand, it is probable that the administration of diets richer in 15N and 13
C to animals that have a higher contrast in isotopic signatures compared to vegetable diets enables an easier determination of significant differences between treatments and the control, since nitrogen and carbon isotopic enriching in tissues is related to isotopic abundance in diet and the kind of tissue analyzed (DeNiro and Epstein, 1978; Tieszen et al., 1983; Shoeninger and DeNiro, 1984).
In Figure 2C, a slight tendency for tibia averages (Table 3) in treatments T7 and T8 was noted as well as their respective trust regions to move to negative 13C values without a statistical difference when compared to the control group. Regarding that, a plausible argument has not been found, until the moment, to explain such a tendency, since there was no poorer diet in 13C than the vegetable diet. However, there may be metabolic mechanisms capable of promoting that tendency in tibia when a diet more abundant in 13
C is replaced by a less abundant one.
CONCLUSIONS
The application of technique carbon and nitrogen stable isotopes (keel and tibia) can trace the use of VM in feeding broilers when the diet containing that ingredient is part of the feeding throughout the breeding period or, when it replaces a strictly vegetable diet, even at 35 days of age. When a diet containing VM is replaced by a strictly vegetable diet, the animal origin ingredient must take part in the feeding for 28 days or longer, which means that detection is possible with this method. It is only not possible to identify the use of VM in feeding broilers by isotopic analyses of the tissues studied when that
ACKNOWLEDGMENTS
The authors would like to acknowledge the financial support given to this study by the FUNDIBIO, FUNDUNESP, São Paulo, Brazil and Stable Isotopes Center from the Institute of Bioscience, São Paulo State University.
REFERENCES
BELCHIOR, F. Rastreabilidade oficial avícola em discussão. Revista Nacional da Carne 2003;
315. Available:
<http://www.dipemar.com.br/carne/315/materia_ especial_carne.htm. Accessed Jan 2005.
CARRIJO, A.S.; PEZZATO, A.C.; DUCATTI, C. et al. Traceability of bovine meat and bone meal in poultry by stable isotope analysis. Rev. Bras. Cienc. Avic., v.8, p.63-68, 2006.
CERUTTI, M. Rastreabilidade na industria avícola. Avicultura Industrial. v.93, p.32-41,
2002. Available:
<http://www.aviculturaindustrial.com.br/site/din amica.asp?tipo_tabela=cet&id=2164&categoria= processamento> Accessed Jan 2002.
CHOI, W.J.; LEE, S.M.; RO, H.M. et al. Natural 15
N abundances of maize and soil amended with urea and composted pig manure. Plant Soil, v.245, p.223-232, 2002.
CRUZ, V.C.; DUCATTI, C.; PEZZATO, A.C. et al. Influence of diet on assimilation and turnover of 13C in the tissues of broiler chickens. Br. Poult. Sci., v.46, p.382-389, 2005.
DeNIRO, M.J.; EPSTEIN, S. You are what you
eat (plus a few ‰) the carbon isotope cycle in food chains. Geol. Soc. Am., v.6, p.834, 1976. Abstract.
DeNIRO, M.J.; EPSTEIN, S. Influence of diet on the distribution of carbon isotopes in animals. Geochim. Cosmochim. Acta, v.42, p.495-506, 1978.
DUCATTI, C. Isótopos estáveis ambientais. [Apostila]. Botucatu (SP): Universidade Estadual Paulista. 2004. 184p.
GANNES, L.Z.; DEL-RIO, C.M.; KOCH, P. Natural abundance variations in stable isotopes and their potential uses in animal physiological ecology. Comp. Biochem. Physiol., v.119A, p.725-737, 1998.
HANDLEY, L.L.; RAVEN, J.A. The use of natural abundance of nitrogen isotopes in plant physiology and ecology. Pl. Cell Env., v.15, p.965-985, 1992.
HOBSON, K.A.; CLARK, R.G. Assessing avian diets using stable isotopes I: Turnover of 13C in tissues. The Condor, v.94, p.181-188, 1992a.
HOBSON, K.A.; CLARK, R.G. Assessing avian diets using stable isotopes II: Factors influencing diet-tissue fractionation. The Condor, v.94, p.189-197, 1992b.
HOBSON, K.A.; ALISAUSKAS, R.T.; CLARK, R.G. Stable-nitrogen isotope enrichment in avian tissue due to fasting and nutritional stress: implications for isotopic analyses of diet. The Condor, v.95, p.388-394, 1993.
KNOTT, L.; BAILEY, A.J. Collagen cross-links in mineralizing tissues: A review of their chemistry, function, and clinical relevance. Bone, v.22, p.181-187, 1998.
KOHL, D.H.; SHEARER, G. Isotopic fractionation associated with symbiotic N2 fixation and uptake of NO3- by plants. Plant Physiol., v.66, p.51-56, 1980.
LUO, X.M.; FOSMIRE, G.J.; LEACH Jr., R.M. Chicken keel cartilage as a source of chondroitin sulfate. Poulty Science., v.81, p.1086-1089, 2002.
MORAN Jr., E.T. Live production factors influencing yield and quality of poultry meta. In: RICHARDSON, R.I.; MEAD, G.C. (Eds). Poultry Meat Science, Wallingford (OX): CABI Publishing, 1999. p.175-195
OIE-Organização Mundial de Saúde Animal.
2005. Available:
<http://www.oie.int/eng/info/en_esbmonde.htm> Accessed Feb 2005.
PINNEGAR, J.K., POLUNIN, V.C. Differential fractionation of δ13C and 15N among fish tissue: implications for the study of trophic interactions. Funct. Ecol., v.13, p.225-231, 1999.
ROSTAGNO, H.S.; ALBINO, L.F.T.;
DONZELE, J.L. et al. Tabelas brasileiras para aves e suínos. 1.ed. Viçosa (MG): Universidade Federal de Viçosa. 2000. 141p.
corte. 2000. 103f. Tese (Doutorado em Zootecnia) Universidade Estadual Paulista, Jaboticabal, SP.
SAS INSTITUTE. SAS user's guide for windows enviroment. 8nd Ed. Cary, NC, SAS Institute Inc. 1999.
SHOENINGER, M.J.; DENIRO, M.J. Nitrogen and carbon isotopic composition of bone collagen from marine and terrestrial animals. Geochim. Cosmochim. Acta., v.48, p.625-639, 1984.
SLEIMAN, M.; DUCATTI, C.; VENTURINI FILHO, W.G.; SILVA, E.T. Isotopic analysis of carbon (13C/12C) and nitrogen (15N/14N) performed in raw material used for Pilsen beer brewing. V BRAZILIAN MEETING ON CHEMISTRY OF FOOD AND BEVERAGES. São Carlos, Anais São Carlos: Instituto de Química de São Carlos – Universidade de São Paulo, p. 1 -4, 2004.
TIESZEN, L.L. Carbon isotope fractionation in biological material. Nature, v.276, p.97-98, 1978.
TIESZEN, L.L.; BOUTTON, T.W.; TESDAHL, K.G.; SLADE, N.A. Fractionation and turnover of stable carbon isotopes in animal tissues: implications for 13
C analysis of diet. Oecologia, v.57, p.32-37, 1983.
VOGEL, J.C. Variability of carbon isotope fractionation during photosynthesis. In: EHLERINGER, J.R.; HALL, A.E.; FARQUHAR, G.D. (Eds). Stable isotopes and plant carbon-water relations. San Diego: Academic Press,1993. p.29-46.
WERNER, R.A.; SCHMIDT, H.L. The in vivo nitrogen isotope discrimination among organic plant compounds. Phytochemistry, v.61, p.465-484, 2002.