Artículo recibido el 4 de febrero de 2019 y aceptado el 25 de mayo de 2019
ES T U D I O S D E EC O N O M Í A AP L I C A D A VO L. 37-2 2019. PÁ G S. 41-53
ELLIOTT'S WAVE THEORY IN THE FIELD OF
ECONOPHYSICS AND ITS APPLICATION TO THE
PSI20 IN THE CONTEXT OF CRISIS
SANDRA CRISTINA ANTUNES RIBEIRO
OBSERVARE – Observatório de Relações Exteriores, Universidade Autónoma de Lisboa ISCAL- Instituto Superior de Contabilidade e Administração de Lisboa
PORTUGAL
E-mail: [email protected]
ABSTRACT
In the last decades and in the scope of the economic sciences, new interdisciplinary forms have been developed, of which Econophysics stands out. It uses theoretical bases of physics and of statistical physics for the explanation of economic phenomena, particularly financial phenomena. This work shows, through statistical physics, possible forms of chart analysis of a stock exchange index, through the practical application of Elliott’s Wave Theory to the movement of the Portuguese stock index, the PSI20. With the empirical application made to the PSI20, we emphasize the degree of reliability that the Elliott method has demonstrated when applied to large indexes, generating projection scenarios based on patterns of repetitive cyclic behaviour. It is possible, and for several moments, to identify the Elliott wave pattern, namely in the crisis period.
Keywords: Econophysical, Technical Analysis, Elliott’s Wave Theory, Portuguese stock market.
La teoría de las ondas de Elliott en el campo de la econofísica y su aplicación a la PSI20
en el contexto de la crisis
RESUMEN
En las últimas décadas y en el ámbito de las ciencias económicas, se han desarrollado nuevas formas interdisciplinares, de las cuales se destaca la Econofísica. Esta, utiliza bases teóricas de la física y de la física-estadística para explicar fenómenos económicos, y particularmente financieros. Este trabajo muestra, a través de posibles formas físicas de estadísticas, el análisis gráfico de un índice bursátil, realizando la aplicación práctica de la teoría del movimiento de la onda de Elliott del índice bursátil portugués, el PSI 20. Con la aplicación empírica efectuada al PSI20 destacamos el grado de fiabilidad que el método de Elliott ha venido a demostrar cuando se aplica a los grandes índices, generando escenarios de proyección basados en patrones de comportamiento cíclico repetitivo. Es posible, y para varios momentos, identificar el patrón de ondas de Elliott, especialmente en el período de crisis.
Palabras clave: Econofísica, Análisis Técnico, Teoría de la onda de Elliott, mercado de valores portugués.
1. INTRODUCTION
Interdisciplinarity is increasingly being studied and considered relevant. Econophysics is an interdisciplinary area that has for some time been drawing the attention of physicists, mathematicians, and economists. In this context, it is considered that modern physics is related to economics and can offer much to economists. Rosser (2008) argues that econophysics is a recent form of research that analyses economic and financial problems in order to test new approaches derived from physics.
One of the examples of the use of econophysics is in the area of finance. The possibility of bringing together concepts from these areas to explain and even shape the financial market has generated a great deal of interest, especially in contemporary physicists looking for something relatively new and not so much explored as in other parts of physics. In econophysics, the data “command” and distributions are unconditional. For econophysics, the interactions among agents are crucial and, in this way, complex systems with feedback from all kinds and emergent phenomena arise where the whole is different from the sum of the parts.
According to Porto (1975), the relationship between Physics and Economics is old and goes back to the eighteenth century, and relates the beginning of the relationship to Adam Smith - under the impact of the Newtonian revolution - and, according to Plascak et al. (2010), microeconomics and neoclassical theory, under the influence of the statistical mechanics of Boltzmann equilibrium distribution. Not being a new relationship, what has changed with this beginning is the degree of intensity with which the disciplines are being worked together.
Capital markets are now an irreplaceable and growing element in any modern, competitive economy. The Portuguese capital market has been following these transformations, having evolved significantly over the last decade and a half. There are countless innovations of an organizational, technological and regulatory nature that have transformed an insipid and peripheral market into a recognized developed one.
The analysis of the behaviour of securities on stock exchanges, in terms of quotations and traded quantity, gives us an idea of the degree of liquidity of the shares, a factor that has to be closely examined, given that, at any moment, there may be an opportunity for entry to and/or exit from the market. However, the liquidity analysis of stocks should be complemented by an in-depth analysis of the evolution of their prices. This analysis is called “Technical Analysis” and it seeks to predict the future evolution of prices using past information on the market prices or volumes of the assets transacted.
Technical analysis, also known as charting, consists of the visual identification of geometric patterns or trends, which allows investors to anticipate a future price movement.
In the 1930s, Ralph Nelson Elliott found that prices fluctuated according to wave behaviour. In his view, these waves are repetitive in their form, but not necessarily in relation to time or amplitude. Elliott referred to eight of these movements, or waves, which repeat themselves frequently. He gave a name, illustrated and defined each of these oscillations. He then discovered how they related to each other to form larger versions of themselves. He called this phenomenon “The Wave Principle”.
In the last two decades, the number of publications on the subject of “Technical Analysis” has been increasing, although with divergent results over time: after finance theory, which has the hypothesis of the efficiency of the markets as one of its main paradigms, having prevailed at first, in the last years several articles and research works have disagreed with the first publications. Their results have presented significant statistical evidence of forecasting power for future market price movements.
At international level, this is a topic that has always accompanied the capital markets and has led to several discussions between the proponents of technical analysis on the one hand, and the academics on the other, and there is still no unanimous conclusion about it. However, in Portugal few academic studies have focused on technical analysis, and even fewer have approached the “Elliott’s waves” topic, which makes it an underdeveloped object of study in the Portuguese academic environment.
Based on the assumption already proven by the abundant literature that Elliott's Wave Theory is a reference theory in the analysis of financial markets, this study is based on the analysis of its adherence to the Portuguese stock market and intends to analyse its possible existence.
I believe that there is a shortage of studies that scientifically prove the applicability and benefits of using this theory, although, as already mentioned, being a widely used theory in the main world stock markets, it is very little used in Portugal, which justifies my choice of topic.
All techniques for evaluating financial assets, whether mathematical or graphical, are based on the premise of the hypothesis of market efficiency. However, the coherence between actual and expected movements does not always occur, which leads us to conclude that there are exogenous factors that influence them and which, at the outset, are not measurable. However, the fact that there are past graphical patterns that reproduce the same pattern in the present gives rise to the signalling of trends, which leads to the challenge of possible distortions.
1.1. Purpose of the study
In the financial sphere, the main objective of econophysics is to model the stock market as accurately as possible. Based on past events and statistical physics, we try to “predict” what will happen in the future. This work has the objective of showing, by means of statistical physics and computational simulation, the technical analysis and how these possible analyses can be conducted, and provide a more complete analysis of the PSI20 index for investors.
Accordingly, we intend to answer the following questions:
• Is it possible to identify Elliott’s wave pattern in the Portuguese stock market, in particular in the PSI20 index during a crisis period?
• Is it possible to use Elliott’s Wave theory to make forecasts in the Portuguese stock market? For economists, understanding the objective signal that a “bubble” is forming is difficult, and preventing a crisis is even more complicated. It is in this sense that econophysicians research and work in the financial market, namely at the level of speculative bubbles and stock market crashes. Gopikirishnan (1999), Liu (1999) and Nascimento (2007) are examples of this.
Farmer and Foley (2009) argue that the recent 2008 crisis has created a general feeling among the public that the economy is not a well-developed science. However, the economists do not seem to agree with this view. Gitlin (2012) notes that after the crisis, the “economic science” was more concerned with protecting itself from outside attacks. Several argue that the main lesson that should have been drawn is the need to redirect the conventional economic approach to the study of group behaviour. This is what physics does, and it is at this point that econophysicians defend that complementarity can exist: by adopting a rather different approach focusing on macro systems analysis consisting of a large number of heterogeneous micro units.
2. ECONOPHYSICS AND TECHNICAL ANALYSIS
Yakovenko (2008) argues that econophysics, among other disciplines that form part of the range of interdisciplinary sciences, has emerged as an interdisciplinary research field that uses methods, tools and ideas derived largely from statistical physics to solve problems in economics and finance. Statistical physics studies systems composed of a large number of individuals interacting with each other, for whom it would be impossible to attempt to predict the behaviour of each individual considered in isolation. One of the goals of statistical physics is to find universal laws that govern the common behaviour of systems, being to some extent independent of the individual behaviour of each of its members, which in economics we can identify as agents. In this scheme, in addition to microeconomics, macroeconomics too, and especially finance, can be understood as complex systems. For example, considering these microscopic interactions among agents and their characteristics for physicists, the energy market can be described with the tools of statistical physics, which has provided some explanations of the collective behaviour of large particle conglomerates. The comparison between the transactions of consecutive days gives the idea of the fluctuation of the market, and this percentage variation characterizes the behaviour of the stock market. Accordingly, these markets are considered to be open systems where their elements are related following patterns of non-linear feedback and other common characteristics, through which it is possible to explain some phenomena that happen to the financial time series.
The supporters of econophysics claim that this discipline uses a more adequate procedure than those used by econometrics or by disciplines more familiar with economic facts, arguing that these phenomena are considered from a comparative perspective that seeks common sense empirical regularities with the purpose of providing a theoretical framework and not the opposite. The systemic approach allows global analyses that take into account the flows that cross the economic system and help to identify individual dynamic models.
With the huge amount of data available in the field of finance, especially from the stock markets, it is to be expected that this part of economics is the one that has interested econophysics the most.
From the beginning of the twentieth century, the procedures for the study of stock market movements started to be differentiated, in terms of fundamental analysis and technical analysis. While the proponents of fundamental analysis consider all the relevant factors that affect the price of a security to determine its theoretical (intrinsic) value and act, by buying or selling it, according to whether the price differences and value are negative or positive, respectively; the advocates of technical analysis study the market price of a security on the basis of supply and demand, which in turn are affected by more or less rational factors, based on graphic price recording and the use of repetitive behaviour rules, in order to determine the future evolution of that security.
According to Boainaim and Pereira (2009), this analysis presupposes that the market agents determine the prices of the assets. Thus, analysts try to understand how most agents behave in certain situations.
Technical analysts base their decisions on the study of “market psychology”, because they argue that investors react exaggeratedly when they are confronted with the arrival of new information to the market. Thus, price trends tend to require some persistence over time.
The “Technical School” is divided into two theoretical currents: one considers the capital market to be efficient (random walk analysis) and another thinks that the capital market is inefficient (technical analysis and an idea also defended by econophysicists).
Artus (1995) relates these two groups and concludes that if a market shareholder group is made up of investors who base their decisions on the fundamental value and also of technical analysts, there will be a strong possibility of speculative bubbles occurring, given the buying (or selling) behaviour that will be generated by the technical analysts in the presence of expectations, thus enabling a gain.
The fundamentalists, by trading with an expectation of price evolution contrary to that of the technical analysts, will suffer losses, which will make them switch to the technical analysts group, which will stimulate the development of the speculative bubble.
Considering that capital markets generally have inefficiencies (an idea also defended by the econophysicians), and that the series of quotations are sequentially dependent, most analysts who study these matters favour the second theoretical current, which corresponds to the technical analysis in its essence and it is how it is presented today.
Due to the intense use of price and volume charts, this type of analysis is also known as chart analysis, but we must remember that technical analysis is not just about reading charts.
According to this “school”, the prices of the assets adjust to the content of the information, but not immediately. The price adjustment goes through a series of steps, depending on the behaviour of the “well informed” groups (insiders) in the process of disseminating relevant information.
The pioneer of this technique was the American Charles H. Dow. He published his theory for the first time in 1884 and the New York Stock Exchange index is called “Dow Jones” in his honour.
One of the most precise definitions of Technical Analysis is the one presented by Pring (2002), who states that: “The technical approach to investment is essentially a reflection of the idea that prices move in trends that are determined by the changing attitudes of investors toward a variety of economic, monetary, political, and psychological forces. The art of technical analysis, for it is an art, is to identify a trend reversal at a relatively early stage and ride on that trend until the weight of the evidence shows or proves that the trend has reversed”.
Thus, we conclude that Technical Analysis exists with the main objective of determining the direction in which prices move.
Many studies have been conducted in order to gauge the quality of the information coming from Technical Analysis. Thus, Rubio (2004) analysed the potential profitability of technical analysis applied to the foreign exchange market, testing eight simple trading rules in five markets. According to Allen and Taylor (1992) and Mole and Yu-Hon (1998), technical analysis is used by about 90% of investors as a method of forecasting market trends.
Many studies have been done to validate the rules used by technical analysts. Silva (2001) argues that if “the rules used by technical analysts are based on the attempt to detect patterns in the past evolution of the stock price, then if we test these same rules in historical series of stock prices we are skewing the test in the sense of accepting the effectiveness of those rules”.
As a result, Brock, Lakonishok and LeBaron (1992) attempted to circumvent this problem by using a very long price series (Dow Jones Industrial Average from 1897 to 1986) in order to test a broad set of rules and, thus, confirm the robustness of the results.
With the technological innovation, new methods have emerged. Allen and Karjalainem (1999) used genetic programming as an optimization method with the objective of finding a solution to a given problem starting from a set of functions considered to be relevant.
Over time, technical analysis has developed using various statistical and mathematical indicators, always aiming to find patterns and trends in the financial markets. At the end of the twentieth century, it was already well known that the technical analysis uses historical data to analyse price oscillations, mainly through chart analysis.
At the beginning of the 21st century, Silva (2001) became one of the first authors to test the application of a set of rules and strategies using the following technical indicators:
Moving Averages and Supports and Resistances, usually used by technical analysts in the Portuguese stock market. In this paper, the author used a historical series of the BVL General index for the period between 5 January 1988 to 29 December 2000. The results show that the use of trading strategies in this index after deducting transaction costs of 05% guarantee an annual profitability of 5.98%.
However, Neely (2002) states that the technical school has been the target of scepticism when its applicability to the market is analysed. He also points out that if we accept that the technical school has forecasting capacity, thus generating returns above the market level, it contradicts the hypothesis of efficient markets.
Saffi (2003) states that technical analysis uses the stock prices (opening, closing, average, minimum or maximum) that occurred in the past in order to generate signals to buy and sell financial assets. These are the quotations that represent the data source to calculate the indicators inherent in the technical analysis.
Park and Irwin (2004) empirically analysed the “profitability” of technical analysis through direct research of market participants. They concluded that between 30 and 40% of participants in the futures and exchange market argue that technical analysis is important to determine prices over a half-year time time span.
Recently, Osório (2010) tested two of the most widely publicized technical analysis strategies, the Moving Average Convergence Divergence and the Relative Strength Index indicators. The study was applied to the PSI 20, for a time series from 1 January 2001 to 31 December 2009. The results indicate that an investment strategy based on the use of Moving Average Convergence Divergence appears to be capable of systematically obtaining good results. However, the same does not happen with the strategy based on the Relative Strength Index, which was unable to overcome the buy and hold strategy.
Bouchaud (2008) studied the fluctuation of 893 stocks between August 2004 and 2006 and was unable to identify any relationship between relevant news and most price jumps, suggesting that price fluctuations in general have almost nothing to do with news external to the market. He defends that these abrupt jumps, with no apparent cause, provide further evidence that the market is a complex system.
After analysing the behaviour of gas and comparing it with its behaviour in phases, such as that of the financial bubbles, Sornette and Zhou (2002) decided to analyse data about stock prices on the stock exchange. The analysis of several price series showed that the Gaussian distribution actually underestimated the occurrence of large fluctuations. The curve that best described price fluctuations seemed to be a “power law”, the hallmark of a complex system.
Bouchaud (2008) believes that the emphasis on observation and description of phenomena, sacrificing the mathematical rigour of their theories, at least in the first instance, is the greatest contribution physics can make to economics. He points out that: “Physics has its own way of constructing reality models based on a subtle blend of intuition, physical analogies and mathematical treatments, where the vague concept of plausibility may be more relevant than the accuracy of predictions”.
3. ELLIOTT’s WAVE THEORY
Elliott's theory, commonly known as Elliott's Wave Theory, was created by Ralph Nelson Elliott (1871-1948). During his lifetime, Elliott established several contacts with several leading analysts, such as Charles Dow and Charles J. Collins who, in partnership with Dow, was the publisher and founder of the weekly national stock market newsletter. With the development of his study, in 1938 he wrote the book called “The Wave Principle”.
We can easily see that Elliott's theory is embedded in technical analysis and that its development comes from observation and study of the past. There are several views on how to approach and interpret Elliott's theory. Currently, there are more proponents of, than opponents to, this theory. A good example is Robert Precheter (2002), a major supporter of Elliott’s Wave Analysis.
The supporters of Elliott's theory argue that the market already gives enough information on the evolution of companies through the charts (purely technical view) and that the rest of the information (macroeconomic analysis, etc.) is included in the chart.
Opponents to Elliott's theory (analysts who resort to fundamental analysis more) claim that it is a poorly defined theory and that it has too many variables. When they refer to “poorly defined”, they refer to the lack of precision used by Elliott in some respects, for example, time (an aspect he always referred to in a vague and not concise manner).
There is software on the market that is useful to define and analyse Elliott's theory. Any chart analysis programme (Mestastock, Omega, Computrac, for example) can also be useful to understand the wave formation and its beginning.
The main objective of Elliott’s Theory is to clarify the study of the Stock Exchange through technical analysis. Despite being one of the best forecasting tools, the Waves Principle is not primarily a forecasting tool: it is a detailed description of the markets' behaviour. In all senses, this description encompasses a great deal of information about the market’s position within the continuous behaviour, and therefore of the possible trajectory that it can take.
According to the Wave Principle, all market decisions are generated by meaningful information and also generate important information. Each transaction, once it produces effect, will form a feedback loop that is driven by the social nature of men, and thus the process will generate patterns. Given the fact that the patterns are repetitive, they have prediction value.
Sometimes the market reflects external conditions and events, but at other times it is totally independent of what most people assume to be causal conditions. This is because the market has its own laws, that is, it is not driven by linear causality. The market is not the “cyclic rhythmic machine” that some say it is. Its movement reflects a repetition of movements that is independent of both presumably causable events and periodicity. The progression of the market is expressed in the form of waves, which are models of directional movements. More specifically, a wave is any of the models that occur naturally.
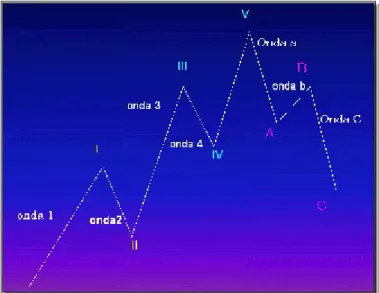
Elliott argues that the stock market behaves according to a basic rhythm (figure 1), or behaviour of five rising (impulse) waves and three descending waves, to form a full eight-wave cycle. As we shall see below, the three descending waves are called “corrective waves” of the five impulse waves. The following figure shows the basic concept of the five waves, towards the main tendency, followed by the three corrective waves.
Figure 1 – Behaviour of the Five Elliott Waves Author’s own chart
Waves 1, 3 and 5 are called impulse waves and waves 2 and 4 are called corrective waves. Wave 2 corrects wave 1, wave 4 corrects wave 3, and the complete sequence 1, 2, 3, 4, 5 is corrected by sequence a, b, c. Accordingly, a complete cycle, which is composed of eight waves, is formed by two distinct phases: the phase of numbers, known as “five waves” and the phase of letters, called “three waves”.
After this cycle, a second similar cycle of five waves will start, followed by another set of five corrective waves. This will give rise to the third and final “advance” which consists of five impulse waves. At that moment, a greater rising movement of five waves has been completed and a greater descending movement of three waves has been produced. These three larger rising waves “correct” the full movement of the five rising waves. Each of the “phases” of letters and numbers is actually a wave, but of a greater degree than the waves that make it up.
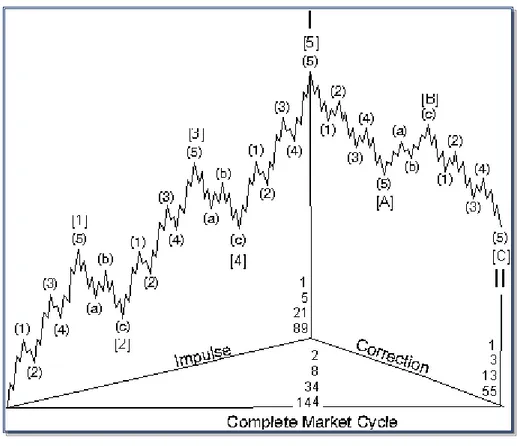
This composition is illustrated in the following figure (figure 2), which shows two large degree waves “dismembered” into eight small degree waves, and these eight small degree waves can in turn be subdivided, in exactly the same way, to produce thirty-four waves of the next smaller degree.
The Elliott’s Wave Principle claims that any type of wave, in any series, can be subdivided and further subdivided into smaller degree waves, or conversely, expand the larger degree waves. Thus, we can use Figure 2 to illustrate two waves, eight waves, or thirty-four waves, depending on what we are referring to.
Figure 2 – Elliott’s Waves Full Cycle Source: Precheter (2000)
In the figure presented earlier [1] and [2] represent two waves, one of upward trend and one of downward trend, respectively. (1), (2), (3), (4), (A), (B), (C) form a set of 8 waves, already presented previously, as the set of the five main waves and three corrective waves. 1, 2, 3, 4, 5, A, B, C, etc. represent a set of 34 waves in total.
The corrective pattern (A) - (B) - (C), illustrated as wave [2] in figure 3, is subdivided into a 5-3-5 pattern. When analysed in detail, it is easy to see that the wave has exactly the same shape as wave [2]. In the same way, we note that waves (1) and (2) adopt the same form as waves [1] and [2]
Figure 3 – Complete Market Cycle Source: Precheter (2000)
Elliott designated, with exact names, each of the nine categories of waves, of varying degree, from the smallest wiggle on an hourly chart to the largest wave he could assume existed from the data then available.
The designations are as follows: Grand Supercycle, Supercycle, Cycle, Primary, Intermediate, Minor, Minute, Minuette, Subminuette.
It should be noted that only the larger classifications, Grand Supercycle and Supercycle, are used nowadays in the sense in which Elliott created them.
4. APPLICATION OF THE ELLIOTT’s WAVES THEORY TO THE PSI20
Next, we will examine the Portuguese stock market through its PSI20 index and analyse the possible existence of a relationship between the latter's movement and Elliott's wave theory.
Many studies have already been carried out in this area: Barandalla (2001) related the IBEX35 movement with Elliott’s wave theory; Hayashi (2002) also studied this theory, having recorded movements that occur more frequently after each type of pattern. From this conclusion, he elaborated a conjecture: “from historically established correspondence between patterns and future events of greater probability of occurrence, one can predict the movements of prices in the financial markets after the end of a legitimate Elliott standard or after the conclusion of a phase of a pattern”.
Neely and Hall (1990) emphasize the “lack of practical examples of the clear and safe application of the real-time method, i.e. Elliott’s method, which actually functions in the real graphs of the world’s
financial markets”. They also argue that more specific guidelines will only be reached after many experiments, which will lead to many transaction losses on the part of those who are starting (and gains by experienced professionals) or to the heavy cost paid regarding the experience gained by the authors.
In this study, the closing prices of the PSI20 were used from January 1993 to June 2012.
Euronext publishes the indices covering most national and European indexes. These reflect the performance of their stock exchanges and reflect investors' view of the market.
The PSI-20 is the index of the Portuguese stock market, established in 1992 and functioning as an “indicator of excellence” of the national stock market.
The PSI - 20 is calculated based on the market capitalization of all companies with shares admitted to trading on the Lisbon-Porto Stock Exchange, and this calculation is adjusted by the payment of dividends of the companies.
As mentioned earlier, many changes have occurred in the Portuguese stock market in recent times. All these changes, whether economic, political or social, had an impact on the activity of the Portuguese stock market and, consequently, influenced the evolution of the Portuguese stock market index, in particular the last crisis.
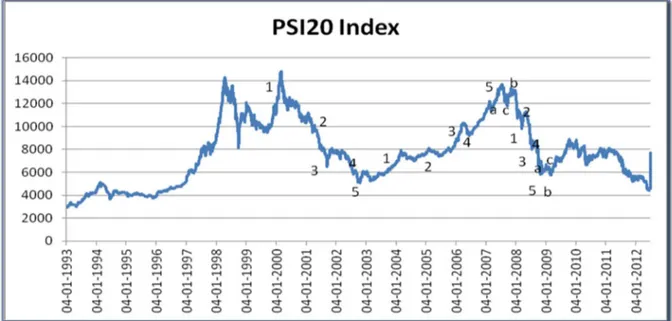
Let us start by analysing the daily movements of the PSI20 index from 2 January 1993 to 29 June 2012, in order to encompass the period of the 2008 crisis.
When we tried to identify the wave motion in the PSI20 behaviour, we were able (even in an excel chart) to identify the 5 trend waves and the 3 corrective waves (as shown in figure 4).
Figure 4 – Elliott’s Waves in the PSI20 Author’s own chart
In 1993, there was a large inflow of foreign capital, mainly due to the regulation of capital movements and the ratification of the Maastrich Treaty, which allowed a recovery of the markets, resulting in a growth of 42.9% in the PSI20.
Although there were small losses in the following years, the market recovered again in 1996. According to Miralles and Miralles (2003), this situation was mainly due to the “constant drop in interest rates and lower public expenditure, as well as the good performance of the variables that determined the convergence criteria defined to ensure the integration of Portuguese currency into the group of currencies of of the Euro”.
In 1997, there was a great increase in market dynamics, 1998 being a year of great volatility, mainly due to the crises felt in Russia and Latin America and due to the markets’ recovery after the crisis in Asia.
In 1999, the market increased by 26.1%, with an increase of 56.25% in 2000, and the impact of the remarkable growth of the American economy was felt. It should be noted that in 2000 we began to feel the crisis provoked by the technological companies of the United States.
In the following years, and until 2003, there was a great deal of volatility, again as a result of the instability caused by the Gulf War that began in 2003 and later on by the September 11, 2011. The 2004 to 2007-2008 period was characterized by a period of recovery, characterized by the “subprime bubble” in that it was feeding mortgage credit. This feature of the subprime in the PSI20 has a special relevance/weight, since this index had 4 banks, 3 construction companies and CIMPOR, which represent almost half (40%) of the total companies listed in the index. It should be noted that banking alone accounted for more than 60% of the index.
The reasons for this rise are the same as those that justify the decline in the following period, given the so-called subprime crisis.
There was a slight rise in 2009 due to sectors that continued to have movement in the market as a result to their constant importance to the Economy, as, for example, the food and pharmaceutical sectors. However, it is worth highlighting some situations, because although we can identify the main waves, not all the details in the characteristics of each one are observed. According to Luís Correia Tavares (technical analyst), this situation is due to the fact that the Portuguese market is not very liquid and has little volume, a situation that worsened when the Portuguese economy was considered “junk”, which made it impossible for some funds to invest.
As Elliott argued, the closing quotations and the logarithmic scale are always taken into account. Although it is different from the one used when making decisions in the market, Elliott defends the use of this scale because, in his opinion, it gives more importance to the oscillation of the price itself than to the linear one. He argued that this scale, with all its characteristics and being expressed in percentage terms, allows a greater adjustment of the movement to the time factor.
Another reason for this choice is the fact that on a linear scale, the percentage changes are not so clear and price may imply that it takes a lateral price path. On a logarithmic scale, this percentage evolution is clear, so we can conclude whether a wave is strong or weak. Thus, we detect if this wave loses strength and is approaching its end before returning, since its evolution begins to be negative.
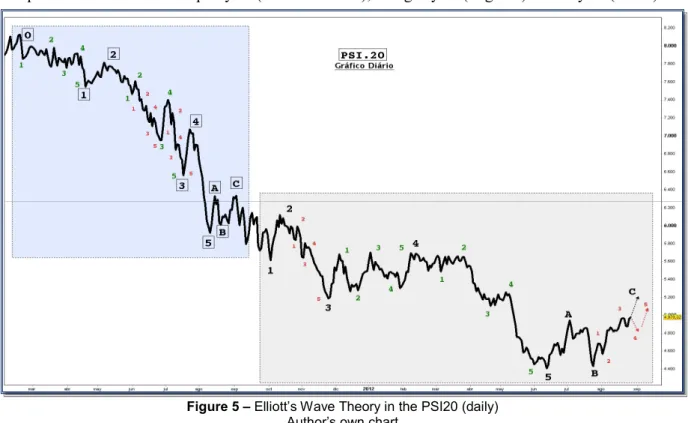
Analysing the movement of the PSI20 index in the last two years, and as can be seen in figure 5, we were able to identify two distinct periods (represented in the figure with the two squares). In each of the periods we identified a supercycle (shown in black), a large cycle (in green) and a cycle (in red)
Figure 5 – Elliott’s Wave Theory in the PSI20 (daily) Author’s own chart
The division in these two periods occurs when the question arises whether the fifth wave of the first period would end where the third wave of the second period is, or not. However, we easily conclude that it cannot be so, for two reasons:
First, wave 3 has to be more extensible than wave 1 and wave 5,
Second, due to the law of alternation (since we have an elongated graph in time, we can use it to help order the cycles), which states that wave 2 and 4 cannot be equal, i.e. if wave 2 is complex, wave 4 is simple and vice versa.
The same analysis was done with the quarterly observations (figure 6). In this case, it is not possible to identify the A-B-C correction, which does not mean that it does not exist. However, due to the periodicity used, it is not visible.
As mentioned previously, and although we can identify Elliott’s waves in the PSI20 index movement, these conclusions are not as accurate as in other markets with more volume, and sometimes not all the requirements/characteristics of all waves are fulfilled. The fact that the market is not very liquid and does not have many players also causes this situation.
5. CONCLUSIONS
Econophysics is an interdisciplinary area whose contribution to the area of finance is a fact, proven by the studies already carried out in various topics, such as market predictability, rare event analysis, bubble and crash mechanisms, risk analysis, investment strategy, and stochastic simulations of financial series, among others.
Technical analysis aims to obtain the future evolution of the market value of any asset, although it has the restriction that it has to be transacted in the stock market, limiting its use to listed companies. At theoretical level, technical analysis finds its support in the violation of the principle of random evolution of the prices of the assets, which stems directly from the theory of market efficiency, an idea also defended by econophysicians. In this context, it has also been proven that Elliott’s wave principle does not find scientific support in the traditional hypothesis of market efficiency.
The Elliott’s Wave Principle is, in essence, a system of rules derived empirically to interpret the action of the main movements of the stock market. Transacting using the Elliott Wave patterns is quite simple. All is needed is to identify the main wave or the supercycle, and start by going long and then sell or become short when the inversion is determined. This posture is continued as the cycles are shortened and completed until the main wave resurfaces. This is a point that causes some divergence among technical analysts, because the difficulty often lies in identifying the cycles where the market is. Elliott's analysis is increasingly used by market players, especially in the projection of main waves.
It should be noted that the adjustment of Elliott's theory to the evolution of the market, especially of a “small size and small liquidity” market, is defended by Dow and Elliott, and it only “happens” afterwards, that is, only after we have information about the market evolution it is possible to analyse the existence of its adaptability.
Thus, in order to conclude, with respect to the first question (“Is it possible to identify the Elliott Wave pattern in the Portuguese stock market, in particular the PSI20 index during a crisis period?”) and given that the Portuguese market is small, the totality of the theory is not adapted to the market. The Elliott’s Theory adapts to the Portuguese stock market, but all the specific requirements inherent in it are not present.
As shown above, and in the case of the Portuguese market, in all 5 waves we could not identify some details regarding waves a, b and c and the wave extension in this market is not what the theory states.
This does not mean that this theory is not adequate in the presence of others. Rather, it is part of them, because, although sometimes it seems there are contradictions, by studying the subject in-depth one concludes that it is difficult to identify, or it is interpreted differently, which makes it difficult to interpret the various charts.
Figura e - Elliott’s Wave Theory in the PSI20 (quarterly) Author’s own chart
As we concluded in the practical application made to the PSI20, in the Technical Analysis in general and in Elliott’s Wave Theory in particular, nothing has to be 100% true. The goal is to obtain a statistic with positive mathematical hope. This means that if a market investor is faithful to a technique or strategy and disciplined in its modus operandi, the outcome is usually positive. The main objective is always to obtain a result based on a strategy with positive mathematical expectation.
Thus, in order to answer the question “Is it possible to use Elliott's Wave theory to predict the Portuguese stock market?”, it must be pointed out that, as we saw in the empirical application to the PSI20, fictitious scenarios are always constructed, because one cannot guess the future.
However, the degree of reliability that the Elliott’s method has demonstrated when used in large indices (not the case of the PSI20), generating projection scenarios based on patterns of repetitive cyclic behaviour, should be emphasized.
It is possible to conclude that despite the noticeable change in behaviour in chart terms, of the index in the crisis period and the beginning of the post crisis, some lack of detail in the adherence is mainly due to two factors: first, the fact that the Portuguese market is not very liquid and second, at that time Portugal was considered to be junk.
Thus, in future, we intend to detail all the characteristics of the waves that do not occur and to detail the adaptability of the theory to the PSI. Thus, deepening this research is therefore recommended by using a longer time frame and even considering in detail the comparative analysis to another index, using neuroeconomics psychology associated with changing market position values.
REFERENCIAS BIBLIOGRÁFICAS
ALLEN, F e KARJALAINEM, R. (1999). “Using genetic algorithms to find technical trading rules”, Journal of Financial Economics 51, 245-271.
ALLEN, H. e TAYLOR, M. (1992). “The Use of Technical Analysis in the Foreign Exchange Market”, Journal of International Money and Finance, Vol. 11, 3, pp. 304-14.
ARTUS, P. (1995). Anomalies sur les marchés financiers, Ed. Economica.
BOAINAIM, P. and PEREIRA, P. (2009). “Ombro-Cabeça-Ombro”: Testando a Lucratividade do Padrão Gráfico de Análise Técnica no Mercado de Ações Brasileiro” MPRA Paper 15653.
BOUCHAUD, J.P (2008). “Economics need a scientific revolution”. Nature, vol 455.
BROCK, W; LAKONISHOK, J and LEBARON, B; (1992). “Simple Technical Trading Rules and the Stochastic Properties of Stock Returns”; The Journal of Finance.
ELLIOTT, R.N. (1994). The Wave Principle, reprinted in RR Prechter Jr. , Ed., R. N. Elliott's Masterworks , New Classics Library, New York.
FARMER, JD; and FOLEY, D (2009). “The economy needs agent-based modelling”, Nature 460 (7256), 685-686. GITLIN (2012). “Have economists learned from the Great Recession?” The Chronicle of Higher Education
Magazine, June 12.
GOPIKIRISHNAN, P.; PLEREU, V.; AMARAL, L.; MEYER, M. and STANLEY, E. (1999). “Scaling the distribution of price fluctuations of individual companies”, Physical Review E – Statistical Physics, Plasmas, Fluids,
and Related Interdisciplinary Topics, 60(5), 5305-5316
HAYASHI, A. (2002). Aplicação dos fractais ao mercado de capitais utilizando-se as Elliott Waves, Master Degree Dissertation, Universidade Federal de Santa Catarina.
LIU, Y; GOPIKIRISHNAN, P.; CIZEAU, P.; MEYER, M.; PENG, C. and STANLEY, H. (1999). “Statistical properties of the volatility of price fluctuations”, Physical Review. E, 60(2): 1390-1400.
MIRALLES, J., MIRALLES, M., (2003). La eficiência de la Bolsa de Valores de Lisboa y Porto. Mérida: Editora Regional de Extremadura.
MOLE, L.; YU-HON and MOLE, D. (1998). "The use of fundamental and technical analyses by foreign exchange dealers: Hong Kong evidence," Journal of International Money and Finance, Elsevier, vol. 17(3), pages 535-545, June.
NASCIMENTO, Jr; FULCO, U; and LYRA, M; SERVA; M and VISWANATHAN, G. (2007). “Porque as bolsas de valores quebram: a origem das caudas grossas nas distribuições de retornos”. Revista Brasileira de Ensino de Física, 29: 341-346.
NEELY, G.; HALL, H. (1990). Mastering Elliott Wave: Presenting the Neely Method: The First Scientific, Objective Approach to Market Forecasting with the Elliott Wave Theory. Brightwaters, NY: Windsor Books.
NEELY, G. (2004). Dominando la Onda de Elliott, Gesmovasa.
NEELY, C.J. (2002). “The temporal pattern of trading rule returns and exchange rate intervention: Intervention does not generate technical trading profits”. Journal of International Economics, 58,211-232.
OSÓRIO, J. (2010). A Análise Técnica e o Mercado Português: MACD e RSI, Cadernos do Mercado de Valores Mobiliários no.35.
PARK, C. and IRWIN, S. (2004). The Profitability of Technical Analysis: A Review. AgMAS Project Research Report No. 2004-04.
PORTO, C. H.(1975). História do Pensamento Econômico. Editora Rio.
PLASCAK J. A.; OLIVEIRA P. M. C.; FIGUEIREDO W. (2010). Documento de Área – Física Estatística e Computacional. Sociedade Brasileira de Física. Rio de Janeiro.
PRECHTER, A. J. F (2002). El Principio de las Ôndas de Elliott, Gestión 2000.com.
PRING, M. (2002). Technical Analysis Explained: The Successful Investor’s Guide to Spotting Investment Trends and Turning Points, New York: McGraw-Hill, 4th Edition
ROSSER Jr, JB (2008). Econophysics, in The New Palgrave Dictionary of Economics, Second Edition, Durlauf SN, Blume LE, eds., Palgrave Macmillan: Basingstoke.
RUBIO, F. (2004). Technical Analysis On Foreign Exchange: 1975-2004, Universidad de Valparaíso, Chile. SAFFI, P. (2003). “Análise técnica: sorte ou realidade?”. Rio de Janeiro. FGV, Revista Brasileira de Economia, vol.
57, n. 04.
SILVA, N. (2001). “Eficácia da análise técnica no mercado accionista portugués”, Estudos do GEMEF; 9/01, Coimbra: FEUC
SORNETTE, D. and VANNESTE, C. (1992). “Dynamics and memory effects in rupture of thermal fuse networks”, Physical Review Letters 68 (5) 612-615.
SORNETTE D. and ZHOU, WX. (2002). “The US 2000-2002 market descent: How much longer and deeper?” Quantitative Finance 2 (6) 468-481.
YAKOVENKO, V. (2008). Econophysics, statistical mechanics approach to, encyclopedia of complexity and system science. Springer