BJRS
BRAZILIAN JOURNAL
OF
RADIATION SCIENCES
08-01 (2020) 01-17 ISSN: 2319-0612 Accepted: 2019-12-17Patterns and trends of pediatric and young adult
computed tomography use in Brazil: 2008-2014
Dovales
1,11A.C.M., Chaves
2T.O., Bahia
3P.R.V., Schaefer
4M.B., Failla
5B.B., Suzuki
6L., Valente
7M., Gomes
8V.A., da Rosa
1L.A.R., Pearce
9M.S.,
Veiga
1,10L.H.S.
1Institute of Radiation Protection and Dosimetry, Brazilian Nuclear Energy Commission, 22783-127, Rio de
Janeiro, RJ, Brazil
2 Rede D’Or São Luiz, 20941-150, São Cristovão, Rio de Janeiro, RJ, Brazil 3 Centro Estadual de Diagnóstico por Imagem, 20210-030, Rio de Janeiro, RJ, Brazil
4 Sonitec Diagnóstico Médico por Imagem, 88015-340, Florianópolis, SC, Brazil 5 Hospital Israelita Albert Einstein, 05652-900, São Paulo, SP, Brazil
6 Hospital Infantil Sabará, 01227-200, São Paulo, SP, Brazil
7 Departamento de Pediatria, Faculdade de Medicina, Universidade de São Paulo, 05403-900, São Paulo, SP, Brazil 8 Hospital da Criança de Brasília José de Alencar, 70071-900, Brasília, DF, Brazil
9 Institute of Health & Society, Newcastle University, NE1 4L, Newcastle upon Tyne, UK
10 National Cancer Institute. Division of Cancer Epidemiology & Genetics, Radiation Epidemiology Branch, 20892,
Bethesda, Maryland, USA
Dovales et al. Braz. J. Rad. Sci. ● 2020 2
ABSTRACT
Computed tomography (CT) is an indispensable imaging technique, but radiation exposure from CT scans is of concern mainly due to the potential risk of developing cancer, mainly in children. Our group recently showed that CT use has greatly increased among outpatients using the Brazilian public health system (SUS) between 2001 and 2011. Further, CT examinations among patients younger than 20 years of age represented around 13.4% of all CT examinations in SUS between 2008 and 2011. In comparison, these examinations represented around 8% of the overall number of CT scans in a private hospital in Rio de Janeiro between 2005 and 2015. In this paper we extended the evaluation of pediatric and young adult CT use in Brazil to 25 private CT services in 8 Brazilian cities for the period 2008-2014. Data from SUS was updated to this period. Information about CT use in SUS was obtained from an online database. Data on the privately funded setting was retrieved from the Radiological Information Systems (RIS) of each CT service. Patients younger than 20 years of age underwent around 8.9% of the CT procedures in the private setting, while in SUS this proportion was around 12.7% in the same period. Pediatric and young adult CT greatly increased in both healthcare systems, but annual growth rates were less pronounced in the private than in the public healthcare system. One third of the patients in the private setting had more than one CT examination over the period investigated.
Keywords: Computed tomography, pediatric, Brazil, ionizing radiation, SUS
INTRODUCTION
The benefits of computed tomography (CT) imaging to diagnosis and management of a number of diseases are well known [1]. However, there are concerns about the potential risk of developing cancer following radiation exposure from CT scans [2-5]. Actually, epidemiological studies using empirical data have reported increased cancer risk following CT scans in childhood or adolescence [6-10].
Cancer risk following radiation exposure depends on the patient age, gender, and organ/tissue radiation absorbed doses [11, 12]. A number of studies have assessed pediatric CT patterns, trends and doses in many parts of the world [5, 13-22], but information is very limited in less resourced countries [23-26].
We have previously shown [27] that pediatric and young adult examinations (<20 years) represented around 13% of the more than 8 million CT procedures underwent by outpatients of SUS
- the public healthcare system of Brazil [28] - between 2008 and 2011, when CT usage increased by 13% per year. Another study [29], focused on CT procedures in a single private general hospital in the city of Rio de Janeiro, reported that patients below 20 years of age underwent around 8% of all CT examinations performed between 2005 and 2015, with an annual increasing rate of 10%.
Although about 75% of the Brazilian population depends on the public healthcare system, most of CT machines in Brazil were in the private setting (around 54% of 2,049 existing CT machines) [27]. Therefore, differences in CT usage between the public and private healthcare system in Brazil might occur and should be evaluated.
The observed high proportion and the rapid increase of pediatric CT usage in the public healthcare system deserve attention and reinforce the need to evaluate in detail the CT use among children and young adults in the private setting in Brazil. The aim of this study was to extend our previous evaluation of pediatric CT usage in the public healthcare system to include 25 private CT services in 8 Brazilian cities from 2008 to 2014. For comparison, we also updated data on CT usage from SUS to the same study period.
MATERIALS AND METHODS
As previously described [27], data on CT use among outpatients using SUS were retrieved from an online database of the Information Technology Department of SUS (DATASUS) [30]. For evaluation of CT examinations on the Brazilian privately funded healthcare system, data were obtained from a sample of private CT services. Several radiology services around the country were contacted to determine the availability of electronic data on CT examinations and their willingness to participate in the study. A total of 25 private CT services meeting these requirements were included in the study (hereafter referred to “private sample”), which includes: 15 general hospitals, 1 pediatric hospital and 9 outpatient diagnostic services. These CT services were located in 8 Brazilian cities: Rio de Janeiro (n=14), São Paulo (n=4), Duque de Caxias (n=2), Niterói (n=1), Volta Redonda (n=1), Brasília (n=1), Florianópolis (n=1), and Recife (n=1). Electronic information archived on the Radiological Information Systems (RIS), including patient numeric identification, dates of birth and of CT examination (or age at examination), gender, and type of CT procedure
Dovales et al. Braz. J. Rad. Sci. ● 2020 4
were extracted for all CTs underwent between 2008 and 2014 in each CT service included in the study.
The patient’s age at examination was categorized into groups <1, 1-4, 5-9, 10-14, 15-19, 20-39, 40-59 and >60. Body imaged region was sorted into five categories, as suggested in reference [19]: head/neck, abdomen/pelvis, chest, spine, and extremities. Examinations that did not fit in any of these categories were classified as “other” which included examinations of more than one part of the body and CT angiography. To ensure the confidentiality of the information, the patient identification number was used to identify multiple CT procedures for the same patient in a given CT service of the private sample over the study period.
This study evaluated temporal trend of CT use in the public and private healthcare systems. For the latter, we used a restricted sample which included only CT services with regular number of CT examinations for all years of the study period. This “restricted” private sample included 8 CT services (4 general hospitals and 4 outpatient diagnostic units) from 3 Brazilian cities for the period 2008-2014. Compound annual growth rate (CAGR) was then calculated by using the equation (1), where Nt0 and Nt1 were respectively the number of procedures in the first and in the last year of
each time period, and t0 and t1 were respectively the first and the last year of the corresponding
time period.
CAGR (t0, t1) = ��Nt1⁄Nt0�1 (t1−t0⁄ )� − 1 (1)
RESULTS
Table 1 shows the age distribution of CT examinations on outpatients of the SUS and the private sample, between 2008 and 2014. About 17.8 and 1.5 million CT examinations were retrieved from SUS and the private setting, respectively. The proportion of CT examinations in children and young adults (less than 20 years of age) was 12.7% in SUS and 8.9% the private sample, with the youngest group of patients (infants aged less than 1 year) having 1.0% of the CT examinations in SUS, while patients of this age group underwent only 0.5% of the examinations in the private sample.
Table 1: Age distribution of CT examinations among SUS outpatients or
patients using a sample of private CT services in Brazil (2008-2014).
Age Number of CT examinations (%)
SUS Private sample
<1 178,828 (1.0) 6,775 (0.5) 1-4 348,833 (2.0) 27,414 (1.8) 5-9 439,526 (2.5) 25,014 (1.7) 10-14 548,054 (3.1) 26,091 (1.7) 15-19 724,579 (4.1) 47,944 (3.2) 20-39 4,093,871 (22.9) 392,524 (26.1) 40-59 6,127,319 (34.3) 438,644 (29.1) >60 5,390,453 (30.2) 540,228 (35.9) All agesa 17,852,434 (100.0) 1,504,792 (100.0)
a There were 971 and 158 CT scans with missing age in SUS and the private sample, respectively
Table 2 shows the distribution of CT examinations among patients younger than 20 years of age by scanned body part and age at examination, for SUS and the private sample between 2008 and 2014. Head/neck CT was the main type of examination for all pediatric and young adult age groups, with higher proportion of head/neck CT in SUS (72.6%) than in the private sample (63.1%). In general, the proportion of head/neck CT procedures tended to decline with increasing age in both SUS and private sample, while proportions of abdomen/pelvis CT examinations tended to increase with increasing age at examination for both settings.
Temporal trends on pediatric and young adult CT examinations for SUS and the restricted private sample settings for 2008-2014 are shown in Table 3. The overall annual number of CT examinations increased in both SUS and the private funded healthcare system between 2008 and 2014, but the annual growth rate was greater in the public than in the private setting (10.8% and 6.8% per year, respectively). CT use increased for all age groups in SUS and privately funded CT services, with a greater growth rate in the public than in the private setting for most age groups, except for younger age groups (<1 and 1-4 years old) for which growth rates were greater in the private (13.1% and 10.3%, respectively) than in the public setting (7.6% and 8.9%, respectively).
BJRS
BRAZILIAN JOURNAL
OF
RADIATION SCIENCES
08-01 (2020) 01-17 ISSN: 2319-0612 Accepted: 2019-12-17Table 2: Number (N) and proportion (%) of CT examinations among patients younger than 20 years of age in the Brazilian public healthcare
system (SUS) or in a sample of privately funded CT services, by imaged body part and age at examination (2008-2014).
Imaged body
part
Age at examination
<1 1-4 5-9 10-14 15-19 All
Head/neck SUS Private sample 136,975 (76.6) 284,585 (81.6) 342,606 (77.9) 396,343 (72.3) 465,499 (64.2) 1,626,008 (72.6) 5,850 (86.3) 22,228 (81.1) 17,996 (71.9) 15,667 (60.0) 22,397 (46.7) 84,138 (63.1) Abdomen/pelvis SUS Private sample 17,955 (10.0) 28,849 (8.3) 293 (4.3) 2,196 (8.0) 47,432 (10.8) 69,138 (12.6) 129,457 (17.9) 292,831 (13.1) 4,054 (16.2) 5,906 (22.6) 17,991 (37.5) 30,440 (22.8) Spine SUS Private sample 10,230 (5.7) 149 (2.2) 10,018 (2.9) 961 (3.5) 15,287 (3.5) 1,203 (4.8) 25,346 (4.6) 1,637 (6.3) 53,722 (7.4) 2,473 (5.2) 114,603 (5.1) 6,423 (4.8) Chest SUS Private sample 11,560 (6.5) 382 (5.6) 20,628 (5.9) 1,717 (6.3) 23,300 (5.3) 1,013 (4.0) 32,638 (6.0) 1,118 (4.3) 50,721 (7.0) 3,013 (6.3) 138,847 (6.2) 7,243 (5.4) Extremities SUS Private sample 2,108 (1.2) 16 (0.2) 4,753 (1.4) 203 (0.7) 10,901 (2.5) 646 (2.6) 24,589 (4.5) 1,588 (6.1) 25,180 (3.5) 1,543 (3.2) 67,531 (3.0) 3,996 (3.0) Other SUS Private sample 85 (1.3) 0 (0.0) 109 (0.4) 0 (0.0) 100 (0.4) 0 (0.0) 173 (0.7) 0 (0.0) 524 (1.1) 0 (0.0) 991 (0.7) 0 (0.0) Alla SUS 178,828 (100.0) 348,833 (100.0) 439,526 (100.0) 548,054 (100.0) 724,579 (100.0) 2,239,820 (100.0)
Private sample 6,775 (100.0) 27,414 (100.0) 25,014 (100.0) 26,091 (100.0) 47,944 (100.0) 133,238 (100.0)
BJRS
BRAZILIAN JOURNAL
OF
RADIATION SCIENCES
08-01 (2020) 01-17 ISSN: 2319-0612 Accepted: 2019-12-17Table 3: Annual growth rates (CAGR, %) of CT examinations
among patients younger than 20 years of age in the Brazilian public healthcare system (SUS) or in a sample of privately funded CT services, by age at examination (2008-2014).
Age Population CAGR (%)
<1 SUS Private sample (restricted) 13.1 7.6 1-4 SUS Private sample (restricted) 10.3 8.9 5-9 SUS Private sample (restricted) 7.3 5.3 10-14 SUS Private sample (restricted) 8.8 3.8 15-19 SUS Private sample (restricted) 16.4 7.1 Total SUS Private sample (restricted) 10.8 6.8
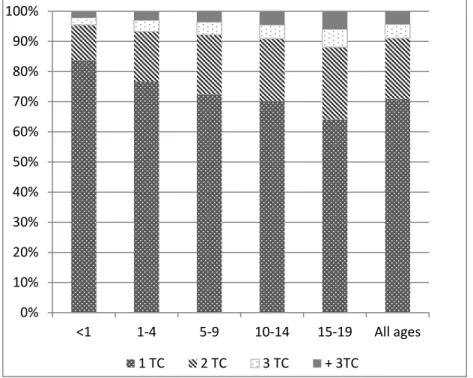
Figure 1 shows the proportion of multiple CT examinations among pediatric and young adult patients in the private sample of CT services. About 30% of the patients had more than one CT scan between 2008 and 2014 (20.2% having two examinations, 4.6% having 3 examinations, and 4.3% having 4 or more CT scans.) The number of CT examinations per patient increased with increasing age, from 16.2% of infants to 35.9% of the patients in the age group 15-19 years old receiving more than one CT examination in the period.
Figure 1: Proportion of multiple CT examinations per patient among patients younger than 20
years of age using a sample of private CT services in Brazil, by age group (2008-2014).
DISCUSSION
In the present study we evaluated CT patterns and trends of use among children and young adults in Brazil for the period 2008-2014. We showed that this group represented around 13% of the 17.8 million CT procedures underwent by outpatients in SUS between 2008 and 2014, and about 9% of the procedures in a sample of around 1.5 million CT examinations in privately funded CT services. Pediatric and young adult CT greatly increased in both healthcare systems over the study period, but annual growth rates were less pronounced in privately than in public funded healthcare system. Head/neck was the most frequently examined body part for all pediatric and young adult age groups in both healthcare systems, but the relative proportion of head/neck CT was greater in SUS than in the private setting, while the relative proportion of abdomen/pelvis scans was much higher in the private setting than in SUS. About one third of the patients younger than 20 years of age had more than one CT scan in the private setting over the study period.
0% 10% 20% 30% 40% 50% 60% 70% 80% 90% 100% <1 1-4 5-9 10-14 15-19 All ages 1 TC 2 TC 3 TC + 3TC
Dovales et al. Braz. J. Rad. Sci. ● 2020 10
The higher proportion of CT scans among young patients in Brazil than in many developed countries may be explained by differences in the age structures between developing and developed countries – with a higher proportion of older people in the latter [31]. Nevertheless, pediatric CT among SUS outpatients was still high even when age-standardized CT proportion was considered [27]. Differences in age structures between populations depending on SUS for healthcare or using the private setting may also explain the higher proportion of CT scans among patients younger than 20 years of age in SUS than in the private healthcare system. A higher proportion of older people is expected in the private setting, which is accessed mainly through health insurance coverage, that increases with age [32].
CT use in children and young people in Brazil increased both in public and privately funded healthcare systems between 2008 and 2014. Growth rates for all pediatric and young adult CT were higher in SUS (10.8% per year) than in the private setting (6.8% per year), but increase rate in the public healthcare system was higher than the average increase of 6.8% reported for less resourced countries between 2007 and 2009 [33]. However, a deceleration of the increasing rates of pediatric and young adult CT scans in SUS may be suggested since the annual growth rate of 10.8% reported for the study period of 2008-2014 were lower than growth rates reported by Dovales and colleagues for the period 2008-2011 (17.5%) for the same population [27]. Increasing CT trends in young people have also been reported in Great Britain [19], Australia [17], and the United States [5], but a more recent levelling or even reduction in CT use has been reported in some developing countries [5, 17, 18, 34]. It has been suggested that at least part of this decreasing trend may be a result of initiatives aiming to increase awareness about potential CT doses and risks, leading to efforts to reduce or avoid unnecessary CT exposure, mainly in children [35-37]. To our knowledge, no such attempts have been made in Brazil during the studied period. Indeed, the Image Gently campaign was introduced in Brazil only in 2018 [38]. Lack of data from previous periods impairs any conclusion about future trends of privately funded pediatric and young adult CT in Brazil.
As reported in other countries [13, 15, 19, 26], examinations of the head/neck both in SUS and the private sample represented the main type of CT procedure among children and young adults, with the proportion of head examinations tending to decrease with increasing age. The proportion of head/neck CT was higher in SUS than among patients using the private setting, while the opposite was observed for examinations of the abdomen/pelvis. It can be hypothesized that lower availability
of more modern imaging machines in the public setting, where financial resources are more limited [27, 28, 39-41], may difficult body scans, contributing to a higher proportion of head/neck scans. Accordingly, the proportion of pediatric head/neck CT in SUS (72.6%) was similar to the proportion in less resourced countries (72%) [26], but higher than those reported in developed countries (66% in Japan [13], 62% in Switzerland [15] and 60% in Great Britain [19]). Nevertheless, we can probably anticipate an increase in the proportion of scans of others part of the body among SUS outpatients in the following years. Abdomen/pelvis CT scans increased more than head/neck examinations (21.9% and 8.5% per year, respectively) among pediatric and young adult patients from SUS between 2008 and 2014 (results not shown), as reported previously for the period 2008-2011 [27].
CT is used not only for diagnostic purposes, but also to assess disease progress and/or the course of therapy [1]. Oncologic follow up, for instance, can account for around one third of all CT examinations in children [25]. Therefore, multiple examinations on the same patient over a time period are not uncommon. In this study almost one third of pediatric and young adult patients had more than one CT examination between 2008 and 2014, with about 4% having 4 or more CT scans. Similar proportions of multiple CT in young people were reported in Great Britain [19] and Israel [18], while a slightly lower proportion (22.9%) was observed in Japan [13]. However, the proportion of multiple CT examinations in this study may be an underestimation since only CT scans underwent in the CT services enrolled in this study were considered, excluding any examination done in other CT services. Although individual doses from CT scans are usually low, patients undergoing multiple CT scans can receive total radiation doses at levels for what increased risk for radiation-induced cataracts [42] and cancer [43] have been shown. The type of examination with higher proportion of more than one examination in the same patient over the study period was spine CT (60%, not shown), which delivers relatively high doses and has been reported as a frequently unjustified examination in young patients [44].
This was the first comprehensive report on the patterns and trends of both public and privately funded pediatric CT use in Brazil. However, our study has some limitations. First, data on privately funded pediatric CT were obtained from a sample of CT services, most of which were reference CT services, localized at developed cities, where health resources, including CT scanners, are more easily available [27, 28]. Thus, data for the private setting in this study may not be representative of
Dovales et al. Braz. J. Rad. Sci. ● 2020 12
CT use in the whole country. This limitation was even sharper when we analyzed CT trends over time, since exclusion of CT services without data for the whole study period resulted in a more reduced sample. Other limitation is that analysis on CT use on SUS included only outpatients. However, CT scans underwent by inpatients in SUS were much less frequent and have a similar distribution pattern by type of examination [45].
CONCLUSION
CT use in children and young adults had increased between 2008 and 2014 both in public and private healthcare systems in Brazil. Nevertheless, annual growth rates were less pronounced in privately than in public funded healthcare system. Head/neck was the main type of CT examination in both settings and around one third of the patients in the private setting had more than one CT examination over the period investigated. Although CT examinations may improve life quality, avoiding more invasive and costly procedures for the detection, diagnosis and treatment of a variety of diseases and injuries, CT overuse and/or misuse, which increase health costs and may harm patient's health, might also be driving this increase, mainly in the private setting. Efforts to improve radiation protection in pediatric CT in Brazil should include dissemination of appropriateness criteria and education and training of referring physicians and radiologists. Initiatives to optimize pediatric CT protocols, as the establishment of reference levels and quality assurance programs are also needed.
ACKNOWLEDGMENT
Financial support: This work was supported by the Brazilian Federal Agency for the Support and Evaluation of Graduate Education (CAPES), AUXP 138/2013.
REFERENCES
[1] RUBIN, G. D. Computed tomography: revolutionizing the practice of medicine for 40 years.
Radiology, v. 273, p. S45-74, 2014.
[2] BRENNER, D.; ELLISTON, C.; HALL, E., et al. Estimated risks of radiation-induced fatal cancer from pediatric CT. AJR Am J Roentgenol, v. 176, p. 289-296, 2001.
[3] BERRINGTON DE GONZALEZ, A.; MAHESH, M.; KIM, K. P., et al. Projected cancer risks from computed tomographic scans performed in the United States in 2007. Arch Intern Med,
v. 169, p. 2071-2077, 2009.
[4] SODICKSON, A.; BAEYENS, P. F.; ANDRIOLE, K. P., et al. Recurrent CT, cumulative radiation exposure, and associated radiation-induced cancer risks from CT of adults.
Radiology, v. 251, p. 175-184, 2009.
[5] MIGLIORETTI, D. L.; JOHNSON, E.; WILLIAMS, A., et al. The use of computed tomography in pediatrics and the associated radiation exposure and estimated cancer risk.
JAMA Pediatr, v. 167, p. 700-707, 2013.
[6] PEARCE, M. S.; SALOTTI, J. A.; LITTLE, M. P., et al. Radiation exposure from CT scans in childhood and subsequent risk of leukaemia and brain tumours: a retrospective cohort study.
Lancet, v. 380, p. 499-505, 2012.
[7] MATHEWS, J. D.; FORSYTHE, A. V.; BRADY, Z., et al. Cancer risk in 680,000 people exposed to computed tomography scans in childhood or adolescence: data linkage study of 11 million Australians. BMJ, v. 346, p. f2360, 2013.
[8] HUANG, W.-Y.; MUO, C.-H.; LIN, C.-Y., et al. Paediatric head CT scan and subsequent risk of malignancy and benign brain tumour: a nation-wide population-based cohort study. Br J Cancer, v. 110, p. 2354-2360, 2014.
[9] KRILLE, L.; DREGER, S.; SCHINDEL, R., et al. Risk of cancer incidence before the age of 15 years after exposure to ionising radiation from computed tomography: results from a German cohort study. Radiat Environ Biophys, v. 54, p. 1-12, 2015.
Dovales et al. Braz. J. Rad. Sci. ● 2020 14
[10] BERRINGTON DE GONZALEZ, A.; SALOTTI, J. A.; MCHUGH, K., et al. Relationship between paediatric CT scans and subsequent risk of leukaemia and brain tumours: assessment of the impact of underlying conditions. Br J Cancer, v. 114, p. 388-394, 2016.
[11] ICRP. International Commission on Radiological Protection. The 2007 Recommendations of the International Commission on Radiological Protection. ICRP publication 103. Ann ICRP, v. 37, p. 1-332, 2007.
[12] ICRP. International Commission on Radiological Protection. Radiological Protection in Medicine. ICRP Publication 105. Ann ICRP v. 37, p. 1-64, 2007.
[13] GHOTBI, N.; OHTSURU, A.; OGAWA, Y., et al. Pediatric CT scan usage in Japan: results of a hospital survey. Radiat Med, v. 24, p. 560-567, 2006.
[14] TAKEI, Y.; MIYAZAKI, O.; MATSUBARA, K., et al. Nationwide survey of radiation exposure during pediatric computed tomography examinations and proposal of age-based diagnostic reference levels for Japan. Pediatr Radiol, v. 46, p. 280-285, 2016.
[15] VERDUN, F. R.; GUTIERREZ, D.; VADER, J. P., et al. CT radiation dose in children: a survey to establish age-based diagnostic reference levels in Switzerland. Eur Radiol, v. 18, p.
1980-1986, 2008.
[16] GALANSKI, M.; NAGEL, H. D. and STAMM, G. [Results of a federation inquiry 2005/2006: pediatric CT X-ray practice in Germany]. Rofo, v. 179, p. 1110-1111, 2007.
[17] BRADY, Z.; CAIN, T. M. and JOHNSTON, P. N. Paediatric CT imaging trends in Australia. J Med Imaging Radiat Oncol, v. 55, p. 132-142, 2011.
[18] CHODICK, G.; RONCKERS, C.; RON, E., et al. The utilization of pediatric computed tomography in a large Israeli Health Maintenance Organization. Pediatr Radiol, v. 36, p.
485-490, 2006.
[19] PEARCE, M. S.; SALOTTI, J. A.; HOWE, N. L., et al. CT Scans in Young People in Great Britain: Temporal and Descriptive Patterns, 1993-2002. Radiol Res Pract, v. 2012, p. 594278,
[20] NEVES, A.; NUNES, A.; RUFINO, M., et al. Assessment of paediatric CT exposure in a Portuguese hospital. Radiat Prot Dosimetry, v. 151, p. 456-462, 2012.
[21] BULS, N.; NIEBOER, K. and DE MEY, J. Comment on article of K. Udayasankar, J. Li, D.A. Baumgarten, W.C. Small, M.K. Kalra: acute abdominal pain:value of non-contrast enhanced ultra-low-dose multi-detector row CT as a substitute for abdominal radiographs (2009). Emerg Radiol, v. 17, p. 165-166; author reply 167-168, 2010.
[22] BRISSE, H. J. and AUBERT, B. [CT exposure from pediatric MDCT: results from the 2007-2008 SFIPP/ISRN survey]. J Radiol, v. 90, p. 207-215, 2009.
[23] THOMAS, K. E. CT utilization: trends and developments beyond the United States' borders.
Pediatr Radiol, v. 41 Suppl 2, p. 562-566, 2011.
[24] PEARCE, M. S. Patterns in paediatric CT use: an international and epidemiological perspective. J Med Imaging Radiat Oncol, v. 55, p. 107-109, 2011.
[25] KRILLE, L.; ZEEB, H.; JAHNEN, A., et al. Computed tomographies and cancer risk in children: a literature overview of CT practices, risk estimations and an epidemiologic cohort study proposal. Radiat Environ Biophys, v. 51, p. 103-111, 2012.
[26] REHANI, M. M. Multi-national findings on radiation protection of children. Pediatr Radiol,
v. 44 Suppl 3, p. 475-478, 2014.
[27] DOVALES, A. C.; DA ROSA, L. A.; KESMINIENE, A., et al. Patterns and trends of computed tomography usage in outpatients of the Brazilian public healthcare system, 2001-2011. J Radiol Prot, v. 36, p. 547-560, 2016.
[28] PAIM, J.; TRAVASSOS, C.; ALMEIDA, C., et al. The Brazilian health system: history, advances, and challenges. Lancet, v. 377, p. 1778-1797, 2011.
[29] CHAVES, T. O.; DOVALES, A. C. M.; ROSA, L. A. R. D., et al. Patterns and trends of Computed Tomography usage among pediatric and young adult patients in a private hospital in Rio de Janeiro, 2005-2015. Brazilian Journal of Radiation Sciences, v. 6, p., 2018.
[30] MINISTÉRIO DA SAÚDE. BRASIL. DATASUS. SUS Database. Accessed on: 09/10/2012.
Dovales et al. Braz. J. Rad. Sci. ● 2020 16
[31] UNITED NATIONS. 2013 World Population Ageing (ST/ESA/SER.A/348) (New York:
United Nations). United Nations. Department of Economic and Social Affairs, Population Division. 2013.
[32] STIVALI, M. Regulação da saúde suplementar e estrutura etária dos beneficiários. [Supplementary health care regulation and age structure of beneficiaries]. Cien Saude Colet, v.
16, p. 3729-3739, 2011.
[33] VASSILEVA, J.; REHANI, M. M.; AL-DHUHLI, H., et al. IAEA survey of pediatric CT practice in 40 countries in Asia, Europe, Latin America, and Africa: Part 1, frequency and appropriateness. AJR Am J Roentgenol, v. 198, p. 1021-1031, 2012.
[34] TOWNSEND, B. A.; CALLAHAN, M. J.; ZURAKOWSKI, D., et al. Has pediatric CT at children's hospitals reached its peak? AJR Am J Roentgenol, v. 194, p. 1194-1196, 2010.
[35] GOSKE, M. J.; APPLEGATE, K. E.; BULAS, D., et al. Image Gently 5 years later: what goals remain to be accomplished in radiation protection for children? AJR Am J Roentgenol, v. 199,
p. 477-479, 2012.
[36] LEVIN, D. C.; RAO, V. M. and PARKER, L. The recent downturn in utilization of CT: the start of a new trend? J Am Coll Radiol, v. 9, p. 795-798, 2012.
[37] PARKER, M. W.; SHAH, S. S.; HALL, M., et al. Computed tomography and shifts to alternate imaging modalities in hospitalized children. Pediatrics, v. 136, p. e573-581, 2015.
[38] SOCIEDADE BRASILEIRA DE PEDIATRIA. SBP lança Image Gently no Brasil.
Accessed on: 10/06/2019. Available from: https://www.sbp.com.br/especiais/image-gently/. [39] INSTITUTO BRASILEIRO DE GEOGRAFIA E ESTATÍSTICA (IBGE). BRASIL. Escassez
e fartura: distribuição da oferta de equipamentos de diagnóstico por imagem no Brasil. Indicadores sociodemográficos e de saúde no Brasil: 2009. 2009.
[40] SZWARCWALD, C. L.; SOUZA-JÚNIOR, P. R. and DAMACENA, G. N. Socioeconomic inequalities in the use of outpatient services in Brazil according to health care need: evidence from the World Health Survey. BMC Health Services Research, v. 10, p. 217, 2010.
[41] VIACAVA, F. and BELLIDO, J. G. Health, access to services and sources of payment, according to household surveys. Cien Saude Colet, v. 21, p. 351-370, 2016.
[42] MICHEL, M.; JACOB, S.; ROGER, G., et al. Eye lens radiation exposure and repeated head CT scans: A problem to keep in mind. Eur J Radiol, v. 81, p. 1896-1900, 2012.
[43] PRESTON, D. L.; SHIMIZU, Y.; PIERCE, D. A., et al. Studies of mortality of atomic bomb survivors. Report 13: solid cancer and noncancer disease mortality: 1950-1997. 2003. Radiat Res, v. 178, p. AV146-172, 2012.
[44] OIKARINEN, H.; MERILAINEN, S.; PAAKKO, E., et al. Unjustified CT examinations in young patients. Eur Radiol, v. 19, p. 1161-1165, 2009.
[45] DOVALES, A. C. M.; DE SOUZA, A. A. and VEIGA, L. H. Tomografia computadorizada no Brasil: frequência de uso em pacientes internados no Sistema Único de Saúde (SUS) [Computed tomography in Brazil: frequency and pattern of usage among inpatients of the Unified Health System (SUS)]. Revista Brasileira de Física Médica, v. 9, p. 11-14, 2015.