UNIVERSIDADE DE LISBOA
Faculdade de Ciências
Departamento de Física
Analysis of the use of dosimetrically equivalent linear
accelerators for Intensity Modulated Radiotherapy
treatments
Rafaela Cristina Sepúlveda da Silva
Orientadores
Drª Miriam Zarza Moreno, Serviço de Radioterapia do Instituto Português
de Oncologia de Lisboa
Prof. Dr. Nuno Matela, Instituto de Biofísica e Engenharia Biomédica,
Departamento de Física da Faculdade de Ciências da Universidade de
Lisboa
Mestrado Integrado em Engenharia Biomédica e Biofísica
Perfil em Sinais e Imagens Médicas
Dissertação
2015
iii
Acknowledgments
I would like to express my gratitude to Instituto Português de Oncologia de Lisboa Francisco Gentil (IPOLFG) and Dr. Margarida Roldão, director of the Radiotherapy Service, for giving me the opportunity of doing my Master Internship and perform this study in the service.
To Dr. Miriam Moreno, who have orientated this work, a very special thanks for receiving me with so much generosity since the first day and for always being available to patiently answer to my questions, despite being always busy with her work. Her dedication and ideas had a major role in this work, and I have no words to thank all I have learnt from her and all the encouragement she gave me during the Internship. I hope to return all the effort she put into this work by following her example of professionalism, dynamism and persistence, always offering a smile and a nice word, in my future professional career. I will always remember her great contribution to my academic achievements and to make me grow as a person, by reminding me of the importance of transforming insecurities into motivation and disciplined work.
To Prof. Nuno Matela, my supervisor, I would like to thank for always being available and for clarifying all my doubts related to the Faculty required procedures, as well as for his encouragement words and his suggestions for this thesis, in spite of the subject being not directly related to his field of work.
I would also like to express a special thanks to all the Physics staff for the support and availability to clarify my doubts when Dr. Miriam was not present. To them and to the other professionals of the Radiotherapy Service who pass their cards to open the door in order to let me in and out of the Physics office every day, I want to thank for the patience.
I also want to thank to all the professionals from Brachytherapy, CT and treatment units for the support and explanations during the first months of my Internship.
I would also like to express my special gratitude to Prof. Eduardo Ducla Soares for encouraging me to choose Radiotherapy as subject of my Master Internship, despite of my initial insecurity due to the unawareness of the subject from my previous academic experience. I sincerely thank for the motivation, since, although I had difficulties in the beginning, they were surpassed and currently Radiotherapy is a subject that I truly appreciate and that is in accordance with my initial expectations when I choose Biomedical Engineering as academic route.
I would like to thank very much to my family, especially to my parents, for providing me the opportunity to invest in my academic formation, contributing to make this work possible, and also for always giving me freedom to make my academic decisions and for, since I was a child,
iv
letting me take the responsibility of my duties by my own. Without that freedom and all the support they gave me through all these years, I would not have achieved the success that I have experienced in my academic life and would not like so much to learn as well. I hope my love and dedication would be enough to return the great education I have received and also hope that, one day, I would be capable of providing that support and that freedom to my children.
A special thanks also to my friends for their support through all these years, especially in my worst moments of demotivation and frustration, when they encouraged me to continue my studies in Biomedical Engineering in another Faculty, leading me to make the decision of doing the Master in Biomedical and Biophysics in FCUL, which was one of the most positive decisions I made in my life. Thanks to them also for, in the last months, listening to me talking about my thesis with so much patience.
A final special thanks to all the teachers I had for all I have learnt from them, for creating in me the desire of always try to do my best and to achieve great things and for guiding me until this point in my life.
v
Resumo
O uso de radiações para terapia iniciou-se pouco tempo após a descoberta dos raios-X por Wilhelm Röntgen em 1895, tendo ocorrido uma grande evolução ao nível da tecnologia geradora de raios-X até ao presente. Essa evolução tornou possível que sejam produzidos feixes de fotões e electrões de altas energias.
Os aceleradores lineares são actualmente os principais produtores de raios X de alta energia utilizados em Radioterapia. Devido à evolução tecnológica das últimas décadas e ao elevado nível de reprodutibilidade e precisão dos feixes produzidos por estes equipamentos, tem-se verificado um esforço progressivo, por parte dos fabricantes, para uniformizar o desenho e a tecnologia dos aceleradores lineares. Esta uniformização permite que aceleradores lineares idênticos possam ser instalados com ajuste dosimétrico (beam-matching) e considerados dosimetricamente equivalentes.
A instalação com beam-matching permite um aumento da flexibilidade e eficiência dos aceleradores lineares, pois reduz a necessidade de interrupção ou replaneamento dos tratamentos em caso de paragem de um dos equipamentos, devido à possibilidade da utilização indistinta dos mesmos. A utilização indistinta dos aceleradores lineares assume um papel bastante importante nas unidades de tratamento, pois as interrupções do funcionamento normal dos equipamentos são relativamente frequentes, devido a intervenções de manutenção preventiva periódica, bem como a avarias. Por este motivo, tem-se tornado comum nos serviços de radioterapia a instalação de aceleradores lineares com beam-matching em relação a equipamentos similares instalados previamente, fazendo com que os aceleradores lineares existentes no serviço sejam dosimetricamente equivalentes e permitindo a sua utilização indistinta.
Apesar dos ajustes dosimétricos, podem ocorrer pequenas variações nas características dos aceleradores lineares, que podem resultar de diversos factores, como desgaste dos equipamentos ou condições de utilização. Têm sido realizados estudos [1-4] com a finalidade de avaliar a equivalência dosimétrica de aceleradores lineares instalados com beam-matching dentro de uma unidade de tratamento. Os resultados obtidos nestes estudos confirmam a equivalência dosimétrica entre os equipamentos, sugerindo que o processo de beam-matching é suficiente para garantir a utilização indistinta dos aceleradores lineres.
No entanto, resultando as possíveis variações nas características dos equipamentos de diversos factores, é necessário avaliar individualmente a equivalência dosimétrica dos aceleradores lineares para diferentes unidades, bem como verificar se esta equivalência é mantida a longo-prazo ou se, por outro lado, surgem diferenças significativas ao nível das características dosimétricas que justifiquem a adaptação do sistema de planeamento aos novos parâmetros. Esta necessidade assume especial relevância para técnicas avançadas, como a Radioterapia de Intensidade Modulada (IMRT), na qual se verificam elevados gradientes de dose e são utilizados colimadores multi-lâminas (MLC), bem como campos de reduzidas dimensões, que podem conduzir a um maior impacto das variações ao nível dos planeamentos dosimétricos.
vi
Deste modo, no âmbito do Estágio realizado no Instituto Português de Oncologia de Lisboa Francisco Gentil (IPOLFG), foi realizado um estudo que consistiu, por um lado, na avaliação da estabilidade a longo prazo das características dos feixes de fotões de 6 MV e, por outro, na comparação dosimétrica para a técnica de Radioterapia de Intensidade Modulada (IMRT).
Para a realização do presente estudo, foram utilizados três aceleradores lineares do modelo 2100C/D da Varian Medical Systems, Inc., que produzem fotões com energias de 6 MV e com um valor de energia mais elevado, 10 MV ou 15 MV, bem como electrões com diversas energias. Um dos aceleradores lineares, denominado DHX01, foi instalado em Março de 2012, enquanto os dois restantes, DHX02 e DHX03, foram instalados em Novembro e Dezembro de 2012, respectivamente. Os aceleradores lineares DHX02 e DHX03 foram instalados com beam-matching, sendo dosimetricamente equivalentes no sistema de planeamento e usados indistintamente em caso de interrupção do funcionamento de um dos equipamentos. Os três aceleradores lineares são usados para tratamentos de Radioterapia de Intensidade Modulada (IMRT), contendo, para o efeito, um colimador multilâminas (MLC) MilleniumTM MLC com 120
lâminas, divididas por dois bancos com 60 lâminas. Estão também equipados com um dispositivo electrónico de imagem portal (EPID), usado para verificação de planos de IMRT.
A avaliação da estabilidade a longo-prazo das características dosimétricas dos aceleradores lineares consistiu na análise de dados adquiridos nas verificações realizadas no âmbito dos controlos de qualidade diário e trimestral durante o ano de 2014 para fotões de 6 MV (energia utilizada para tratamentos de IMRT). Na análise foram também incluídos os resultados de medições realizadas para controlo de qualidade do MLC. Os resultados obtidos com os três aceleradores lineares foram analisados usando o software SPSS Statistics Package, sendo realizada uma comparação entre os três equipamentos para verificar se, de modo geral, os resultados obtidos nos controlos de qualidade compromete a equivalência dosimétrica em estudo.
A comparação dosimétrica dos três aceleradores lineares para tratamentos de IMRT foi realizada através de verificação de planos de tratamento para patologia de cabeça e pescoço (H&N) e próstata, criados com o sistema de planeamento EclipseTM da Varian Medical Systems,
Inc. Foram selecionadas amostras contendo doentes tratados em cada um dos aceleradores lineares usando a técnica de IMRT, para cada uma das duas patologias, num total de seis amostras. Para além das verificações originais realizadas antes do início dos tratamentos, usando o equipamento em que o doente foi tratado, novas verificações foram realizadas com os restantes dois aceleradores lineares, sem troca de unidade de tratamento no sistema de planeamento, i.e., mantendo os parâmetros originais do plano de tratamento, sem recálculo para equipamento diferente. As verificações foram realizadas através de Análise Gamma de imagens portais adquiridas através de EPID. A comparação entre os três equipamentos consistiu na comparação das percentagens de pontos em conformidade com os critérios estabelecidos para a Análise Gamma com critérios 3.0%, 3.0 mm obtidas nas três verificações efectuadas para cada amostra e análise das diferenças obtidas com realização da verificação com um equipamento diferente. Foi ainda realizada uma análise de doses no sistema de planeamento, que consistiu na troca de unidade de tratamento no sistema de planeamento para todos os
vii
doentes de cada uma das amostras, com posterior recálculo de dose, e determinação da das diferenças obtidas devido à troca de equipamento ao nível da dose e unidades monitor (UM) calculadas pelo TPS. Esta última análise teve a finalidade de determinar se possíveis desvios obtidos nos resultados da Análise Gamma para as verificações com EPID são resultantes de diferenças nas características dosimétricas dos aceleradores lineares ou se, por outro lado, resultam de diferenças acentuadas entre as unidades de tratamento no sistema de planeamento, comprometendo o ajustamento experimental a um equipamento diferente.
Ambas as avaliações foram realizadas com a finalidade de estudar dois aspectos principais. Um deles consistiu na verificação da equivalência dosimétrica a longo-prazo dos aceleradores lineares DHX02 e DHX03, instalados com beam-matching, bem como a verificação desta equivalência no caso de tratamentos de IMRT. O outro aspecto em estudo consistiu na possibilidade de utilizar indistintamente o terceiro acelerador linear, DHX01, instalado sem beam-matching, como dosimetricamente equivalente aos outros dois equipamentos para tratamentos de IMRT.
Os resultados obtidos estão de acordo com os valores de tolerância recomendados e confirmam a equivalência dosimétrica entre os aceleradores lineares. No entanto, sugerem precaução na utilização indistinta do equipamento DHX01, pois, embora os resultados estejam dentro dos limites estabelecidos (acordos da Análise Gamma superiores a 90.00%), diferem dos obtidos para os restantes aceleradores lineares, com desvios máximos de 8.00%. Apesar de as diferenças obtidas não serem, em geral, significativas (desvios médios são de aproximadamente 4.00%) não comprometerem totalmente a utilização indistinta do equipamento DHX01, é recomendada a actualização das características dos aceleradores lineares no sistema de planeamento.
Palavras-chave: Aceleradores Lineares, Beam-matching, Radioterapia de Intensidade Modulada (IMRT), Dispositivos Electrónicos de Imagem Portal (EPID), Análise Gamma
ix
Abstract
Linear accelerators are currently the mostly used high energy X-rays generators for Radiotherapy. Due to the evolution occurred in the last decades, as well as to the high reproducibility and precision of the beams generated by these machines, a progressive standardization of their design and technology has occurred. This standardization allows similar linear accelerators to be installed with dosimetric adjustments (beam-matching) and considered dosimetrically equivalent in the treatment planning system, reducing the need of treatment interruption or replanning if a linear accelerator is not functioning.
In spite of the dosimetric adjustments, small variation in outputs may occur due to several factors, as equipment wear or use conditions. Several studies [1-4] that supported the dosimetric equivalence between beam-matched linear accelerators have been performed. However, as the possible variations result from diverse factors, it is recommended to evaluate the dosimetric equivalence of linear accelerators individually for each treatment facility, especially for advanced treatment techniques, as Intensity Modulated Radiotherapy (IMRT), in which dose gradients are high and multileaf collimators (MLC) and small fields are used, possibly increasing the impact of the variations for dosimetric plans.
For this reason, in the context of the Internship in Instituto Português de Oncologia de Lisboa Francisco Gentil (IPOLFG), a long term stability evaluation has been performed for the characteristics of 6 MV photons from three linear accelerators installed in the Radiotherapy Service (two of them are beam-matched), acquired during daily and trimestral quality assurance procedures. It was also performed a dosimetric comparison between the three machines for Intensity Modulated Radiotherapy (IMRT), using portal imaging and Gamma Analysis, in order to verify the differences resultant from the indistinct use of the linear accelerators.
The obtained results supported the dosimetric equivalence of the linear accelerators, but suggesting caution when using indistinctly the linear accelerator installed without beam-matching, especially for Head and Neck treatments, since, although the results are in accordance the recommended tolerance of 90.00% for the agreement of the Gamma Analysis, higher deviations were obtained for this equipment, with approximate average values of 4.00% and maximum value of 8.00%.
Key-words: Linear Accelerators, Beam-matching, Intensity Modulated Radiotherapy (IMRT), Electronic Portal Imaging Devices (EPID), Gamma Analysis.
xi
Table of Contents
Acknowledgments ... iii
Resumo ... v
Abstract ... ix
List of Tables ... xiii
List of Figures ... xv
1. Motivation ... 1
2. Introduction to External Radiotherapy: the IMRT concept ... 3
2.1. Brief Introduction ... 3
2.2. The technological evolution: from 2D to IMRT ... 4
2.3. Fundamentals of radiotherapy physics and dosimetry ... 7
2.3.1. Interaction of ionizing radiation with matter ... 7
2.3.1.1. Photon interactions in matter ... 8
2.3.1.2. Electron interactions in matter ... 11
2.3.2. Basic clinical radiation dosimetry ... 12
2.4. Medical Linear Accelerators ... 15
2.4.1. General Concepts ... 15
2.4.2. Quality Assurance ... 19
2.4.2.1. Daily Quality Assurance ... 19
2.4.2.2. Trimestral and Annual Quality Assurance ... 21
2.4.3. Beam-Matching ... 23
2.5. Treatment Planning System ... 24
2.5.1. General Fundamentals ... 24
2.5.1.1. Definition of Volumes ... 25
2.5.2. Dose Calculation: The Analytical Anistropic Algorithm ... 26
2.5.3. Dose evaluation tools: isodose and Dose Volume Histogram ... 27
2.6. IMRT Verification ... 29
2.6.1. Dosimetry Equipment ... 30
2.6.1.1. Electronic Portal Imaging: EPID ... 30
2.6.1.2. Ionization Chambers ... 33
2.6.2. Gamma Analysis ... 34
3. Materials and Methods ... 39
3.1. The IMRT system ... 39
3.2. Basic Dosimetry ... 40
3.2.1. Daily Quality Control ... 40
3.2.2. Trimestral Quality Assurance ... 42
3.2.3. MLC stability check using EPID images ... 44
3.2.3.1 Garden Fence Test ... 44
3.2.3.2. Chair Test ... 45
xii
3.2.3.4. Linearity Test ... 46
3.3. IMRT Planning Dosimetry ... 47
3.3.1. Head and Neck Radiotherapy Samples ... 47
3.3.2. Prostate Samples ... 49
3.3.3. Ionization Chamber Verification ... 51
4. Results and Discussion ... 55
4.1. Basic Dosimetry ... 55
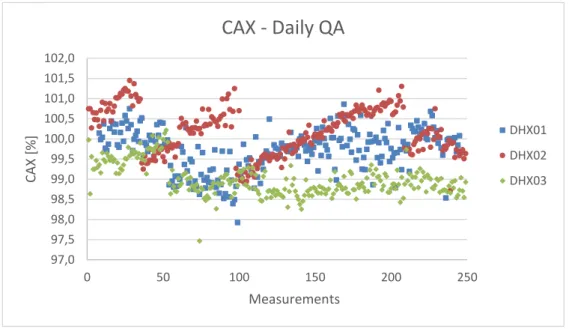
4.1.1. Daily Quality Assurance ... 55
4.1.1.1. CAX Dose ... 55
4.1.1.2. Flatness ... 57
4.1.1.3. X-axis Symmetry ... 58
4.1.1.4. Y-axis Symmetry ... 59
4.1.1.4. Beam Quality Factor ... 61
4.1.2. Trimestral Quality Assurance ... 62
4.1.2.1. Dose Calibration Factor ... 63
4.1.2.2. X- axis Symmetry and Y-axis Symmetry ... 64
4.1.2.3. MLC Transmission ... 65
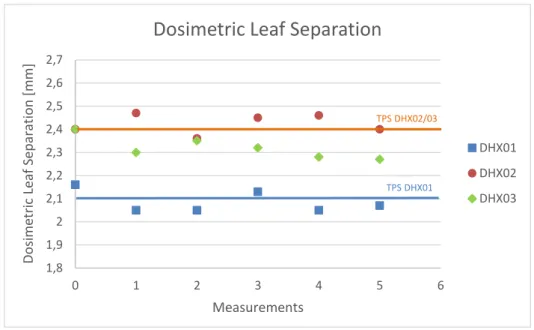
4.1.2.4. Dosimetric Leaf Separation ... 66
4.1.3. EPID Tests ... 68
4.1.3.1. Garden Fence Test ... 68
4.1.3.2. Chair Test ... 70
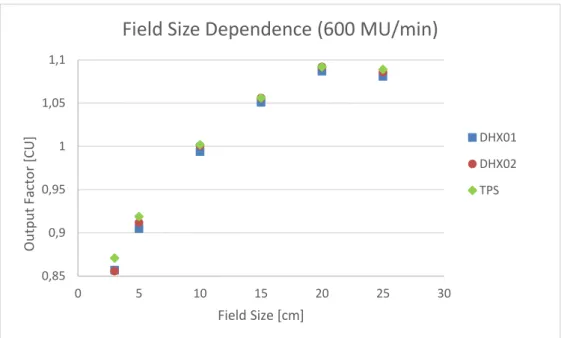
4.1.3.3. Field Size Dependence Test ... 71
4.1.3.4. Linearity Test ... 74
4.2. Head and Neck IMRT Treatments ... 76
4.2.1. Change of Treatment Machine in EclipseTM TPS: Dose evaluation ... 76
4.2.2. EPID Verifications ... 87
4.3. Prostate IMRT Treatments ... 94
4.3.1. Change of Treatment Machine in EclipseTM TPS: Dose evaluation ... 94
4.3.2. EPID Verifications ... 101
4.4. Ionization Chamber Verification for Head and Neck IMRT treatments ... 109
5. Conclusions ... 113
Bibliography ... 115
xiii
List of Tables
Table 1 - Daily quality assurance recommended procedures and tolerances for IMRT . ... 20
Table 2 - Monthly quality assurance recommended procedures and tolerances for IMRT. ... 21
Table 3 - Annual quality assurance recommended procedures and tolerances for IMRT. ... 22
Table 4 - Summary of tolerance limits for percentage of gamma passing points suggested by some authors and used as reference in some institutions. ... 37
Table 5 - IPOLFG established tolerance values for trimestral quality assurance parameters. . 444
Table 6 - Summary of the characteristics of Head and Neck samples. ... 477
Table 7 - Summary of the characteristics of Head and Neck samples. ... 50
Table 8 - Descriptive Statistics for daily QA CAX dose ... 55
Table 9 - Descriptive statistics for daily QA flatness. ... 57
Table 10 - Descriptive Statistics for daily QA x-axis symmetry. ... 588
Table 11 - Descriptive Statistics for daily QA y-axis symmetry. ... 60
Table 12 - Descriptive Statistics for daily QA Beam Quality Factor. ... 61
Table 13 - Descriptive statistics for trimestral QA dose calibration factor. ... 63
Table 14 - Descriptive Statistics for trimestral QA x-axis symmetry. ... 64
Table 15 - Descriptive statistics for trimestral QA y-axis symmetry. ... 655
Table 16 - Descriptive statistics for trimestral QA MLC transmission. ... 666
Table 17 - Descriptive statistics trimestral QA dosimetric leaf separation. ... 677
Table 18 - Descriptive statistics for agreement value of the Gamma analysis for Garden Fence test. ... 688
Table 19 - Descriptive statistics for agreement value of the Gamma analysis for Chair test. .... 70
Table 20 - Descriptive statistics for field size dependence test absolute deviations. ... 722
Table 21 - Descriptive statistics for linearity test absolute deviations. ... 755
Table 22 - Average absolute TPS dose and total Monitor Units deviations for H&N samples TPS change of treatment unit. ... 777
Table 23- Descriptive statistics for DHX01 H&N Sample EPID verifications. ... 888
Table 24 - Correlation coefficients for DHX01 H&N sample EPID verifications. ... 899
Table 25 - Descriptive statistics for DHX02 H&N sample EPID verifications. ... 91
Table 26 - Correlation coefficients for DHX02 H&N sample EPID verifications. ... 922
Table 27 - Descriptive statistics for DHX03 H&N sample EPID verifications. ... 933
Table 28 - Descriptive statistics for DHX03 H&N sample EPID verifications. ... 944
Table 29 - Average absolute TPS dose deviations for prostate samples TPS change of treatment unit ... 955
Table 30 - Descriptive statistics for DHX01 prostate sample EPID verifications. ... 1022
xiv
Table 32 - Descriptive statistics for DHX02 prostate sample EPID verifications. ... 1055
Table 33 - Correlation coefficients for DHX02 prostate sample EPID verifications. ... 1066
Table 34 - Descriptive statistics for DHX03 prostate sample EPID verifications. ... 1077
Table 35 - Correlation coefficients for DHX03 prostate sample EPID verifications. ... 1088
Table 36 - Descriptive statistics for the absolute diferences obtained from the comparisons between DHX01, DHX02 and TPS. ... 11010
xv
List of Figures
Figure 1 - Varian’s 120-leaf Millenium MLC ... 5
Figure 2 - Comparison of 3D-CRT and IMRT ... 6
Figure 3 - Emission of a characteristic X-ray ... 8
Figure 4 - Production of bremsstrahlung X-rays ... 8
Figure 5 - Schematic representation of the photoelectric effect ... 9
Figure 6 - Schematic representation of the Compton effect. ... 10
Figure 7 - Schematic representation of pair production. ... 10
Figure 8 - Schematic representation of an interaction of an electron with an atom, where a is the atomic radius and b is the impact parameter [5]. ... 11
Figure 9 - Schematic representation of geometrical beam parameters - SSD, SAD and field size A. ... 13
Figure 10 - Dose deposition from a megavoltage photon beam in a patient. ... 14
Figure 11 - Example of beam profiles for two field sizes (10 x 10 cm2 and 30 x 30 cm2) and 10 MV X-ray beam at various depths in water... 15
Figure 12 - Linear accelerator ... 15
Figure 13 - Schematic representation of a linear accelerator. ... 16
Figure 14 - Schematic representation of a linac treatment head. ... 17
Figure 15 - Graphical representation of the volumes of interest. ... 26
Figure 16 - Differential DVHs for a prostate treatment plan for the target volume and a critical structure. ... 29
Figure 17 - Cumulative DVHs for the target volume and critical structures of the same prostate treatment plan of Figure 7. ... 29
Figure 18 - Schematic illustration of the elements of an active matrix, flat-panel imager. ... 31
Figure 19 - a-Si EPID panel mounted on a linac gantry. ... 32
Figure 20 - Basic design of a cylindrical Farmer type ionization chamber. ... 33
Figure 21 - Geometric representation of the theoretical concept of gamma evaluation method.. ... 35
Figure 22 - Schematic representation of linear accelerators used in the study. ... 399
Figure 23 - PTW QUICKCHECKwebline with ionization chamber position. ... 40
Figure 24 - Gamma Analysis for Garden Fence Test in Varian Portal Dosimetry ... 455
Figure 25 - Gamma analysis for Chair Test in Varian Portal Dosimetry ... 466
Figure 26 - Graphical representation of the age of DHX01 Head & Neck sample patients. ... 488
Figure 27 - Graphical representation of the age of DHX02 Head & Neck sample patients. ... 488
Figure 28 - Graphical representation of the age of DHX03 Head & Neck sample patients. ... 488
Figure 29 - Graphical representation of the age of DHX01 prostate sample patients. ... 50
Figure 30 - Graphical representation of the age of DHX01 prostate sample patients. ... 51
xvi
Figure 32 - Verification plan for ionization chamber, created with Varian Eclipse software ... 522
Figure 33 - Solid water phantom for verification with ionization chamber ... 522
Figure 34 - Long-term assessment over one year of CAX dose results registered daily during the QA control. ... 566
Figure 35 - Long-term assessment over one year of flatness results registered daily during the QA control. ... 577
Figure 36 - Long-term assessment over one year of X-axis symmetry results registered daily during the QA control... 599
Figure 37 - Long-term assessment over one year of Y-axis symmetry results registered daily during the QA control... 60
Figure 38 - Long-term assessment over one year of beam quality factor results registered daily during the QA control... 61
Figure 39 - Graphical representation of dose calibration factor obtained in trimestral QA. ... 633
Figure 40 - Graphical representation of X-axis symmetry obtained in trimestral QA. ... 644
Figure 41 - Graphical representation of Y-axis symmetry obtained in trimestral QA. ... 655
Figure 42 - Graphical representation of MLC transmission obtained in trimestral QA. ... 666
Figure 43 - Graphical representation of dosimetric leaf separation obtained in trimestral QA. ... 677
Figure 44 - Gamma analysis agreement values for Garden Fence test using 3.0 %, 3.0 mm criteria. ... 688
Figure 45 - Gamma analysis agreement values for Garden Fence test using 3.0 %, 0.5mm criterion. ... 699
Figure 46 - Gamma analysis agreement values for Chair test with a 3.0 %, 3.0 mm criteria. .... 70
Figure 47 - Field size dependence test output factors for a dose rate of 400 MU/min. ... 71
Figure 48 - Field size dependence test output factors for a dose rate of 600 MU/min. ... 722
Figure 49 - Linearity test output factors for a dose rate of 400 MU/min. ... 744
Figure 50 - Linearity test output factors for a dose rate of 600 MU/min. ... 744
Figure 51 - Graphical representation of DHX01 H&N sample TPS dose deviations for PTV54 between DHX01 original plans and DHX02/DHX03 recalculated plans. ... 788
Figure 52 - Graphical representation of DHX01 H&N sample TPS dose deviations for PTV59.4 between DHX01 original plans and DHX02/DHX03 recalculated plans. ... 788
Figure 53 - Graphical representation of DHX01 H&N sample TPS dose deviations for PTV70 between DHX01 original plans and DHX02/DHX03 recalculated plans. ... 799
Figure 54 - Graphical representation of DHX01 H&N sample TPS dose deviations for critical structures Dmax between DHX01 original plans and DHX02/DHX03 recalculate plans. ... 799
Figure 55 - Graphical representation of DHX01 H&N sample TPS dose deviations for organs-at-risk Dmax between DHX01 original plans and DHX02/DHX03 recalculated. ... 80
Figure 56 - Graphical representation of DHX01 H&N sample TPS dose deviations for organs-at-risk Dmean between DHX01 original plans and DHX02/DHX03 recalculated. ... 80
Figure 57 - Graphical representation of DHX02 H&N sample TPS dose deviations for PTV54 between DHX02 original plans and DHX01 recalculated plans. ... 81
xvii
Figure 58 - Graphical representation of DHX02 H&N sample TPS dose deviations for PTV59.4 between DHX02 original plans and DHX01 recalculated plans. ... 82 Figure 59 - Graphical representation of DHX02 H&N sample TPS dose deviations for PTV70 between DHX02 original plans and DHX01 recalculated plans. ... 82 Figure 60 - Graphical representation of DHX02 H&N sample TPS dose deviations for critical structures Dmax between DHX02 original plans and DHX01 recalculated plans. ... 83
Figure 61 - Graphical representation of DHX02 H&N sample TPS dose deviations for organs-at-risk Dmax between DHX02 original plans and DHX01 recalculated plans. ... 833
Figure 62 - Graphical representation of DHX02 H&N sample TPS dose deviations for organs-at-risk Dmean between DHX02 original plans and DHX01 recalculated plans. ... 844
Figure 63 - Graphical representation of DHX03 H&N sample TPS dose deviations for PTV54 between DHX03 original plans and DHX01 recalculated plans. ... 844 Figure 64 - Graphical representation of DHX03 H&N sample TPS dose deviations for PTV59.4 between DHX03 original plans and DHX01 recalculated plans. ... 855 Figure 65 - Graphical representation of DHX03 H&N sample TPS dose deviations for PTV70 between DHX03 original plans and DHX01 recalculated plans. ... 855 Figure 66 - Graphical representation of DHX03 H&N sample TPS dose deviations for critical structures Dmax between DHX03 original plans and DHX01 recalculated plans. ... 866
Figure 67 - Graphical representation of DHX03 H&N sample TPS dose deviations for organs-at-risk Dmax between DHX03 original plans and DHX01 recalculated plans. ... 866
Figure 68 - Graphical representation of DHX03 H&N sample TPS dose deviations for organs-at-risk Dmean between DHX03 original plans and DHX01 recalculated plans. ... 877
Figure 69 - Average gamma analysis agreement values for patient EPID verifications of DHX01 H&N sample using 3.0%, 3.0 mm criterion. ... 888 Figure 70 - Average gamma analysis agreement values for patient EPID verifications of DHX02 H&N sample, using 3.0 %, 3.0 mm criterion. ... 90 Figure 71 - Average gamma analysis agreement values for patient EPID verifications of DHX03 H&N Sample, using 3.0 %, 3.0 mm criterion. ... 922 Figure 72- Graphical representation of DHX01 prostate sample TPS dose deviations for PTVs 45-50 between DHX01 original plans and DHX02/03 recalculated plans. ... 966 Figure 73 - Graphical representation of DHX01 prostate sample TPS dose deviations for PTVs 74-78 between DHX01 original plans and DHX02/03 recalculated plans. ... 966 Figure 74 - Graphical representation of DHX01 prostate sample TPS dose deviations for organs-at-risk (bladder and rectum) between DHX01 original plans and DHX02/03 recalculated plans. ... 977 Figure 75 - Graphical representation of DHX01 prostate sample TPS dose deviations for organs-at-risk (femur heads and bulb of penis) between DHX01 original plans and DHX02/03
recalculated plans. ... 977 Figure 76 - Graphical representation of DHX02 prostate sample TPS dose deviations for PTVs 45-50 between DHX02 original plans and DHX01 recalculated plans... 988 Figure 77 - Graphical representation of DHX02 prostate sample TPS dose deviations for PTVs 45-50 between DHX02 original plans and DHX01 recalculated plans... 988 Figure 78 - Graphical representation of DHX02 prostate sample TPS dose deviations for organs-at-risk (bladder and rectum) between DHX02 original plans and DHX01 recalculated plans. . 999
xviii
Figure 79 - Graphical representation of DHX02 prostate sample TPS dose deviations for organs-at-risk (femur heads and bulb of penis) between DHX02 original plans and DHX01 recalculated plans. ... 999 Figure 80 - Graphical representation of DHX03 prostate sample TPS dose deviations for PTVs 45-50 between DHX03 original plans and DHX01 recalculated plans... 100 Figure 81 - Graphical representation of DHX03 prostate sample TPS dose deviations for PTVs 74-78 between DHX03 original plans and DHX01 recalculated plans... 100 Figure 82 - Graphical representation of DHX03 prostate sample TPS dose deviations for organs-at-risk (bladder and rectum) between DHX03 original plans and DHX01 recalculated plans. . 101 Figure 83 - Graphical representation of DHX03 prostate sample TPS dose deviations for organs-at-risk (femur heads and bulb of penis) between DHX03 original plans and DHX01 recalculated plans. ... 101 Figure 84 - Average gamma analysis agreement values for patient EPID verifications of DHX01 prostate sample, using 3.0 %, 3.0 mm criterion. ... 102 Figure 85 - Average gamma analysis agreement values for patient EPID verification of DHX02 prostate sample, using 3.0 %, 3.0 mm criterion. ... 104 Figure 86 - Average gamma analysis agreement values for patient EPID verifications of DHX03 prostate sample, using 3.0%, 3.0 mm criterion. ... 107 Figure 87 - TPS and experimental dose values obtained for DHX01 sample with the verifications with ionization for DHX01 and DHX02 linacs. ... 109 Figure 88 - TPS and experimental dose values obtained for DHX02 sample with the verifications with ionization for DHX01 and DHX02 linacs. ... 110
xix
List of Abbreviations
3DCRT – Three-dimensional Conformal Radiation Therapy AAA – Anisotropic Analytical AlgorithmAMFPI – Active matrix, flat panel imager a-Si – Amorphous Silicon
BQF – Beam Quality Factor CAX – Dose in Central Axis CT – Computed Tomography
DDR – Digitally Reconstructed Radiograph DLS – Dosimetric Leaf Separation
DMLC – Dynamic Multileaf Collimator DTA – Distance-to-Agreement
DVH – Dose-Volume Histogram EBRT – External Beam Radiotherapy EPID – Electronic Portal Imaging Device IMAT – Intensity-Modulated Arc Therapy IMRT – Intensity Modulated Radiation Therapy Linac – Linear Accelerator
MC – Monte Carlo
MLC – Multileaf Collimator
MRI – Magnetic Resonance Imaging PDP – Portal Dose Prediction
PET – Positron Emission Tomography QA – Quality Assurance
RF – Radiofrequency
SMLC – Segmented Multileaf Collimator SAD – Source-Axis Distance
SDD – Source- Detector Distance SSD – Source-Surface Distance TFT – Thin-Film Transistor
xx TPS – Treatment Planning System
1
Chapter 1
Motivation
The use of radiations for therapy began soon after the discovery of X-rays in 1895, experiencing a great evolution in X-rays generating technology and allowing to obtain high energy photon and electron beams. Currently, linear accelerators are the most used high energy X-ray generators in Radiotherapy, due to its versatility [5].
Linear accelerators technology has significantly improved in last decades, allowing the generation of more accurate and reproducible beams, leading to an increasing effort from the manufactures to standardize the design and technology of linear accelerators [6]. This standardization represents an increase in treatment flexibility and efficiency, since, if the linear accelerators of an unit are dosimetrically equivalent, it is possible to indistinctly interchange patients between the machines, without replanning, in case of interruption of the functioning of one of the linear accelerators, continuing the treatment in other equipment.
The possibility of indistinct use of the linear accelerators is of major importance for a treatment unit, since the interruptions of the normal functioning of the linear accelerators are frequent, due either to preventive maintenance interventions or equipment damage.
For this reason, it has become common, in Radiotherapy facilities, the installation of linear accelerators with beam-matching in relation to a previously installed equipment, creating a dosimetric equivalence that allows the indistinct use of the linear accelerators.
However, several factors can cause variations in the functional characteristics of the linear accelerators, as conditions of use or component wear, which creates the need of verifying if the dosimetric equivalence is maintained in the long-term or significant differences in the dosimetric characteristics start to occur, justifying the adaptation of the treatment planning system to the new parameters.
Several studies have been already performed in this subject [1-4], but an identical evaluation was considered necessary for the particular case of the Radiotherapy Service of IPOLFG, since, as already mentioned, several factors can influence the stability of the dosimetric characteristics of the linear accelerators and, for this reason, it is not viable to adapt the results obtained in other studies for the Service.
2
Consequently, a verification of beam characteristics of 6 MV photons of the three similar linear accelerators installed in the service was performed, by means of the analysis of daily and trimestral quality assurance procedures, in order to verify the stability of the parameters and if significant differences between the three linear accelerators were obtained.
Moreover, the main purpose of present work was to perform an intercomparision for Intensity Modulated Radiotherapy (IMRT) treatments, since the use of multileaf collimators (MLC) and small fields can lead to an increased influence of small variations in beam characteristics, justifying the need of analyzing the dosimetric equivalence of linear accelerators in particular for this technique [6]. Therefore, comparisons were performed between dose distributions from treatment plans obtained for the three linear accelerators with experimental dose distributions obtained both with the original plan equipment and with the other two linear accelerators, without replanning before the change to a different unit. The experimental dose was obtained using Electronic Portal Imaging Device (EPID) and ionization chamber, which allow the comparison of the experimental and expected dose fluences and values, respectively.
At the IPOLFG, only two of the three accelerators considered in the study were installed as beam-matched. For this reason, two different aspects were analyzed in the present study. The first was the verification, at the long-term, of the dosimetric equivalence of the beam-matched linear accelerators and if this equivalence is also verified for IMRT treatments. The other aspect in study was the possibility of using indistinctly a third linear accelerator, previously installed in the service without beam-matching, as dosimetric equivalent to the other two linear accelerators for IMRT treatments.
3
Chapter 2
Introduction to External Radiotherapy: the IMRT
concept
2.1. Brief Introduction
Radiotherapy is a branch of medicine that uses ionizing radiation in the treatment of malignant disease [5]. This treatment modality has become widely used in the treatment of cancer due to its efficacy in tumor cells eradication, caused by the ionization of matter, process by which one or more electrons are liberated in collisions of the particles with atoms or molecules, and its simultaneous ability to spare normal tissues [7, 8]. Radiotherapy is divided in two branches: external beam radiotherapy (EBRT), in which the radiation source is external in relation to the patients, and brachytherapy (BT), in which the radiation source is placed inside or in contact with the target region [9].
The beginning of radiotherapy was impelled by discovery of X-rays by Wilhelm Röntgen in 1895. Further investigation on this new type of radiation lead to a fast understanding of its radiographic and therapeutic potential, with several applications in oncologic pathologies during the year of 1896 [5].
The evolution of radiotherapy during 20th century was also marked by the discovery of
natural radioactivity by Becquerel in 1896, the isolation of a new radioactive chemical element, radium, used in external beam radiotherapy in the following years, by Marie and Pierre Curie in 1898, the production of artificial radioactive elements by Irène Curie and Fréderic Joliot in 1934, which lead to the adoption of cobalt 60 (60Co) as an alternative source of high energy radiation,
and a progressively more profound understanding of atomic and nuclear structures [8, 9]. In the beginning, external beam radiotherapy treatments were performed with X-ray tubes, similar to the Crookes tube used by Röntgen in the experiments that led to the discover of X-rays [9]. In 1913, William Coolidge developed the “hot-cathode tube” that did not need gas for the production of X-rays. This tube contained a cathode, which was a tungsten filament heated by a low-voltage circuit and a target that functioned as an anode. Electrons were originated in
4
the cathode due to the thermionic effect caused by the heating. These electrons were accelerated in the vacuum towards the target by a constant potential electrostatic field [5, 10, 11].
In parallel, high energy photon treatments were performed with radium, which was the only source of γ-rays during almost two decades, using radium needles and tubes placed a few centimeters away from the patient [10].
The 60Co unit was invented by H.E. Johns in the early 1950s and allowed higher photon
energies, placing the cobalt unit at the forefront of radiotherapy for decades. The 60Co
radioisotope is produced from the irradiation of 59Co (natural element) with neutrons, in a
nuclear reactor, and is then stored in a sealed source. The 60Co isotope decays emitting γ-rays
with energies of 1.17 and 1.33 MeV [5, 9].
In 1950s, a new device was developed by several investigators, including Varian brothers and Henry Kaplan. This new device, called linear accelerator (linac), generates high energy X-rays and electrons, which had been reported since the 1930s as advantageous for cancer therapy [10, 12]. This equipment became soon after the most used radiation source in modern radiotherapy, due to its versatility and wide range of energies [5].
2.2. The technological evolution: from 2D to IMRT
In the last decades, the ability of identifying cancer cells and target them with radiation has greatly improved, as a result of technological progresses. These advances lead to an evolution from two-dimensional (2D) radiotherapy, which consisted of a single beam, usually with opposed lateral fields or four-field “boxes” and was based on two-dimensional X-ray images and hand calculations, to three-dimensional (3D) radiotherapy [13].
The increasing use of computed tomography (CT), which allowed three-dimensional treatment planning, making non-coplanar beams possible to plan and deliver, had a great influence in the evolution from 2D to 3D radiotherapy techniques. Additionally, linear accelerators became equipped with electronic MV portal (EPID) and kilovoltage imaging systems for verification of patient positioning, improving the conformity between the planned and delivered absorbed doses. Digitally reconstructed radiographs (DRRs) were constructed from CT scans by digitally simulating the passage of X-rays through the patient’s CT representation in the same geometry as the treatment and could be compared with X-ray images acquired at the time of treatment to verify the patient treatment position. These innovations allowed the implementation of three-dimensional conformal radiation therapy (3D-CRT), which uses 3D planning techniques and special delivery systems to shape the field, in order to obtain a more accurate treatment delivery to tumors. In relation to conventional approaches, 3D-CRT tends to use more treatment fields and reduces the absorbed dose to normal tissues surrounding the target volume, while potentially allowing higher tumor absorbed doses, as well as increasing the conformity between the delivered and planned doses [14].
5
Another important advancement in external beam radiation therapy was the introduction of multileaf collimators (MLC) in linacs (Figure 1), designed to replace the molded heavy metal blocks used in conventional radiotherapy used to deliver coplanar beams, usually of relatively uniform intensity across the field. The MLC consists in individual leaves (80-120) of high atomic material moving independently. MLCs allowed the use of multiple complex-shaped fields, even in the same treatment session [14].
Multileaf collimators improved greatly 3D-CRT technique due to its ability to replace the use of wedges or compensators to account for a curved or sloping patient entering surface. This replacement simplifies the attempts to make the beam shape conform to the tumor shape and to achieve absorbed-dose distributions with improved homogeneity [14].
Multileaf collimators also allowed to modulate the intensity of radiation fields, leading to the development of Intensity-Modulated Radiotherapy (IMRT). This technique derived from the prediction that the optimal radiation pattern from any single direction was typically non-uniform and that a set of intensity modulated beams from multiple directions could be designed to produce dose homogeneity within the tumor similar to that from conventional radiotherapy but with superior conformity, especially for complex-shaped volumes, thereby sparing adjacent normal tissues. IMRT also allows the production of non-uniform absorbed-dose distributions if required for treatment of a volume within another volume (concomitant boost or simultaneous integrated boost techniques). IMRT attempts to achieve more optimal absorbed-dose distributions by varying the beam intensity (or fluence, which can be defined as the quotient between the number of particles incident on a given sphere and the cross-sectional area of that sphere [7]) within each incident beam, usually by subdividing the beam into smaller segments and modulated each to achieve a selected fluence contribution [14].
Figure 1 - Varian’s 120-leaf Millenium MLC
6
The calculation of the fluence required from each beam segment has only recently became viable with the development of computational algorithms taking an iterative approach to dose calculation and referred to as “inverse treatment planning”, which means that the treatment planning starts at the desired result and is performed backwards to establish the best way to achieve that result [14].
There are two main ways of delivering IMRT, both using multileaf collimators [5]:
segmented MLC (SMLC), often referred to as “step-and-shoot” mode, which is a static technique, since there is no MLC motion while the beam is turned on, with the intensity modulated fields delivered with a sequence of small segments or subfields, each subfield with a uniform intensity. The beam is only turned on when the MLC leaves are stationary in each of the prescribed subfield positions.
dynamic MLC (DMLC), also referred to as “sliding-window” mode, which is a dynamic technique, with the intensity modulated fields delivered in a dynamic way with the leaves of the MLC moving during the irradiation of the patient. For a fixed gantry position the opening formed by each pair of opposing MLC leaves is swept across the target volume under computer control with the radiation beam turned on to produce the desired fluence map.
The advantages of IMRT are significant in concave target volumes where organs at risk are surrounding the volume, such as for head and neck or prostate treatments. In the case of head and neck pathologies, an increased therapeutic gain is achievable with IMRT in tumors close to the base of the skull, for which a higher rate of local control and a lower incidence of complications have been reported in comparison with conventional techniques. A substantial reduction in late radiation-induced toxicity have been reported, without any reduction in local tumor control. A decrease of rectal complications was also observed in prostate treatments with IMRT in relation to conventional techniques [14].
Over the past decades, there have been significant advances in the delivery of IMRT radiotherapy technique. IMRT can be delivered with rotational techniques, as intensity-modulated arc therapy (IMAT) and tomotherapy [14].
Figure 2 - Comparison of 3D-CRT (left) and IMRT (right), with target volume represented by the black region and volume at risk represented by gray region. IMRT beams can have highly non-uniform beam intensities and are capable of producing more concave-shaped absorbed-dose distribution, better avoiding the volume at risk, as
7
IMAT uses conventional linear accelerators and MLCs, as well as a dynamic MLC approach, while the gantry rotates around the patient [5, 14]. To deliver intensity-modulated fields, IMAT can require several rotational arcs each with different patterns of irradiation, since a single rotation yields only a step-wise intensity pattern, either open or blocked, from each arc segment through which the arc passes, while multiple arcs allow more intensity levels. However, it has been shown that controlled variation of absorbed-dose rate during the gantry rotation can achieve some intensity modulation of the beam even if a single rotation is delivered [14]. This observation lead to the implementation of volumetric-modulated arc therapy (VMAT), a single-arc form of IMAT that delivers apertures of varying weights with a single-single-arc rotation and dose-rate variation [15].
Tomotherapy is also an intensity-modulated rotational therapy, but uses a narrow CT-like fan beam modulated by a binary collimator. The binary collimator has multiple leaves, specifically designed for rotating fan beams. It is called a binary collimator due to the rapid leaf movements from the closed position to the open position through the fan beam to expose the source. The amount of time a leaf remains in the open position determines the intensity delivered by the sub-beam or “beamlet”. The fan-beam width is collimated by a pair of jaws above the binary MLC. In the first form of tomotherapy, serial tomotherapy, a fan beam is rotated around the patient with the couch fixed. In helical tomotherapy, mostly used currently, the fan beam rotation and the couch move simultaneously so that the radiation source describes a helical pattern in relation to the patient [14].
Both modalities achieve superior target dose quality in a range of tumor sites when compared to static IMRT and require lower radiation doses, with shorter treatment times than static IMRT [16]. However, there are some differences between both techniques: IMAT must account for restrictions on MLC movements as the gantry moves from one beam angle to the next, while in tomotherapy these restrictions do not exist due to the use of a binary MLC. On the other hand, IMAT uses a conventional linac, thus can be delivered with the same treatment unit than other treatments [15].
2.3. Fundamentals of radiotherapy physics and dosimetry
2.3.1. Interaction of ionizing radiation with matter
Radiation can be classified into two main categories, non-ionizing radiation and ionizing radiation, depending on its ability to ionize matter [5]. Unlike non-ionizing radiation, ionizing radiation have the ability to excite and ionize atoms of matter with which they interact [17]. Ionization is the process in which an atom or molecule gains or loses an electron, acquiring positive or negative charge. For this reason, ionizing radiation are used in radiotherapy, due to its ability to cause ionization of malignant cells. The ionization of matter due to the action of ionizing radiation can occur directly or indirectly [5, 17]:
8
Directly ionizing radiation deposits energy in the medium through direct interactions between charged particles and orbital electrons of atoms in the medium;
Indirectly ionizing radiation consists of neutral particles (photons or neutrons), which deposit energy in the medium through a two-step process. In the first step, energy is transferred from the radiation to charged particles in the medium. In the second step, these charged particles deposit their energy to the medium through interactions with orbital electrons of the atoms.
Both directly and indirectly radiations are used in radiotherapy. Directly ionizing radiations (as electrons and protons) are mainly used for superficial lesions, due to its lower penetration in the tissues, while indirectly ionizing radiations (as X- and γ- rays) are widely used in radiotherapy, due to its higher power of penetration in the tissues, which results from the lower probability of this radiation of interacting with matter.
2.3.1.1. Photon interactions in matter
Depending on their origin, the indirectly ionizing radiation can be classified into three main categories [5]:
Characteristic or discrete X-rays, which are emitted in transitions of orbital electrons from one allowed orbit to a vacancy in another allowed orbit. In some cases, instead of a characteristic X-ray, an orbital electron, or Auger electron, can be ejected, as a result of this interaction;
Bremsstrahlung or continuous X-rays, which are emitted through interactions between an incident electron and a nucleus. During the interaction, the incident electron is decelerated and lose some of its kinetic energy in the form of bremsstrahlung.
Figure 3 - Emission of a characteristic X-ray [18].
9
γ-rays, emitted due to nuclear transitions in γ decay, in which an excited nucleus attains the ground state.
There are five major types of interactions with matter by X- and γ- rays, consisting of indirectly ionization processes [17]:
Photoelectric effect; Compton effect; Pair production;
Rayleigh (coherent scattering); Photonuclear interactions.
Photoelectric effect
In the photoelectric effect, an incident photon with energy ℎ𝜈 interacts with a tightly bound orbital electron and disappears, while the electron is ejected from the atom as a photoelectron with a kinetic energy 𝐸𝐾 given as:
𝐸𝐾= ℎ𝜈 − 𝐸𝐵 (2.1)
where ℎ𝜈 is the incident photon energy and 𝐸𝐵 is the binding energy of the electron [5].
The electron is ejected with an angle θ in relation to the photon’s direction of incidence, carrying a momentum p. The atom from which the electron was removed suffers a very slight deviation in the direction taken for momentum conservation [17].
The photoelectric effect occurs mostly for electron in the inner shells of atoms with high atomic number, which present higher binding energies. The occurrence of the photoelectric effect is also more likely to occur for photons with low ℎ𝜈, as long as ℎ𝜈 > 𝐸𝐵, since, when both energies are similar, the photon is totally absorbed in the interaction, ceasing to exist [17].
Compton effect
The Compton effect represents an interaction between a photon and an essentially free and stationary orbital electron from the outer shells of an atom. The incident photon energy ℎ𝜈 is much larger than the binding energy of the electron. During the collision, the photon loses part of its energy to the electron, which is ejected with an angle 𝜙 in relation to the incident photon,
Figure 5 - Schematic representation of the photoelectric effect (adapted from [18]).
𝑒−
𝑒−
𝐸𝐾
10
with a kinetic energy 𝐸𝐾. The photon is scattered through an angle 𝜃 and with an energy ℎ𝜈’< ℎ𝜈 [5].
Pair production
Pair production is an absorption process in which a photon disappears, producing an electron and a positron [17]. Usually, it occurs near an atomic nucleus and has an energy threshold equal to the sum of the kinetic energies of the produced particles at rest, since that is the energy required to produce the mass of the electron-positron pair. The probability of occurrence of the pair production process increases rapidly with photon energy above the threshold. Although with lower probability, this effect can also take place in the field of an atomic electron, in a process usually called triplet production, since three particles share the available energy (an electron-positron pair and the orbital electron) [5, 17].
Coherent (Rayleigh) scattering
In coeherent (Rayleigh) scattering the photon interacts with a bounded orbital electron, with a combined action of the whole atom. It is an elastic event, since the photons loses essentially none of its energy and is scattered through a small angle [5]. Coherent scattering has more practical importance at lower energies, since for low energy values the scattering angle is greater. However, the importance of this effect in tissue and tissue equivalent materials is small in comparison with other photon interactions [5].
Figure 6 - Schematic representation of the Compton effect (adapted from [18]).
𝑒+
𝑒−
Figure 7 - Schematic representation of pair production (adapted from [17]). 𝑒− 𝑒− 𝐸𝐾= ℎ𝜈 − ℎ𝜈′ 𝐸𝐾= ℎ𝜈′ 𝜃 𝜙
11 Photonuclear interactions
In a photonuclear interaction an energetic electron enters and excites a nucleus, which then emits a proton or a neutron [17]. This type of interaction has a much smaller probability of occurrence than the other photon interactions and, for this reason, does not play an important role in radiation in clinical applications. However, photonuclear interactions are of concern for radiation protection in the case of high energy radiotherapy treatments because of the neutron production and of the radioactivity that is induced in the treatment room air and in machine components [5].
2.3.1.2. Electron interactions in matter
An energetic electron interacts with matter through Coulomb interactions with atomic orbital electrons and atomic nuclei, in which the electron may lose its kinetic energy (collision and radiative losses) or change its direction of travel (scattering) [5]
The collision between an incident electron and an orbital electron or nucleus of an atom may be elastic or inelastic. In the case of elastic collision, the electron is deflected from the original path, but it does not lose energy, while in an inelastic collision the electron is deflected from its original path and loses some of its energy. The lost energy is transferred to an orbital electron or emitted in the form of bremsstrahlung. Energetic electrons experiences a series of collisions as they traverse a medium. The type of interaction that an electron undergo with an atom of atomic radius 𝑎 depends on the impact parameter 𝑏 of the interaction, defined as the perpendicular distance between the electron direction before the interaction and the atomic nucleus [5], as can be observed in Figure 8:
For 𝑏 ≫ 𝑎 the electron will undergo a soft collision with the whole atom. Only a small amount of energy will be transferred from the incident electron to orbital electrons; For 𝑏 ≈ 𝑎 the electron will undergo a hard collision with an orbital electron and an appreciable fraction of the electron’s kinetic energy will be transferred to the orbital electron;
For 𝑏 ≪ 𝑎 the incident electron undergoes a radiative interaction (collision) with the atomic nucleus. The electron will emit a photon (bremsstrahlung) with energy
Figure 8 - Schematic representation of an interaction of an electron with an atom, where a is the atomic radius and b is the impact parameter [5].
12
between zero and the incident electron kinetic energy. The energy of the emitted bremsstrahlung photon is inversely proportional to the magnitude of the impact parameter 𝑏.
2.3.2. Basic clinical radiation dosimetry
Radiation dosimetry deals with methods for a quantitative determination of energy deposited in a given medium by ionizing radiation. A number of quantities and units have been defined for describing radiation beams [5], and the most relevant are described below:
Fluence and Energy Fluence
The fluence,𝛷, is the quotient of 𝑑𝑁 by 𝑑𝑎, where 𝑑𝑁 is the number of particles incident on a sphere of cross-sectional area 𝑑𝑎 [7]:
𝛷 =𝑑𝑁𝑑𝑎. (2.2)
The energy fluence, 𝛹, is the quotient of 𝑑𝑅 by 𝑑𝑎, where 𝑑𝑅 is the radiant energy, which is the energy of the particles that are emitted, transferred or received (excluding rest energy), incident on a sphere of cross sectional area 𝑑𝑎 [7]:
𝛹 =𝑑𝑅
𝑑𝑎. (2.3)
The unit of fluence is m-2 and the unit of energy fluence is J.m-2. The use of a sphere of
cross-sectional area 𝑑𝑎 expresses in the simplest manner the fact that one considers an area 𝑑𝑎 perpendicular to the direction of each particle [7].
Kerma
The kerma, 𝐾, for ionizing uncharged particles, is the quotient of 𝑑𝐸𝑡𝑟 by 𝑑𝑚, where 𝑑𝐸𝑡𝑟 is the mean sum of the initial kinetic energies of all the charged particles liberated in a mass 𝑑𝑚 of a material by the uncharged particles incident on 𝑑𝑚 [7]:
𝐾 =𝑑𝐸𝑑𝑚𝑡𝑟 . (2.4)
𝐾 quantifies the average amount of energy transferred from indirectly ionizing radiation to directly ionizing radiation [5].
13
The absorbed dose, 𝐷, is the quotient of 𝑑𝜀̅ by 𝑑𝑚, where 𝑑𝜀̅ is the mean energy imparted by ionizing radiation to matter of mass 𝑑𝑚 [7]:
𝐷 = 𝑑𝜀̅
𝑑𝑚. (2.5) Geometric parameters: SSD, SAD, Beam Central Axis and Field Size
The geometric parameters are of major importance for positioning the patient in relation to the radiation source and for a correct dose delivery.
Figure 9 shows the most relevant geometric beam parameters: SSD, SAD and field size A. SSD, or source-surface distance, is the distance between the source and the surface of the phantom or patient skin. SAD, or source-axis distance, is the distance between the source and a point P located in the center of the target volume. SAD corresponds to the sum of the SSD and the depth 𝑧 at which the target point is located [19].
The field size A is the cross section of the beam, commonly at the surface of the phantom or patient, but it can also be specified for a depth 𝑧 [19].
The beam central axis corresponds to the vertical dashed line represented in Figure 9 and consists in the geometric center of the beam [19].
Percentage Depth Dose
A direct measurement of the dose distribution inside the patient is essentially impossible, yet it is necessary to know precisely and accurately the dose distribution in the irradiated volume for a successful outcome of treatments. This is usually achieved through the use of several functions that link the dose at any arbitrary point inside the patient to the known dose at the beam calibration (or reference) point in a phantom.
A typical dose distribution on the central axis (absorbed dose variation with depth) of a megavoltage photon beam striking a patient is represented in Figure 10. The beam enters the patient on the surface, where it delivers a certain surface dose Ds. Beneath the surface the dose
A
Figure 9 – Schematic representation of geometrical beam parameters - SSD, SAD and field size A (adapted from [5]).
14
first rises rapidly, reaches a maximum value at depth zmax and then decreases almost
exponentially until it reaches a value Dex at the patient’s exit point [5].
Central axis dose distributions inside a patient or phantom are usually normalized to Dmax =
100% 1at the depth of dose maximum zmax and referred to as percentage depth dose (PDD)
distributions [5].
Off-axis beam profiles
In addition to dose distributions along the central axis, off-axis dose profiles can be obtained. Beam profiles are graphical representations of absorbed dose distribution in function of the distance to the beam central axis, measured perpendicularly to the axis at a given depth. An example is shown in Figure 11.
Figure 10 - Dose deposition from a megavoltage photon beam in a patient. Ds is the surface dose at the beam
entrance surface, Dex is the surface dose at the beam exit site and Dmax is the dose maximum often normalized to
15
Off-axis beam profiles can be obtained for x and y axis, with the denomination of crossline and inline profiles, respectively.
2.4. Medical Linear Accelerators
2.4.1. General Concepts
A linear accelerator is an isocentrically mounted machine that uses high-frequency electromagnetic waves to accelerate electrons to energies in the range of 4-25 MeV, using linear acceleration structures. These electron beams can be directly used for superficial lesions or transformed in high-energy X-rays, after collision with a target [9].
Figure 12 - Linear accelerator [https://www.varian.com/oncology/products/treatment-delivery/clinac-ix] Figure 11 - Example of beam profiles for two field sizes (10 x 10 cm2 and 30 x
16
Modern linacs are usually capable of emitting two X-ray energies, 6 MV and another in the range 10-23 MV, as well as a wide range of electron energies. It is divided in five major sections, as it can be seen on Figure 13: gantry, gantry stand or support, modulator cabinet, patient support assembly (treatment table) and control console [5].
For the beam generation, the main components of modern medical linacs involved are [5]: Injection system, or electron gun;
RF power generation system; Accelerating waveguide;
Auxiliary system (vacuum pump, cooling system, among others); Beam transport system;
Beam collimation and beam monitoring system.
The injection system, also called electron gun, is the source of electrons, containing a heated filament cathode and a perforated anode. Electrons are emitted thermionically from the heated cathode, focused into a pencil beam by a curved focusing electrode and accelerated towards the anode, through which they pass to the accelerator waveguide, due to the action of electrostatic fields [5, 20].
In the accelerating waveguide, microwave radiation is used to accelerate the electrons produced in the electron gun to the desired kinetic energy. For the production of the microwave radiation, a RF power generation system is used, consisting of a pulsed modulator and an RF power source [5]. The pulsed modulator applies synchronized high frequency, high current and short duration pulses to the electron gun and the RF power source [5, 20]. The RF power source can be a magnetron or a klystron. The functioning of both consists in accelerate and decelerate electrons in vacuum in order to produce high power RF. However, a magnetron produces high power RF, while a klystron is a power amplifier that amplifies RF generated by a low power oscillator (RF driver) [5].

![Figure 32 - Verification plan for ionization chamber, created with Varian Eclipse software [25]](https://thumb-eu.123doks.com/thumbv2/123dok_br/18194722.875648/72.892.208.686.342.699/figure-verification-ionization-chamber-created-varian-eclipse-software.webp)