The Surface Measurement of Fibre Orientation Anisotropy and Misalignment Angle by Laser Diffraction
6
0
0
Texto
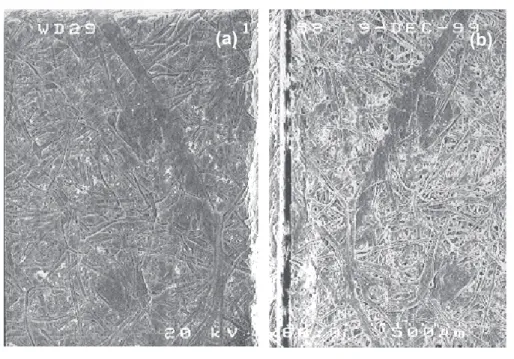
(2) The method is based on the propagation of ultrasonic signals through the fibre web. The emission and detection of the transmitted signals are achieved using multiple sensors, which are arranged in a circle (eight pairs of emitters and receivers), to record the elapsed time between emission and detection. Knowing the distance between them, one can calculate the propagation speed of the ultrasonic signals in different directions, which is related to the specific elastic modulus of the sample. In this way, the directions of maximum and minimum elastic stiffness in the sheet can be identified. This property is called tensile stiffness index (TSI). The angle difference between the maximum elasticity and the MD is the tensile stiffness orientation angle (TSO). Usually, the TSO value is assumed by the paper industry to be equal to the angle of fibre orientation. This is true only if the web structure is free of any internal tension or elongation. For machine-made papers, the fibre web structure is not free of internal tension and elongation [16,17] and the TSO value is equal to the fibre orientation plus tension and elongation. Another parameter derived from this ultrasonic analysis is the TSI ratio (related to fibre anisotropy), which is the ratio of the TSI along the MD and cross-direction (CD).. (a). (b). Fig. 1. Scanning electron micrography of (a) the top surface replica of a common paper sheet and (b) the corresponding paper surface. Magnification X60, 20 kV, scale 500 mm.. This paper proposes and describes a new optical method based on laser diffraction analysis to measure the anisotropy and the fibre orientation distribution in surface replicas of the fibre web. For this reason, it can be included in the second category. The results obtained from a set of reference paper sheet samples are presented, and compared with published results [6,10] that have been obtained using the methods described above.. (a). (b). PRINCIPLE OF THE PROPOSED METHOD The proposed method is based on the analysis of laser diffraction patterns produced by transparent replicas of the fibre web surfaces. Using a plane-parallel beam of laser light to illuminate a transparent surface replica, one can create a Fraunhofer diffraction pattern by focussing the light diffracted by the surface replica using a lens. The diffraction pattern obtained, which is the two-dimensional Fourier transformation of the paper replica, is an elliptical shape with a specific ellipticity ratio, a/b, and orientation, where a and b are the major and the minor axes of the ellipse. The major axis always appears rotated 90° with respect to the main orientation of the fibres. The density of orientation of straight fibre segments in a fibre web can be expressed by the radius of curvature of an equivalent contour involved by fibres in the texture plane. This concept is called the equivalent pore model, where an elliptical contour fits the structure feature [11,12]. Thus, only two parameters are sufficient to represent the fibre distribution: the ellipticity ratio of the elliptical contour (fibre anisotropy), and the direction of its major axis (fibre orientation angle). 342. Fig. 2. Scanning electron micrography of (a) the bottom surface replica of a common paper sheet and (b) the corresponding paper surface. Magnification X60, 20 kV, scale 500 mm.. REPLICA PRODUCTION PROCEDURE High-quality surface replicas of fibre webs can be obtained using a 0.25 mm thick polystyrene plastic film (ref. 12-4763-00, Plastic Films Co., Schiller Park, IL, USA). The negative replica of the surface can be registered by pressing the film against the web surface using pressure in the range 300–350 kPa at 115ºC for 20 min. One can simultaneously produce replicas of both surfaces using these conditions. The quality of the replicas is evaluated and con-. trolled by microscopic observations (optical microscopy or scanning electron microscopy) to guarantee 5.0–10 mm depth penetration, depending on fibre thickness. Figures 1 and 2 show the two surface replicas of a common printing paper sheet (a), and the corresponding paper surface (b) observed by scanning electron miscroscopy. The image of the replica is a mirror image of the paper surface, and it is very difficult to distinguish the paper surface from the replica, although the replica corresponds to the negative print of the surface.. JOURNAL OF PULP AND PAPER SCIENCE: VOL. 28 NO. 10 OCTOBER 2002.
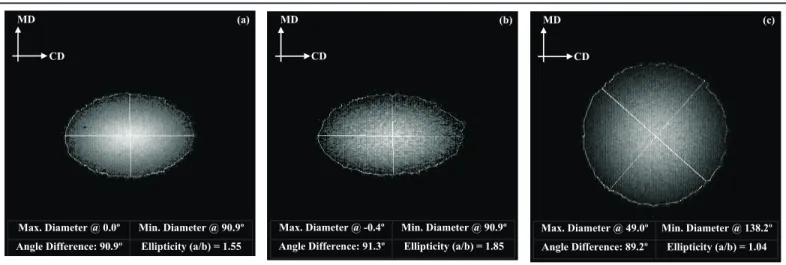
(3) EXPERIMENTAL OPTICAL APPARATUS To capture the Fraunhofer diffraction patterns created by surface replicas for later computer processing, an experimental optical apparatus has been developed and implemented in the laboratory, as shown schematically in Fig. 3. It uses a He–Ne laser beam (l = 632.8 nm), a spatial filter SP and a collimating lens L1 to produce a plane-parallel beam of light to illuminate the replica web surface Q, where the y direction corresponds to the MD of the paper sample. All of the light passing through and deviated by the replica is collected by a large aperture Fourier lens L2. This lens creates a Fraunhofer diffraction pattern at the focal point where a solid-state sensor, charge-coupled device (CCD), is placed for digital image acquisition. The solid-state sensor is connected to a frame grabber that is installed in a digital computer. Thus, it is possible to record the diffraction pattern intensity distributions as digital images with 512 x 512 pixels and 256 grey levels (8 bits per pixel). Figure 4 shows typical images of the diffraction pattern intensity distributions obtained using the described apparatus. In particular, Figs. 4(a) and (b) show the top-side and bottom-side patterns for an anisotropic paper. sample, and Fig. 4(c) shows a pattern for a quasi-isotropic paper sheet sample. The corresponding MDs and CDs are shown in the figures. The apparatus was constructed to perform a controlled scan of the replicated web surface using an XY positioning table. The scanned area goes up to 200.0 x 200.0 mm and the scan steps can be adjusted to between 40 mm. and 20.0 mm for a sequential XY scan. Random scans are also possible within a predetermined area of scan. The diameter of the collimated laser beam can be adjusted to between 4.0 and 30.0 mm. During the scanning process, the computer saves all the data acquired from the CCD detector at each predetermined position. Several algorithms, specifically implemented to Q. CCD Laser SP y. L1. x. L2. Fig. 3. Optical apparatus for diffraction analysis.. Fig. 4 . Typical diffraction intensity distributions. Anisotropic paper: (a) top side and (b) bottom side. (c) Quasi-isotropic paper.. Fig. 5. Results of the diffraction analysis. Anisotropic paper surface: (a) top side and (b) bottom side. (c) Quasi-isotropic paper surface. JOURNAL OF PULP AND PAPER SCIENCE: VOL. 28 NO. 10 OCTOBER 2002. 343.
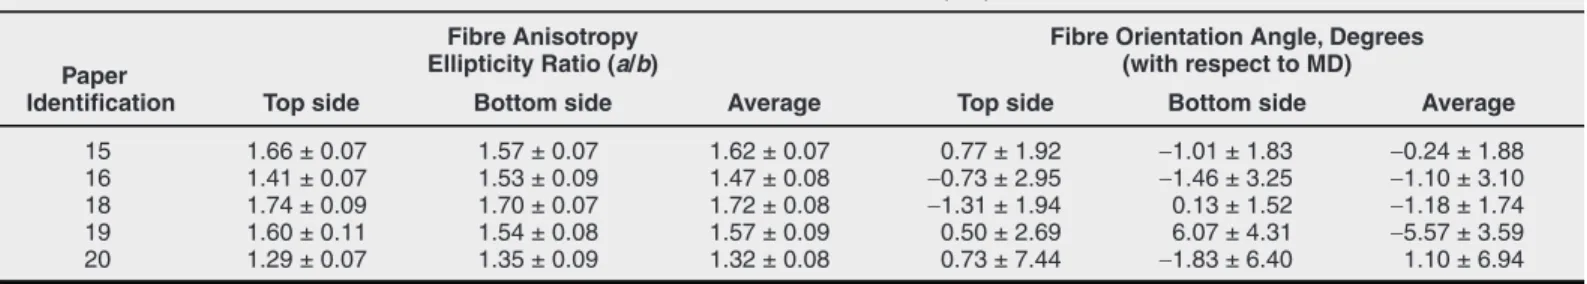
(4) evaluate anisotropy and fibre orientation, may then be applied to the recorded data to complete the analysis. In general, the basic algorithm applied to analyze each diffraction pattern intensity distribution finds the best equi-intensity contour to compute the ellipticity ratio and the direction of its major axis with respect to the MD in a few seconds. The first iteration gives a set of possible contours, which are automatically refined to give a minimum root mean square error of the difference between the contours, and the angle difference between the major and minor axis of the contour that is nearest to 90º. Using the diffraction pattern images shown in Fig. 4, the results obtained with the described algorithm are shown in Fig. 5. The. best contour found was superimposed on the pattern for display purposes. For the anisotropic paper sample, the computed ellipticity ratio (anisotropy) has a value of 1.55 at 0.0º (top side), while the bottom side reveals an anisotropy of 1.85 at -0.4º. It is clear from these results that there are differences in anisotropy on both sides of the same paper sample. Concerning fibre orientation, one can conclude, as mentioned, that the fibres are aligned more with respect to the major axis of the computed ellipse. Fibre orientation is measured as the misalignment of the major axis of the ellipse with respect to the MD. For the quasi-isotropic paper sample surface (only one side shown), the computed ellipticity ratio has a value of 1.04. The value of the calculated angle for the orientation, 49.0º, is not a relevant parameter to be considered in this particular case. Figure 6 shows the map of a complete scan of a paper surface replica over an area of 78.0 x 78.0 mm. The map displays a segment for each scanned point, where its length is proportional to the anisotropy and its direction determines the local fibre orientation. The header of the map states the scan conditions and the global computed results. All of the results presented have been obtained using the laser beam diameter set to 6.0 mm and the scan steps set to 6.0 mm. Thirty minutes are required to produce such map.. same papers [6,10]. The set of paper sheet samples used includes papers sheets referenced 15, 16, 18–20, which are pilot-plant papers manufactured, at a rate of 80 m/min, by the École Francaise de Papeterie et des Industries Graphiques de Grenoble (EFPG). These paper samples are 100% kraft bleached softwood pulp, beaten to 430 CSF (30ºSR). Samples were sent to various laboratories [6,10] for their measurements of anisotropy and misalignment angle. Replicas of both surfaces of these reference samples have been produced using the described procedure. The replicas cover a total area of 100.0 x 100.0 mm. The experimental apparatus has been set for sequential XY scanning over the predefined area. The laser beam diameter and scan steps were set to 6.0 mm. For each surface replica (two per paper sheet sample), four scans were carried out to evaluate the average ellipticity ratio and the corresponding orientation angle for each scanned point. The total average ellipticity ratio and the orientation angle for the entire sample was also computed. The results obtained are summarized in Table I. Anisotropy measurements (Table II) enable a correlation to be made between them and results from the laser diffraction method. With the results obtained, for both sides of the paper, one can establish a comparison between the values of the ellipticity ratios obtained by diffraction analysis and by image analysis, as shown in Fig. 7. The correlation factor is above 95% for both sides. Most of the results obtained by other authors correspond to a bulk analysis, although for different samples from the same set of papers. To compare them with the results of diffraction analysis, the average value of the measured anisotropy for both surfaces has been computed to represent the anisotropy of the. EXPERIMENTAL RESULTS. Fig. 6. Map of a sequential XY scan. Sampled area – 78 x 78 mm; beam size – 6 mm; mean angle – 0.73°; mean ratio a/b – 1.29; beam step – 6 mm; standard angle – 7.44°; standard ratio a/b – 0.072.. A set of paper samples has been tested with the described experimental optical apparatus to measure the anisotropy and the fibre orientation distribution on both surfaces. With these results, it was possible to establish a comparison with the corresponding results obtained by other authors using different methods, i.e. colorimetric, LIPPKE and TSI, but with the. TABLE I ANISOTROPY (ELLIPTICITY RATIO) AND FIBRE ORIENTATION ANGLE MEASUREMENTS OBTAINED BY DIFFRACTION ANALYSIS FOR THE PAPERS 15, 16, 18–20 OF EFPG Fibre Anisotropy Ellipticity Ratio (a/b). Fibre Orientation Angle, Degrees (with respect to MD). Paper Identification. Top side. Bottom side. Average. 15 16 18 19 20. 1.66 ± 0.07 1.41 ± 0.07 1.74 ± 0.09 1.60 ± 0.11 1.29 ± 0.07. 1.57 ± 0.07 1.53 ± 0.09 1.70 ± 0.07 1.54 ± 0.08 1.35 ± 0.09. 1.62 ± 0.07 1.47 ± 0.08 1.72 ± 0.08 1.57 ± 0.09 1.32 ± 0.08. Top side 0.77 ± 1.92 -0.73 ± 2.95 -1.31 ± 1.94 0.50 ± 2.69 0.73 ± 7.44. Bottom side. Average -0.24 ± 1.88 -1.10 ± 3.10 -1.18 ± 1.74 -5.57 ± 3.59 1.10 ± 6.94. -1.01 ± 1.83 -1.46 ± 3.25 0.13 ± 1.52 6.07 ± 4.31 -1.83 ± 6.40. TABLE II COMPILATION OF ALL THE ANISOTROPY MEASUREMENT RESULTS FOR THE PAPERS 15, 16, 18–20 OF EFPG Method Paper Identification. Colorimetric [10] (Bulk). LIPPKE [10] (Bulk). Top. Bottom. Avg.. Top. Bottom. Avg.. TSI [10] (Bulk). 15 16 18 19 20. 1.71 1.41 1.97 1.42 1.13. 1.82 1.47 2.14 1.80 1.23. 1.69 1.50 1.80 1.59 1.30. 1.66 1.62 1.76 1.56 1.33. 1.68 1.56 1.78 1.58 1.32. 1.66 1.41 1.74 1.60 1.29. 1.57 1.53 1.70 1.54 1.35. 1.62 1.47 1.72 1.57 1.32. 3.69 2.39 4.53 2.81 1.72. 344. Image Analysis [6]. Laser Diffraction. JOURNAL OF PULP AND PAPER SCIENCE: VOL. 28 NO. 10 OCTOBER 2002.
(5) 2.2 (a/b) Colorimetric Analysis. 1.9. (a/b) Image Analysis. 1.8 2. R = 0.96. 1.7 1.6 1.5 1.4 1.3. 1.2. 1.3. 1.4. 1.5. 1.6. 1.7. 1.8. 1.8 R2 = 0.91 1.6 1.4 1.2. (a). (a). 1.2. 2.0. 1.0 1.0. 1.9. 1.2. 1.4. 1.8. 2.0. 2.2. (a/b) Diffraction Analysis. (a/b) Diffraction Analysis 2.2. 1.9. (a/b) LIPPKE Analysis. 1.8. (a/b) Image Analysis. 1.6. R2 = 0.95. 1.7 1.6 1.5 1.4. 2.0 R2 = 0.98 1.8 1.6 1.4. 1.3. (b). (b). 1.2. 1.2 1.2. 1.3. 1.4. 1.5. 1.6. 1.7. 1.8. 1.2. 1.9. 1.4. 1.6. The results for fibre anisotropy and fibre orientation angle are presented in the form of a map. From this map, one can observe and identify local variations in anisotropy and fibre orientation. The proposed method is reproducible and accurate and very sensitive to changes in. 2.2. (a/b) TSI Analysis. 4.5 4.0 3.5 R2 = 0.93. 3.0 2.5 2.0 1.5. (c). 1.0 1.0. CONCLUSIONS One can conclude that replicas give an accurate representation of fibre web surfaces as shown in Figs. 1 and 2. Replicas from both surfaces of the web can be produced simultaneously. Laser diffraction analysis of transparent replicas enables the measurement of anisotropy and fibre orientation angle at the surfaces of fibre webs. The diffraction patterns obtained with the proposed method reveal an elliptical shape, in which the ratio between the length of major and minor axis corresponds to fibre anisotropy, and the angle between the ellipse’s major axis and the MD axis corresponds to fibre orientation angle.. 2.0. 5.0. Fig. 7. Correlation graphs between equivalent anisotropy measurements made by image analysis and diffraction analysis for all reference papers. (a) Top side, (b) bottom side.. whole paper sample. Figure 8 shows the correlation graphs and the correlation factors for the representative average and the corresponding anisotropy measurements for paper samples obtained by the colorimetric, LIPPKE and TSI methods. The correlation factors are high for these comparisons also. For the colorimetric, LIPPKE and TSI methods, all the correlation factors are above 90%.. 1.8. (a/b) Diffraction Analysis. (a/b) Diffraction Analysis. 1.5. 2.0. 2.5. 3.0. 3.5. 4.0. 4.5. 5.0. (a/b) Diffraction Analysis. Fig. 8. Correlation graphs between the representative anisotropy mean and the corresponding anisotropy measurements for all reference papers made by (a) colorimetric analysis, (b) LIPPKE analysis, and (c) TSI analysis.. fibre anisotropy and orientation in a web, making it a good tool for investigating fibre structures such as paper. Very good correlation factors (above 95%) for both surfaces have been found between these results and the results obtained by the image analysis method. For the other methods, one can compare only the average values since their results correspond to bulk measurements on the web. Nevertheless, knowing that the paper is the same, but the samples are not the same, there is a good correlation factor (above 90%) between them. Concerning the TSI method, the correlation factor obtained is. JOURNAL OF PULP AND PAPER SCIENCE: VOL. 28 NO. 10 OCTOBER 2002. good but the dispersion of the results is greater compared with other methods. Moreover, the TSI method always gives anisotropy values above the average [16]. In fact, TSI measurements are influenced by fibre tension and fibre elongation that exists in the web structure during the manufacturing process.. ACKNOWLEDGEMENTS The authors are very grateful to the Remote Sensing Unit at University of Beira Interior. Our work has received financial support from Fundação para a Ciência e a Tecnologia (FCT), Lisbon, Portugal. 345.
(6) REFERENCES 1. 2.. 3. 4.. 5. 6.. 7. 8.. DODSON, C.T.J. and FEKIH, K., “The Effect of Fibre Orientation on Paper Formation”, J. Pulp Paper Sci. 17(6): J203–J206 (1991). DODSON, C.T.J. and SCHAFFNIT, C. , “Flocculation and Orientation Effects on Paper-Formation Statistics”, Tappi J. 75(1):167–171 (1992). KORAN, Z. and PRUD’HOMME, R., “A Study on Orientation and Curl”, Tappi 65(8):88–91 (1982) SILVY, J. and HERVE, P.H., “Formation de la Feuille: Influence de la Floculation de la Longueur et da la Courbure des Fibres sur la Repartition Orientationnelle des Fibres et les Propriétés Physiques des Papiers”, Revue A.T.I.P. 36(6–7):343–357 (1982). DANIELSEN, R. and STEENBERG, B., “Quantitative Determination of Fibre Orientation”, Svensk Papperstidn. 50(13):301–305 (1947). MIGNOT, L., “Effect de l’Orientation Fibreuse au Niveau Microscopique sur les Proprietes du Papier au Niveau Macroscopique: Developpment de Methods de Mesure de l’Orientation Fibreuse par Analyse d’Image”, Diplome de Recherche Technologique, Inst. Nat. Polytechnique de Grenoble, Nippon Paper Industries Ltd., Central Res. Lab. (1998). MERCER, P.G. “On-Line Instrumentation for Wet-End Control”, Appita 41(4):308–312 (1988). LINDBLAD, G., “Ultrasonic Measurement – A Reliable Method for the Quality Control of Pa-. 9. 10.. 11.. 12.. 13.. per” in Paper Testing and Process Optimization, Lorentzen &Wettre Handbook, 13–19 (1999). PRUSAS, Z.C., “Laboratory Study of the Effects of Fibre Orientation on Sheet Anisotropy”, Tappi 46(5):325–330 (1963). DROUIN, B., GAGNON, R., SCHRODER, A., BUTEL, M. and SILVY, J., “L’Orientation des Fibres et les Propriétés Mécaniques du Papier: Méthodes de Contrôle de l’Anisotropy de la Feuille”, Revue A.T.I.P. 49(2):66–72 (1995). SILVY, J., “Etude Structurale des Milieux Fibreux: Cas des Fibres Cellulosiques”, Thése de Doctorat d’Etat, Univ. Scientifique et Medicale et Inst. Nat. Polytechnique de Grenoble (1980). SCHAFFNIT, C., SILVY, J. and DODSON, C.T., “Orientation Density Distributions of Fibres in Paper”, Nordic Pulp Paper Res. J. 7(3):121–125 (1992). JOENSBERG, D.H., KHOLL, A., KLEEP, A. and LANMARK, P, “On Line Quality Control by Production of Kraft Paper”, Proc. 22nd EUCEPA Conf., Florence, Italy:6 (1986).. 14. COSTA, A.P., PEREIRA, M.J., TRINDADE, A.C., FIADEIRO, P.T., SILVY, J. and SERRATOSIO, J.M , “New Method for the Measurement of the Fibres Orientation on the Paper Faces Applied to the Analysis of the Hygro-Instability in Paper Sheets”, Proc. 4th Intl. Symp. – Moisture and Creep Effects on Paper, Board and Containers, J.-M. Serra Tossio and I. Vulierme, Eds., École française de papeterie et des arts graphiques, Grenoble, France, 173–188 (1999). 15. ZUMEREN, M.L., YOUNG, D.J., HABEGER, C.C., BAUM, G.A. and TRELEVEN, R., “Automatic Determination of Ultrasound Velocities in Planar Materials”, Ultrasonics 25:288–294 (1987). 16. HESS, T.R. and BRODEUR, P.M., “Effects of Wet Straining and Drying on Fibre Orientation and Elastic Stifness Orientation”, J. Pulp Paper Sci. 22(2):J160–J164 (1996). 17. WATERHOUSE, J.F., "The Ultrasonic Testing of Paper and Board – Principles and Applications" Tappi J. 77(1):120–126 (1994).. REFERENCE: FIADEIRO, P.T., PEREIRA, M.J.T., JESUS, M.E.P. and SILVY, J.J., The Surface Measurement of Fibre Orientation Anisotropy and Misalignment Angle by Laser Diffraction, Journal of Pulp and Paper Science, 28(10):341–346 October 2002. Paper offered as a contribution to the Journal of Pulp and Paper Science. Not to be reproduced without permission from the Pulp and Paper Technical Association of Canada. Manuscript received July 18, 2001; revised manuscript approved for publication by the Review Panel May 22, 2002. KEYWORDS: FIBER MATS, FIBER DIMENSIONS, QUALITY CONTROL, ANISTROPY, LASERS, DIFFRACTION, MEASURING INSTRUMENTS, PAPER SHEETS, NONWOVENS.. HISTORIC PHOTOS WANTED for the back covers of JPPS Does your company have any historical photographs (from the 1940s or earlier) of interest to the pulp and paper industry which they would like to share with our readers? These photographs should be in landscape format, and we would need to know the following information in order to prepare a caption: where the photo was taken (mill, company, location); the approximate date taken; and the name of the photographer (if known). In addition, we would like to have 2 or 3 short paragraphs of general interest describing, for example, the history of the mill or company, facts about the process shown, differences between the equipment used in the photo and what is used today, etc. This information would be published on the inside back cover of the issue of JPPS. If you have photos which we may use, please send them to Glen Black at PAPTAC, 740 Notre Dame West, Suite 810, Montreal, QC Canada H3C 3X6. We can accept digital images ONLY if they are of high resolution (minimum of 300 dpi). The photo width when scanned should be scanned at least 6 1/2 inches. Please do not send these large files by e-mail; they should be submitted on a Zip disk or CD. All photos and disks will be returned.. 346. JOURNAL OF PULP AND PAPER SCIENCE: VOL. 28 NO. 10 OCTOBER 2002.
(7)
Imagem

Documentos relacionados