MASTER OF SCIENCE IN
FINANCE
MASTER FINAL WORK
PROJECT
CAR
RENTING
–
R
ISK
M
ITIGATION AT THE END OF THE
CONTRACT
AUTHOR
MARTA MARINA DOS SANTOS DELGADO SUPERVISOR
MARIA TERESA MEDEIROS GARCIA
iii ACKNOWLEDGEMENTS
I would like to thank Professora Maria Teresa Medeiros Garcia for addressing this challenge and for supporting me in this final master work.
I am also deeply grateful to the financial department from the company that I’m working for which allows me to use real historical data on my project.
And last but not least, I would like to thanks everyone who has contributed to this FMW with different opinions and interesting point of views.
v INDEX
ABSTRACT ... vii
INDEX OF FIGURES ... viii
INDEX OF TABLES ...ix
GLOSSARY ...x
INTRODUCTION ... 1
1. FRAMEWORK AND CONCEPTS... 3
1.1 RENTING ... 3 1.2 INSURANCE COVER ... 5 1.3 FINANCIAL INVESTMENTS ... 7 1.3.1 STOCKS ... 7 1.3.2 BONDS... 8 1.3.3 FIXED-TERM DEPOSITS... 9 1.3.4 SHARES/UNITS ... 9 2. METHODOLOGY ... 12
2.1 TARIFF – UWT COVER ... 12
2.2 FINANCIAL INVESTMENTS... 14
3. RESULTS ... 17
4. CONCLUSION ... 19
REFERENCES... 21
APPENDIX A – UWT Cover Details ... 23
APPENDIX B – APS Non-Life Portfolio Structure ... 24
APPENDIX C – Stock Prices... 25
APPENDIX D – Funds performance ... 26
vii ABSTRACT
Renting is a solution regarding the purchase of an entire fleet. Nowadays it is known as a flexible option which allows cost reductions, rationalization plans and passing of associated risks facing the car value – depreciation and used car sales. The car renting offers a lot of services as: maintenance, insurance, fuel card, road side assistance and replacement car, claim handling and administrative services, taxes, tyres and so on.
However, in the end of the contract the customers are sometimes surprised with extra costs from damages not included on vehicle normal usage. On the other point of view, the renting companies also lose on the sales results. Thus, it is crucial finding a balance for the two involved parties – the customer and the renting company.
The aim of the present master final work is to develop a solution which helps to minimize and to manage the inherent risks of a renting contract, particularly in the end of the contract. Based on historical data we’ll present an insurance cover that can protect the customers from the “big costs” and also allows renting companies to improve the results not even by a profitability cover but also combined with different financial investments.
viii INDEX OF FIGURES
ix INDEX OF TABLES
Table 1 – Historical costs data from ending contracts between 2013 and 2015 ... 13
Table 2 – Portfolio structure... 14
Table 3 – Stock portfolio ... 15
Table 4 – Bonds portfolio... 15
Table 5 – Units portfolio ... 16
Table 6 – Fixed-term deposit portfolio ... 16
Table 7 – Tariff and fleet details ... 17
Table 8 – Invested amounts per year ... 18
x GLOSSARY
ALF – Associação Portuguesa de Leasing, Factoring e Renting.
APS – Associação Portuguesa de Seguradores. CAPM – Capital Asset Pricing Model.
FINANCIAL PORTFOLIO – refers to any combination of financial instruments as stocks and bonds, deposits, funds and so on.
INSURANCE COMPANY – significant participant in a business. A certain business has many participants that perform it between each other.
INSURANCE POLICY – a contract between the insurer and the insured which determines all the conditions and specially the claims that insurer has the responsibility to pay.
LOSS RATIO – is a ratio of losses and gains in a financial context.
MATURITY – is the final payment date of a financial instrument.
NAV – Net asset value, corresponds to a fund price per share.
RENTING - is an agreement in which the customer pays for a temporary use of a good, service or property owned by a company.
TARIFF – is the table premiums or the rate to be applied to risks in order to guarantee the policy conditions subscribed.
1 INTRODUCTION
In Portugal, a lot of companies already found that they have more advantages on doing car renting contracts besides of buying an entire fleet, and already represents 15,6% of European Renting Market1. Renting is a flexible option which allows cost reductions, rationalization plans and passing of associated risks facing the car value – depreciation and used car sales. However, in the end of the contract the customers are sometimes surprised with extra costs from damages not included on vehicle normal usage. From the rental company side, we cannot say that they have extra costs but obviously they lose money on car sales.
Assuming that the car renting company has an in-house insurance company, the main purpose of this work is to build a tariff adjusted to the real costs that renting customers on average used to pay in the end of each contract. With this cover – Unfear Wear and Tear (UWT) – we can present a solution that minimizes the risk exposure of each customer (regarding the costs in the end of the renting contract) and also manage the risk on sales results.
On the insurance industry the customer pays the premium in the beginning of the contract2 in order to guarantee all the damages caused by a claim that could or could not occurred. Therefore, it’s very important to not compromise the company’s solvability and to assure that it’s also able to assume the responsibilities with their customers. In UWT cover we know exactly when the claim can occurred – in the end of
1
http://www.alf.pt/pt/renting#4 2
2 the renting contract – and so the insurance company together with the renting company can use the earned premiums to do different investments in order to improve the cover profitability.
On an overall framework point of view, we will present on the first chapter the renting activity, the main concepts to build an insurance tariff and some of the financial investments that a company can do to improve their results. After the literature review, on the second chapter we will describe the methodology used during this MFW and, on the third chapter, we will present the results obtained.
In the end, on chapter four, we will summarize the main conclusions and finally we will present the sources and the books that had supported this work. Although they not always appear as a reference, a great number of websites, papers and master theses supported this study and they have been all listed on References chapter.
3 1. FRAMEWORK AND CONCEPTS
1.1 RENTING
Renting is known as an agreement in which the customer pays for a temporary use of a good, services or property owned by a company. According to Barroso [2008], renting is a financial agreement in which one of the parts (renting company) is obliged, in accordance with a receipt of a periodical income, to give to the other part (customer) a temporary use of a good with one or more services included. After the contractual period, the costumer can return the good or negotiate the purchase of it. During this work we will focus only on car renting.
The car renting companies offer to their customers a lot of services as: maintenance, insurance, fuel card, road side assistance and replacement car, claim handling and administrative services, taxes, tyres and so on. This combined service had become a solution for the most of big companies on a financial view because on reaching a renting fleet they don’t need to allocate their own funds on buying cars. Also the small companies and even private individuals started to look for renting as a solution and an opportunity to have a car and other services included in one simple rent.
The figure 1 shows the evolution of car renting in Portugal, split by passengers’ vehicles and commercial ones (vans). It’s clear the crisis effects especially on 2012 year but we can also see that during 2015 the tendency changes and the car renting start to gain again straight on the market.
4 Figure 1 – Car Renting Evolution in Portugal (Source: ALF)
Nowadays, renting is an important channel for car business. Even the main car brands as, for example, Renault, Opel, BMW and Mercedes-Benz started to complement their core business with renting solutions for their customers.
Usually the customer material the final value of a rent but with the time they had been learning to enhance the services included on a renting offer and not only the maintenance and tyres as in the beginning. This means that the market has the opportunity to grow according with customer needs.
The main advantages of a car renting contract could be presented as:
companies don’t need to allocate their own funds on buying cars; having a car with other services included in one simple rent;
5 However, the principal disadvantage is related to the costs in the end of the contract. Please consult the UWT manual from ALF3 to better understand all the damages that are not acceptable in the end of a renting contract.
The weakness of a renting contract can now be the strength of a business solution. An insurance cover that protects high costs from damages not included on vehicle normal usage in the end of a renting contract is definitely a need.
1.2 INSURANCE COVER
According with Centeno [2003] in the insurance activity the insured pays in the beginning of a contract an establish premium in order to get protected from a possible event in the future. On the other hand, the insurance company assumes the risk and will be responsible for the payment of a claim until the limits stated in the insurance policy. The premium includes taxes, management costs and of course the risk for covers the indemnities.
The calculation of a premium that should be enough to face the future costs and reasonable for the insured to pay it is not an easy task. In accordance with Santos [2008], there are some relevant concepts that should be present to better support the methodology used on this MFW:
Claim – is an event or a range of it ensuing from one same cause that could drive the covers provided by the contract (insurance policy);
3
6 Insurance Premium – is the amount that the insured pays in order to transfer to the insurance company the responsibility of paying the damages caused by an occurred claim under the insurance policy (contract);
Frequency – is the incidence of claims based on the risk exposure from a certain period of time:
Unit at risk – is the units, cars in this specific case, that are exposure at risk during a certain period of time (normally 365 days);
Severity – is known as the claim average cost:
Pure Premium – is the amount that an insurance company should charge to the insured (is the average loss per unit at risk):
Risk Premium – is the pure premium plus a margin that must be sufficient to cover the administrative costs and some adverse development on claim costs.
There are a lot of methodology’s to build an insurance tariff but on this MFW we will base our calculations on a risk premium approach using the known historical costs and the incidence of claims from a dummy renting company.
7 1.3 FINANCIAL INVESTMENTS
To improve the financial results each company should diversify and optimize their investment portfolio according to their risk profile. We’ll present on this MFW a few options based on different risk appetite and composed by the following financial instruments (see, for example, Bodie, Kane and Marcus [2009]).
1.3.1 STOCKS
In the world of finance and business it’s usual to define a stock as a representative part of a company capital. All the stocks available in the main stock indices entitle investors not only to dividend payments, but also to exercise control over management through the voting process. They are typically grouped as:
Ordinary Stocks – are the most common stocks and give to the shareholder the right to receive a proportion of the company profit or a part of it in liquidation case. Shareholder can also be represented at the general shareholders meeting and have the voting rights on social agreements. This type of stocks are listed on the stock exchange;
Preferred Stocks – the holders of this kind of shares are the first to receive the profit which means that they have priority over ordinary stocks;
Voting and nonvoting Stocks – shareholders can be or not represented at the general shareholders meeting;
Golden Shares – they have special privileges for their holders through state holding in national interest companies.
8 The main advantages of investing in stocks are that most of them are liquid, the shareholder receives dividends periodically and as this is an investment with a variable-rate the profit also tends to be higher. However, the risk of losing all the investment is also high. Due to the instability of the financial market buy and/or sell stocks can be a hard task. The price of a stock is very volatile.
1.3.2 BONDS
These financial tools are more conservative than stocks and they also have more advantages for the investor as:
Security – in an insolvency case the bonds investors are the first to be refund while shareholders will only receive partially or totally the return if the capital exceeds;
Expected return – bonds are presented as fixed-income securities where the coupons and the return of the investment are well-established at the time of the purchase.
Regarding Brito [2011], which we urge you to carefully read the chapter 2, the bonds have several characteristics which differentiate them from the others financial tools among which the Nominal Value, Coupon Rate, Rating, Yield, Duration and Convexity. Besides all the advantages already presented, it should be noted that bonds have also some risks associated as for example the market risk, the credit risk, the reinvestment risk, the inflation risk and the liquidity risk.
9 In a general way, we can group the bond issuers into three different groups: government, corporate and supranational institutions. The market where the bonds used to be trade is divided into primary and secondary market. The first one is where the issuer issues the bond and the other one is where all the other transactions following the first market are made (buy and sell orders).
1.3.3 FIXED-TERM DEPOSITS
The fixed-term deposits are the most safety way to invest money but, on the other hand, they are also the less profitability as at the time the interest rates are very low. We can find in the market a lot of solutions from different banks and with different characteristics so it’s possible to choose a deposit perfectly fitted to an investor profile.
A deposit is a very clear instrument as the investor knows since the beginning the term of the contract, the interest rate, the taxes charged and that his not allowed to transfer the capital invested during the agreed period in consequence of losing interest payments.
1.3.4 SHARES/UNITS
An investment fund is known as property which belongs to several people for investment in certain assets and managed by experts. Each fund is segmented with the same characteristics and without nominal value called “units” or “shares”.
The property of a fund may be invested in stocks and bonds , normally denoted by Mutual Funds, or in property (real estate), called Real Estate Investment Funds.
10 This financial tool appears as an alternative to direct investment and allows property diversification, risk mitigation and transaction costs reduction. Nevertheless, each fund has it’s owns risks and characteristics.
12 2. METHODOLOGY
Besides of being an alternative solution of buying a car, the renting has also some risks in their activity. In the end of the contract the customers are sometimes surprised with extra costs from damages not included on vehicle normal usage as for example: damages inside the vehicle, on windscreen, viewpoint, headlights and tail lights, etc. On the other hand, if the customers return the car with damages, the renting companies lose money on the sales results.
The purpose of the present MFW is to develop a solution which helps to minimize and to manage the inherent risks of a renting contract, particularly in the end of the contract.
On a compliance point of view the company name will never be presented not even the real figures. We used a factor in all the values in order to guarantee the confidentiality of the information.
2.1 TARIFF – UWT COVER
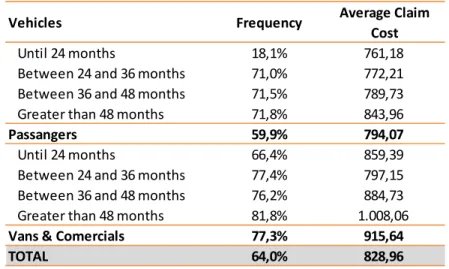
Using historical data since 2013 until 2015 from a car renting company with a big quote on Portuguese market, we build a tariff adjusted to the customers’ needs. We started by organizing all the information and to find out the most relevant variables, which are the renting contract duration and the vehicle type: passengers or commercials. We assumed that by definition this particular cover has a limit - insurance capital fixed on 1.500€. When we looked at the historical costs and assuming that the behavior of the drivers may suffer a few changes when they start to subscribe
13
Vehicles Frequency Average Claim Cost
Until 24 months 18,1% 761,18
Between 24 and 36 months 71,0% 772,21
Between 36 and 48 months 71,5% 789,73
Greater than 48 months 71,8% 843,96
Passangers 59,9% 794,07
Until 24 months 66,4% 859,39
Between 24 and 36 months 77,4% 797,15
Between 36 and 48 months 76,2% 884,73
Greater than 48 months 81,8% 1.008,06
Vans & Comercials 77,3% 915,64
TOTAL 64,0% 828,96
the UWT, we believe that this amount is sufficient to cover, on average, the damages of the vehicles. It’s important to say that the damages under this cover are not related with electronic problems. We presented on appendix A the cover details.
Table 1 – Historical costs data from ending contracts between 2013 and 2015
From an universe over 33.600 terminated cars, we present, on table 1, the average costs and the claims4 frequency, by vehicle type and contract duration. Based on this information, we calculated the risk premium, as described on the previous section, with the following assumptions:
o Taxes under UWT cover – 11,71% o Target Loss Ratio (before margin) – 85% o Margin – 20%
o Insurance Capital (limit of the cover) – 1.500€
In order to guarantee that the insurance company is able to assure their responsibilities, in this exercise we only used 50% of the earned premiums to build the investments portfolio.
4
14
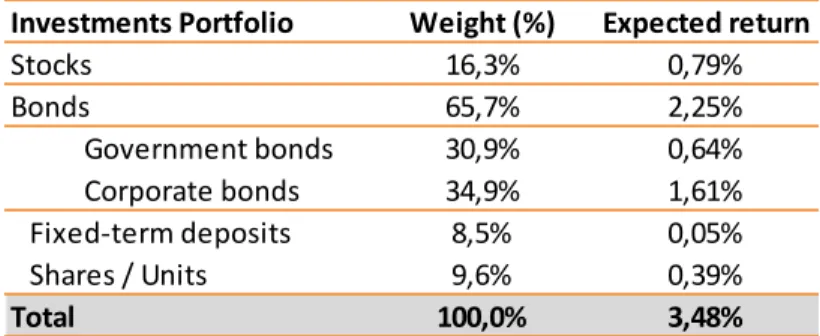
Investments Portfolio Weight (%) Expected return
Stocks 16,3% 0,79% Bonds 65,7% 2,25% Government bonds 30,9% 0,64% Corporate bonds 34,9% 1,61% Fixed-term deposits 8,5% 0,05% Shares / Units 9,6% 0,39% Total 100,0% 3,48% 2.2 FINANCIAL INVESTMENTS
Based on the 2015 non-life insurance structure portfolio from APS (see appendix B for more details), we decided to not invest in property as this asset class has, by nature, low liquidity and, due to his low representation in the insurance market, we decided also to not invest in derivatives and structured products. The table 2 shows the investment portfolio chosen for improving the UWT cover.
Table 2 – Portfolio structure
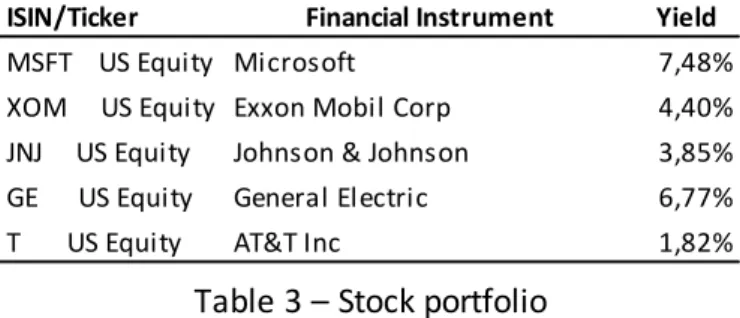
For the five stocks portfolio, presented on table 3, we based our choice on the TOP 10 of MSCI World index. Considering their performance from 2004 to 2015, we decided to invest in those that have an expected average gross return, according with the MSCI Index Performance5, which, at the time, is equal to 11,08%. Appendix C gives detailed information about stock’s performance. However, for the price forecast we use the CAPM equilibrium model (1) to obtain the stock expected return. Please read French [2003] to better understand the Treynor Model.
( ) ( ( ) ) (1) Where:
5
15
ISIN/Ticker Financial Instrument Yield
PTOTEYOE0007 PGB 3,85 15-04-2021 2,06% PTMENROM0004 Mota Engil 3,9% 03/02/2020 5,87% PTCGGROM0011 Caixa Geral 5,32% 05/08/2021 5,85% XS0260137715 BPI 2,5% 13/07/2021 3,27% PTPTIUOE0006 Navigator 1,575 26/04/2021 3,54%
ISIN/Ticker Financial Instrument Yield
MSFT US Equity Microsoft 7,48% XOM US Equity Exxon Mobil Corp 4,40% JNJ US Equity Johnson & Johnson 3,85% GE US Equity General Electric 6,77% T US Equity AT&T Inc 1,82%
– is the risk-free rate of interest.
– is the sensitivity of the expected excess asset returns to the expected excess market returns.
( ( ) ) – is known as the risk premium. In this MFW we used the Damodaran6 approach who says that the risk premium is equal to 5,5%.
Table 3 – Stock portfolio
Regarding the bonds, as mentioned above, we decided to invest in government and corporate bonds as listed on table 4. The appendix D contains the graphics with their performances.
Table 4 – Bonds portfolio
Concerning the unit funds we tried to find one of each type: a stock fund, a bond fund, a mixed one and a property fund with at least 5 years of historic share prices. On table 5 we present the selected ones and their corresponding profitability. Once again, for the three Allianz funds we obtained the expected return based on CAPM and for the
6
16
ISIN/Ticker Financial Instrument Yield
-- DP BIG 5A 0,6% 0,60%
ISIN/Ticker Financial Instrument Yield
LU0398560267 Allianz Strategy 15 CT EUR Acc 4,79% LU0352312184 Allianz Strategy 50 CT EUR Acc 5,39% LU0352312853 Allianz Strategy 75 CT EUR Acc 4,24% DE0009807057 grundbesitz global RC 2,26%
other, as it doesn’t have the beta information, we assume for the future an expected return based on historical average.
Table 5 – Units portfolio
Finally, as to the fixed-term deposit concerns we only choose one option (5 years’ time deposit) as shown on table 6 because at the time we know that the interests earned on deposits are very low.
17
Vehicles Total Premium
per car Average Fleet Frequency Average Claim Cost % Penetration Average fleet with UWT Contract Duration on Average Until 24 months 237,29 11.199 18,1% 761,18 5,0% 563 14,07
Between 24 and 36 months 944,83 8.598 71,0% 772,21 10,9% 938 35,20 Between 36 and 48 months 973,13 24.155 71,5% 789,73 42,5% 10.271 47,15 Greater than 48 months 1.044,49 7.676 71,8% 843,96 1,3% 100 60,89
Passengers 819,41 51.627 59,9% 794,07 23,0% 11.872 40,02
Until 24 months 983,67 1.775 66,4% 859,39 2,5% 45 18,27
Between 24 and 36 months 1.062,61 2.619 77,4% 797,15 12,9% 337 35,05 Between 36 and 48 months 1.160,77 5.832 76,2% 884,73 26,3% 1.532 47,17 Greater than 48 months 1.420,29 5.871 81,8% 1.008,06 1,2% 72 64,52
Vans & Commercials 1.219,93 16.097 77,3% 915,64 12,3% 1.986 48,34
TOTAL 914,60 67.724 64,0% 828,96 20,5% 13.858 42,00
3. RESULTS
Considering the methodology stated on the previous chapter and based on historical costs we calculated the total risk premium for the UWT cover per car. Afterwards, assuming a closed fleet with different characteristics as presented on table 7, we started to work on our investment portfolio. 72,8% of our fleet is made up of passengers vehicles with a contract duration, on average, equal to 40,2 months. On the other hand, the commercial vehicles represents 27,2% of the fleet but with a greater contract duration, over 48,34 months.
Analyzing the following table we see that the average cost per claim increases with the contract duration in the two vehicle types.
Table 7 – Tariff and fleet details
For the investment exercise we assumed that all the fleet started at 1st January, there’s no new fleet during the period analyzed, there’s no early terminations effect which means that each car still on road during the time hired and once the customer subscribe the UWT cover he will not took it off.
18
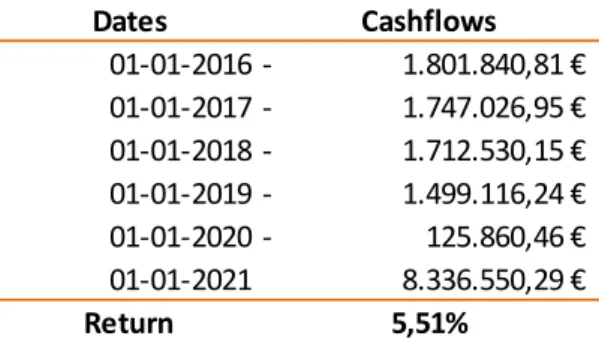
1st Year 2nd Year 3 rd Year 4th Year 5th Year 50% of earned premiums 1.801.840,81 € 1.747.026,95 € 1.712.530,15 € 1.499.116,24 € 125.860,46 € Dates Cashflows 01-01-2016- 1.801.840,81 € 01-01-2017- 1.747.026,95 € 01-01-2018- 1.712.530,15 € 01-01-2019- 1.499.116,24 € 01-01-2020- 125.860,46 € 01-01-2021 8.336.550,29 € Return 5,51%
According with the different contract durations, we can diversify our portfolio with the maturity of investments. Once we decided to use 50% of the earned premiums and by definition we know that the insured pays in the beginning of each year the premium as agreed on insurance policy, we invested the amounts presented on table 8 per year.
Table 8 – Invested amounts per year
On the appendix E we have all the assumptions (quantities, prices7 and expected returns) of our portfolio. With the financial tools chosen for this portfolio we obtained a total amount, in 2021, of 8.336.550€ which represents a 5,5% return, as detailed on table 9.
Table 9 – Annual cash flows
7
19 4. CONCLUSION
The car renting had become a solution for the companies and even for the private individuals that need a car with all the services related with in one simple rent. However, as normally happen with all the activities, the renting has some risks particularly in the end of the contract when the customers are sometimes surprised with extra costs from damages not included on vehicle normal usage. On the other hand, if the customers return a car with damages, the renting companies lose money on the sales results.
In this MFW we develop an insurance cover which helps to protect the customer from the big costs in the end of the contract. We also studied a different way of improving the cover profit result by diversifying an investment portfolio according with the risk appetite of a company.
As we presented on the methodology and results chapters, an insurance cover is a safety way to protect the customers that used to do car renting without spending too much money. It’s possible to develop different capital options for the UWT cover in order to better fit each customer behavior. In this MFW, the main idea is to show a solution for the weakness of a renting contract and that’s why we only build a unique capital option (1.500€).
Regarding the investment portfolio, it’s up to each rental company to decide which is the percentage of earned premiums they want to invest and how much risk they are willing to take. Here we only present an example of a profitable portfolio. The most
20 important thing is to not compromise the solvability of the company and assure that at any time the company is able to assume their responsibilities, which mean to pay the claim costs.
It’s a cliché but totally truth: the more diversified the portfolio the smaller will be relative variability about the expected return.
21 REFERENCES
Barroso, Maria de Nazaré; Couto, Eduardo; Crespo, Nuno, (2008), “Cálculo e Instrumentos Financeiros – Da prática para a teoria”; Escolar Editora;
Bodie, Z., Kane, A. and A. Marcus, (2009), Investments, 8th edition, Edition, Mc-Graw HILL/Irwin.
Brito, Ana Alexandra Subtil, (2011), “Implementação do Modelo de Credit VAR aplicado a uma carteira de crédito”, Dissertação – Faculdade de Ciências e Tecnologia – UNL;
Centeno, Maria de Lourdes, (2003), “Teoria do Risco na Actividade Seguradora”, Celta Editora;
French, Craig W. (2003), "The Treynor Capital Asset Pricing Model", Journal of Investment Management;
Santos, Susete, (2008), “Construção de Uma Tarifa de Responsabilidade Civil Automóvel”, Dissertação – Faculdade de Ciências e Tecnologia – UNL;
APS, (2016), “Resumo – Investimentos do Sector Segurador”;
http://www.alf.pt/index2.html
http://www.jornaldenegocios.pt/arquivo/renting/detalhe/o_que_eacute_o_renting.ht ml
http://www.economias.pt/renting-automovel/ https://en.wikipedia.org/wiki/Renting
22 https://bancos.pt/vantagens-e-desvantagens-de-comprar-acoes/ https://www.economias.pt/tipos-de-acoes/ http://www.investirnabolsa.pt/tipos-de-acoes/ https://bancos.pt/vantagens-desvantagens-depositos-prazo/ http://www.cmvm.pt/pt/EstatisticasEstudosEPublicacoes/GuiaDoInvestidor/ https://en.wikipedia.org http://www.finanzen.net/fonds/ http://www.morningstar.es/es/funds/snapshot/ https://en.wikipedia.org/wiki/MSCI_World#cite_note-3 http://pages.stern.nyu.edu/~adamodar/
23 APPENDIX A – UWT Cover Details
The UWT was designed to protect the renting customers of extra costs in the end of their contract and covers all the damages as follows.
Damages covered8:
Damages inside the vehicle;
Small damages on the vehicle exterior (not acceptable as an own damage); Tyres wear;
Wheel rims;
Damages on windscreen, viewpoint, headlights and tail lights.
Advantages:
Stop with the high costs in the end of a renting contract; Has no deductible (only the capital limit);
The total premium paid is lower than the insurance capital; All the damages under the policy are very clear.
8
24 APPENDIX B – APS Non-Life Portfolio Structure
Historical Non-life insurance structure portfolio from APS:
Regarding the 2015 non-life insurance structure portfolio from APS we decided to not invest in property as they have by nature low liquidity and due to his low representation in the insurance market we decided also to not invest in derivatives and structured products.
25 APPENDIX C – Stock Prices
26 APPENDIX D – Funds performance
28 APPENDIX E – Investment Portfolio