Instruments of sustainable management: the Balanced Scorecard in the
best companies where to work in Portugal
MARIA JOÃO CARDOSO VIEIRA MACHADO
Assistant Professor of Accounting Department
Instituto Universitário de Lisboa (ISCTE-IUL), Business Research Unit (BRU-IUL)
Avenida das Forças Armadas
1649-026 Lisboa
PORTUGAL
maria.joao.machado@iscte.pt
PATRÍCIA DA SILVA SIMPLÍCIO
Master in Accounting
Corporate Support of Banco Caixa Geral (BCG) – Spain
in Caixa Geral de Depósitos (CGD)
Avenida João XXI, 63
1000-300 Lisboa
PORTUGAL
patricia.silva.simplicio@cgd.pt
Abstract: This study aims to contribute to the knowledge regarding the use of performance evaluation systems that enable the implementation of the sustainable management concept. As specific objectives we have identified the following: to analyse whether the companies rated as the best where to work use a performance evaluation system that allows sustainable management; to analyse whether there is a link between the systems used, and the characteristics of the companies and of person in charge of the system. The data collection method used was the conduction of a survey to those in charge of performance evaluation of the top 100 companies where to work in Portugal. We obtained 30 valid replies. The results showed the following: the companies classified as the best where to work in Portugal have a utilization rate of performance evaluation systems that enhance sustainable management higher than that of other Portuguese companies; the districts where the majority of the companies uses systems theoretically associated with sustainable management are situated only in the north of Portugal; those in charge with a degree in engineering are the ones who use proportionately more the systems that reinforce sustainable management.
Key-words: sustainable management; performance evaluation; best companies where to work; Portugal.
1 Introduction
The concept of sustainable management and its importance for the success of the organizations is one of the latest concerns for researchers [1] [2] [3].
Some researchers suggest that one of the management tools that can be used to integrate the concept of sustainable management in the companies is the performance evaluation system in general [1], and the Balanced Scorecard in particular [2] [3] [4] [5].
Current studies on performance evaluation systems have also integrated an analysis of the link between the system used and the characteristics of the financial manager [6] and of the companies themselves [7] [8] [9].
The general aim of this study is to contribute to the knowledge about the use of performance assessment systems that enable the implementation of a sustainable management concept. As specific objectives we can identify the following: to analyse whether the companies rated as the best where to work use a performance evaluation system that allows sustainable management; to analyse whether there is a link between the systems used, and the characteristics of the companies and of the person in charge of the system.
The analysed universe consists of the 100 companies ranked in 2014 as the best where to work in Portugal. Data were collected through surveys
directed to the person in charge of the performance evaluation system. We obtained 30 valid replies.
2 Theoretical framework
The theoretical foundations of sustainable management are consensual to several authors [1] [2] [3] who regard the organization's responsibility as essential on three levels: economic, social and environmental. Reefke and Trocchi [3] consider that sustainable management requires the ability to use the organization's resources for the benefit of society, and not only for its own benefit. However, this concept remains abstract for many companies, which hinders its practical application [3]. Sustainable management is still superficial in the companies, something not translated into effective management measures due to a lack of knowledge about how to operationalize and integrate this concept into management tools [2] [5].
The use of a suitable performance evaluation system (PES) is one of the pillars of sustainable management, namely because it is essential to ensure effectiveness and efficiency in decision-making [3]. Reefke and Trocchi [3] consider that sustainable management exists when the organization manages, simultaneously, to meet the present needs of all its stakeholders without compromising the satisfaction of their future needs. This perspective is very similar to that presented by Kaplan and Norton [10] regarding the Balanced Scorecard (BSC), namely its ability to measure simultaneously the short, medium and long-term goals.
Traditionally, the performance evaluation of an organization was based solely on financial measures [10] [11] [12]. The main objective was to allow operational control and provide short-term financial reports [13]. Several authors argue that financial measures lead to an exclusive concern with short-term financial results, forgetting strategy and long-term performance [14] [15] [16], not reflecting the need for organizations to be oriented towards the learning process focused on the customer [13].
With the evolution of the business environment it has become fundamental to also start using non-financial measures that can measure the intangible assets crucial in the organization's success in the medium and long term [11]. The organizations now have the need to supplement the financial measures with non-financial measures, using a system composed of both, and designated in this study as composite measures. The unstructured composite measures result from a combination of financial and
non-financial measures, although not organized in a specific system or structure. However, the composite measures can be organized and structured in a theoretically developed PES, following the specific rules of that methodology. These systems, developed with theoretical support, are designated in this study as structured composite measures. Over the years, several performance evaluation systems based on structured composite measures were developed, such as the Tableau de Bord (TB), and the BSC, the most analysed in scientific studies [12] [17] [18].
The TB is a PES, developed by French engineers long before the BSC, in 1932, with the objective to understand how management actions influence the performance of the production processes [17] [18]. Seen as a dashboard by many managers, the TB requires that each organizational unit identifies and clarifies its goals and critical success factors [14]. Based not only on financial measures, the TB includes operational measures that provide better information for managers regarding actions and decisions in every area of the company [18] [19].
In the 1990s a growing concern started towards ensuring consistency between actions and strategic objectives [20]. Following the growing importance of using non-financial measures, and of performance evaluation systems linked to strategy, there was the need of creating a PES that would combine all these factors [10] [15]. After a long research project involving 12 companies [10] developed the BSC concept, as a management tool that provides managers with a global, integrated and comprehensive vision of the organizational performance.
The BSC was originally defined as a performance assessment tool that combines strategy and objectives, complementing the traditional financial measures with non-financial ones related to customer satisfaction, internal processes, innovation, and the continuous improvement of processes and activities [10]. The objectives and their respective measures are grouped into four perspectives: financial, customer; internal processes; learning and growth.
In 1996, the BSC starts to be seen and also used as a strategic management system, having suffered some changes in this direction over the years [11] [21] [22] [23] [24] [25] [26] [27] [28] [29]. The alignment of measures and goals with the organization's strategy is crucial for the success of the defined strategy. However, the implementation of a mere set of measures is not enough, it is necessary that the measures defined for each
perspective are inter-related in a chain of cause-effect relationships [11] [21]. The idea of causal relationships between the BSC objectives and each perspective measurements led to the need to create a strategic map, which should group all the established relationships, and illustrate in clear and simple language, the direction the organization must follow to meet the strategy and the defined goals [23] [25].
Based on the experience of organizations that have achieved performance and the desired success with the BSC, Kaplan and Norton [26] developed a management model called Strategy-Focused Organization, based on five principles: to translate
strategy into operational actions; to align the entire organization with the strategy; to transform strategy into each employee’s daily work; to make strategy a continuous process; to mobilize management for change.
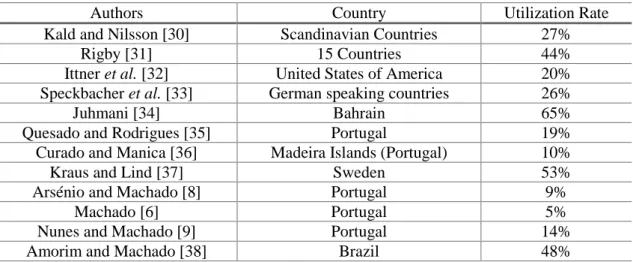
Given the relevance and the diversity of the theme, the BSC has been studied in recent years in several countries by various authors [6] [30] [31] [32] [33] [34] [35] [36] [37] [8] [9] [38]. The BSC utilization rates, taken from several studies, are presented in Table 1, and it is reported that only in two countries the majority of the companies surveyed uses the BSC (Bahrain and Sweden).
Table 1 – BSC utilization rates
Authors Country Utilization Rate
Kald and Nilsson [30] Scandinavian Countries 27%
Rigby [31] 15 Countries 44%
Ittner et al. [32] United States of America 20% Speckbacher et al. [33] German speaking countries 26%
Juhmani [34] Bahrain 65%
Quesado and Rodrigues [35] Portugal 19%
Curado and Manica [36] Madeira Islands (Portugal) 10%
Kraus and Lind [37] Sweden 53%
Arsénio and Machado [8] Portugal 9%
Machado [6] Portugal 5%
Nunes and Machado [9] Portugal 14%
Amorim and Machado [38] Brazil 48%
Juhmani [34] surveyed 83 large companies in Bahrain, where 65% of them use the BSC. Kraus and Lind [37] conducted interviews in 15 major Swedish companies, and concluded that 53% of them use the BSC.
The studies of Rigby [31], and Amorim and Machado [38] present BSC utilization rates close to 50% (44% and 48%, respectively). The first study focuses on companies from 15 countries in three continents: Europe, Asia, and America. The study of Amorim and Machado [38] focuses on 150 Brazilian companies considered as the best where to work.
The study of Kald and Nilsson [30], in 238 companies from Scandinavian countries, reports a BSC utilization rate of 27%. Speckbacher et al. [33] present a similar utilization rate (26%) in German speaking countries. Also Ittner et al. [32] present a BSC utilization rate of around 20% in a study of 140 American financial services companies.
Regarding Portugal, existing studies show very diverse utilization rates. Curado and Manica [36] studied the largest companies in the Madeira
Islands, where the BSC utilization rate was around 10%. With a very similar utilization rate (9%) [8] inquired companies listed on the Portuguese stock market. Quesado and Rodrigues [35] inquired the largest Portuguese companies, finding a 19% utilization rate. The same rate was found in 4 and 5 star hotels in Portugal [9]. The lowest utilization rate (5%) was found in Portugal by [6] in small and medium industrial companies.
3 Research method
Considering the reviewed literature, the specific objectives of this study are: to analyse whether the companies classified as the best where to work use a PES that allows sustainable management; to analyse whether there is a link between the systems used, and the characteristics of the companies and of the person in charge of the system. According to the objectives defined, we adopted the positivist research paradigm, as this methodology allows us to perform a quantitative description of reality, in order to validate the
research questions defined (Chua, 1986). To achieve the proposed objectives were have formulated three research questions:
Research question 1 – The companies use a PES that allows sustainable management?
Research Question 2 – Is there a link between the system used and the characteristics of the companies?
Research Question 3 – Is there a link between the system used and the characteristics of the person in charge?
The analysed universe is composed of companies classified as the best where to work in Portugal, selected by the magazine Exam in 2014, in a partnership with the consulting company Accenture, totalling 100 companies. Given the geographical dispersion of the universe under analysis, surveys were the information gathering method considered more suited to achieve the intended goals. Online surveys directed to the person in charge of the performance evaluation system were conducted. Since it was not possible to contact seven companies, a corrected universe of 93 companies is considered. To obtain a higher response rate, we performed three mailings, and received 30 valid replies, which is translated in a response rate of 32.26%. This response rate is comparable to those of previous studies [30] [32] [35] [36] [38] [8].
4 Results and discussion
4.1 Performance evaluation system
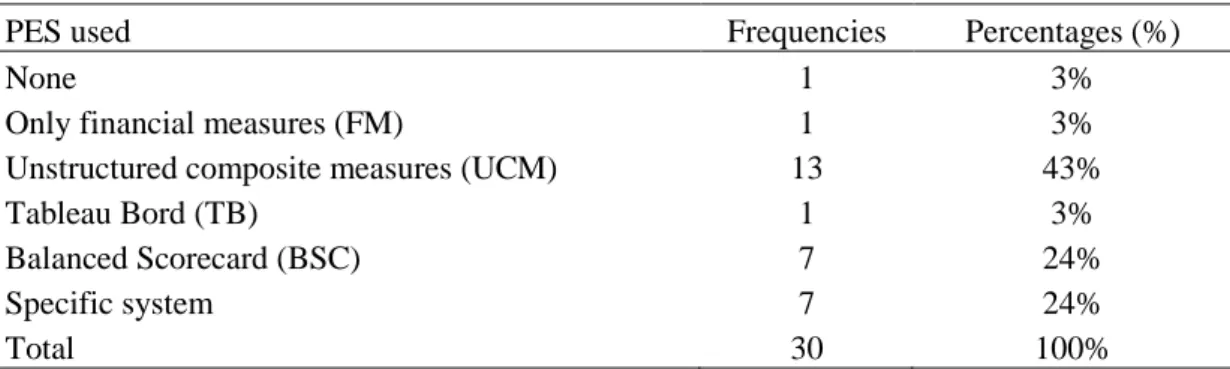
To answer the first research question we defined the variable PES used, regarding which six response categories were identified: none, for the companies that have declared not using any system; only financial measures (FM); unstructured composite measures (UCM), for the companies that use both financial and non-financial dispersed measures, not structured within a model; Tableau de Bord; Balanced Scorecard; specific system, for the companies that use systems with financial and non-financial measures structured in a model specific to the company, and not identified as the TB or the BSC.
The data collected and presented in Table 2 allow us to conclude that: only 3% of the companies do not use a PES; the same percentage of companies (3%) uses only financial measures; most companies (94%) use systems that incorporate both financial and non-financial measures. However, for this latter group the use of unstructured composite measures is the greater contributor (43%). Only 24% of the companies use the BSC, and a significant number of companies (24%) use systems with financial and non-financial measures structured in a model specific to the company.
Table 2 – Performance evaluation systems used
PES used Frequencies Percentages (%)
None 1 3%
Only financial measures (FM) 1 3%
Unstructured composite measures (UCM) 13 43%
Tableau Bord (TB) 1 3%
Balanced Scorecard (BSC) 7 24%
Specific system 7 24%
Total 30 100%
The results show that the best companies where to work in Portugal present a BSC utilization rate higher than that of other Portuguese companies, namely when compared to: companies listed on the Euronext Lisbon with a utilization rate of 9% [8]; small and medium-sized industrial companies with a utilization rate of 5% [6]; large companies in the Madeira Islands with a utilization rate of 10% [36]; large Portuguese companies with a utilization rate of 19% [35]; 4 and 5 star hotels with a utilization rate of 14% [9]. However, the results of this study allow
us to conclude that the BSC utilization rate in the best companies where to work in Portugal is much lower than that found by Amorim and Machado [38] in Brazilian companies that have obtained the same rating (48%).
The discrepancy between the results, and those reported by other studies already conducted make it relevant to understand the causes that lead to the adoption of the BSC, as well as the benefits of its implementation. Regarding the causes of the BSC implementation, the three most reported and with
equal weight are as follows: to enable a global vision of the company (21%); to assess of the company’s performance in a more complete manner (21%); allow the alignment of the personal and departmental goals with the strategy (21%). Other causes mentioned are: enabling an improved long-term vision (14%); enabling strategy communication throughout the organization (10%); allowing strategy development (7%). The least reported causes are: it is the most common system (3%); enables strategic learning (3%).
Regarding the benefits arising from the use of the BSC, the most reported are the following: improvement in internal and external communication (23%); alignment of personal goals with company goals (23%); an overall vision of company performance (23%). Next are the benefits related with more adequate evaluation and reward systems (12%), and allowing strategic learning (12%). The least reported benefit is an increase in financial performance (7%).
Were also surveyed the companies that do not use the BSC nor the TB, in order to understand the causes for its non-utilization. For the non-utilization of the TB the main causes reported were the following: lack of interest in its utilization (44%); lack of knowledge about the system (19%); difficulties associated with its implementation (19%). With regard to the non-utilization of the BSC, the main causes reported where the following: lack of interest in its use (44%); difficulties associated with its implementation (25%). High implementation costs, a cause reported by Juhmani [34] was not chosen by any of the respondents.
All companies using the TB and the BSC report the existence of a direct relationship between the PES and the company's strategy, all of them considering that the PES is used as a strategic management system. For this reason, and for the analysis of the links, all the companies that use the BSC or the TB were considered in a single category.
4.2 Link between the system used and the
company’s characteristics
We have analysed the associations between the systems used and the following company characteristics: size; industry; position in the ranking; co-worker age; percentage of co-workers with higher education; geographic location; weight of female co-workers. No associations were found between the top five characteristics and the systems used by the companies.
Regarding the geographic location of the companies, the headquarters’ district was used as a variable. Lisboa is the most prevalent district (43%), followed by Aveiro (17%), Porto (13%), and Coimbra (10%). The districts of Braga and Açores have only two responding companies (7% each), and the Setubal district only one (3%). Table 3 links the PES used and the headquarters’ district. Its analysis allows us to observe some heterogeneity in the association of the two variables: in only three of the seven districts analysed the BSC or the TB are used; Lisboa is the district with a higher system diversity.
Table 3 –
Geographic location and PES
Location of Headquarters
Total Aveiro Braga Coimbra Lisboa Açores Porto Setubal
PES None 0 0 0 0 0 0 1 1 FM 0 0 0 1 0 0 0 1 UCM 2 1 2 4 2 2 0 13 TB/BSC 3 0 0 3 0 2 0 8 Specific 0 1 1 5 0 0 0 7 Total 5 2 3 13 2 4 1 30
This link was confirmed by the chi-square independence test, executed through the exact test, which has a value of 43.057 for 24 degrees of freedom and a p-value of 0.049. These results suggest the existence of a link between the
geographic location and the PES used, for an error of 5%. The intensity of this link can be measured by the Cramer's V statistics, which has a value of 0.599, suggesting the existence of a strong
association between the PES used by the company and the district where its headquarters are located.
Graph 1 allows a better analysis of this link: the only respondent company in the district of Setubal does not use any PES; all companies in Ponta Delgada use unstructured composite measures; the companies in the districts of Braga and Coimbra do not use the TB nor the BSC. Only the companies of Aveiro and Porto use mostly (60%
and 50%, respectively) the BSC or the TB. The district of Lisboa is the one with the greatest diversity of replies: 23% of the companies in this district use the BSC or the TB.
The results showed that only companies from the districts of Aveiro, Porto and Lisboa use systems theoretically linked with sustainable management; only in the northern part of the country can districts be found where most companies use these systems. Graph 1 – Geographic location and PES
Regarding the weight of female
co-workers, the percentage of women in the total
number of company employees was used as
variable, yielding an average of only 36% in the
respondent companies. Given the quantitative
characteristics of this variable, it was necessary
to divide it into two categories based on the
median, which stands at 31%: values up to the
median; values above the median. Table 4 links
this variable with the PES used and shows some
heterogeneity in the behaviour of both
variables, suggesting the existence of an
association between the two: in the companies
with less female employees the more used PES
is the BSC or the TB; in the companies with
more females employee the most widely used
PES are the unstructured composite measures.
This association was confirmed by the chi-square independence test, executed through the exact test, which has a value of 7.462 for 4 degrees of freedom, and a p-value of 0.076. These results suggest the existence of a link between the weight of female co-workers and the PES used, for a 10% error. The intensity of this link can be measured by the Cramer's V statistic, which has a value of 0.499, suggesting the existence of a moderate association between the system used by the company and the percentage of women.
Weight of female co-workers
Total Up to the median Above the median
PES None 1 0 1 FM 1 0 1 UCM 6 7 13 TB/BSC 7 1 8 Specific 2 5 7 Total 17 13 30
Graph 2 allows a better analysis of this link: the companies with fewer women are the ones not using any PES (6%), or using a system based solely on financial measures (6%); the companies with a higher percentage of women use systems with composite measures, the majority of which being unstructured composite measures (54%), and only 8% use the BSC or the TB.
We highlight also that it is in this group that the largest utilization rate of a PES specifically designed for each company, but not identified as the TB or the BSC, can be found. This fact may explain why the BSC or the TB are more used in companies with fewer women (41%), than in companies with more women (8%).
Graph 2 –
Weight of female co-workers and PES
4.3 Link between the system used and the
characteristics of the person in charge
We analysed the links between the systems used and the following characteristics of those in charge of the PES: gender, age, academic degree, area of the degree. No associations were found between the first three characteristics of the person in charge and the systems used by the companies.
Regarding the area of the academic degree, the data collected show that the majority (54%) of those
in charge of the PES has a degree in management in sensu lato, being also included in this category a higher education degree in human resources management, economy, accounting, taxes, marketing and entrepreneurship. Those in charge graduated in engineering account for 13% of the total, as well as those in charge of the PES who do not have higher education academic qualifications (13%). The remaining 20% relate to those graduated in other widely dispersed areas, not related to management or engineering.
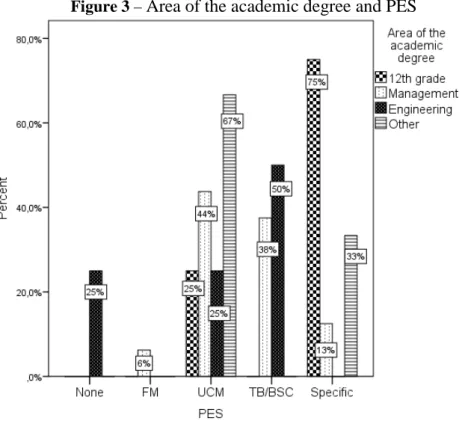
Table 5 links the PES with the area of the academic degree of the person in charge, showing some heterogeneity in the behaviour of both variables, which suggests the existence of a link between the two: only those in charge with an academic degree in management or engineering use the TB or the BSC. This association was confirmed by the chi-square independence test, executed through the exact test, which has a value of 19.509
for 12 degrees of freedom, and a p-value of 0.067. These results suggest the existence of a link between the area of the degree of the person in charge and the PES used, for a 10% error. The intensity of this association can be measured by the Cramer's V statistics, which has a value of 0.466, suggesting the existence of a moderate association between the PES used by the company and the area of the academic degree of the person in charge.
Table 5 –
Area of the academic degree and PES
Area of the academic degree
Total 12th grade Management Engineering Other
PES None 0 0 1 0 1 FM 0 1 0 0 1 UCM 1 7 1 4 13 TB/BSC 0 6 2 0 8 Specific 3 2 0 2 7 Total 4 16 4 6 30
Graph 3 allows a better analysis of this link: the majority of those in charge graduated in engineering uses the TB or the BSC (50%), however, about 25% of these do not use any PES; the majority (95%) of those graduated in management use systems incorporating both financial and non-financial
measures, but the unstructured composite measures are the system most used by this group (44%), followed by the TB or the BSC (38%), and systems specifically designed for the company (13%); the majority of those in charge graduated in other areas uses only unstructured composite measures (67%). Figure 3 –
Area of the academic degree and PES
This study has the following objectives: to analyse whether the companies rated as the best where to work use a performance evaluation system that enables sustainable management; to analyse whether there is a link between the systems used and the characteristics of the company and of the person in charge of the system.
Regarding the first objective, the data obtained allow us to conclude the following: the PES used by almost half of the companies is a combination of financial and non-financial measures, not structured in a specific system such as the BSC; only a quarter of the companies use the BSC. The BSC utilization rate found is higher than those of other Portuguese companies, namely when compared with studies already carried out in large companies, in small and medium industrial companies, and in 4 and 5 star hotels; however, it is much lower than the one found in Brazilian companies with the same rating. As the main reasons for using the BSC the following were identified: gives a global vision of the company; allows to assess performance more comprehensively; enables the alignment of personal and departmental goals with strategy. As main benefits of using the BSC we identified the following: improvement of internal and external communication; alignment of personal goals with company goals; a complete view of the company's performance. As the main reasons for not using the BSC we found the following: lack of interest in its use; difficulties associated with its implementation.
Regarding the second goal, we found no associations between the system used and the following company characteristics: size; industry; position in the ranking; co-worker age; percentage of co-workers with higher education. A link was found between the PES used and two company characteristics: its geographic location; the weight of the female co-workers. With regard to geographic location, it was concluded that only in the north of Portugal can districts be found where the majority of the companies uses systems theoretically linked with sustainable management. In terms of the weight of the female co-workers, we concluded this: companies with fewer women are the ones not using performance appraisal systems, or using a system based solely on financial measures; companies with more women use proportionately more a PES consisting of financial and non-financial measures structured in a specific model, not identified as the TB or the BSC.
As regards the third objective, no associations were found between the system used and the following characteristics of the person in charge: gender, age, academic degree. A link was found
between the PES used and the area of the academic degree of the person in charge – we concluded that those graduated in engineering use proportionately more the TB or the BSC.
The results allow us to identify four contributions of this study. Firstly, we can conclude that the companies classified as the best where to work in Portugal present a utilization rate of performance evaluation systems driving sustainable management higher than that of other Portuguese companies. Secondly, the results also lead to the conclusion that that utilization rate is about half of the one found in companies from another country also rated as the best where to work. Thirdly, they allow us to conclude that only in the north of Portugal can districts be found where the majority of the companies uses systems theoretically associated with sustainable management. Fourthly, the results also state that those in charge graduated in engineering are the ones using proportionately more the systems that drive sustainable management.
The limitations of this study are following: the small number of replies obtained; the choice of the survey as a data collection method, since it does not allow the clarification of doubts regarding the questions asked.
We suggest further research to be conducted to determine the causes and the characteristics of the PES used in about a quarter of the companies, whose managers reported using financial and non-financial measures structured in a specific model, not identified as the TB or the BSC.
References
[1] Presley, A.; Meade, L. 2010. Benchmarking for sustainability: an application to the sustainable construction industry. Benchmarking: An International Journal, 17(3): 435-451.
[2] Chalmeta R.; Palomero, S. 2011. Methodological proposal for business sustainability management by means of the Balanced Scorecard. Journal of the Operational Research Society, 1(62): 1344–1356.
[3] Reefke, H.; Trocchi, M. 2013. Balanced scorecard for sustainable supply chains: design and development guidelines. International Journal of Productivity and Performance Management, 62(8): 805-826.
[4] Abo-Hamad, W.; Arisha, A. 2013. Simulation-based framework to improve patient experience in an emergency department. European Journal of Operational Research, 1(224): 154-166.
[5] Zavodna, L. S. (2013). Sustainability As A Part Of Balanced Scorecard. Global Economic Observer, 1(1), 110-116.
[6] Machado, M. 2013. Balanced Scorecard : an empirical study of small and medium size enterprises. RBGN – Review of Business Management, 15 (46): 129–148.
[7] Hoque, Z.; James, W. 2000. Linking Balanced Scorecard measures to size and market factors : Impact on organizational performance. Journal of Management Accounting Research, 12: 1–17. [8] Arsénio, M.; Machado, M. 2013. Contabilidade
de gestão em Portugal: Estudo empírico nas empresas cotadas na bolsa portuguesa. Revista Iberoamericana de Contabilidad de Gestión, XI (22): 1–20.
[9] Nunes, C.; Machado, M. 2014. Performance evaluation methods in the hotel industry. Tourism & Management Studies, 10 (1): 24-30. [10] Kaplan, R.; Norton, D. 1992. The balanced
scorecard – Measures that drive performance. Harvard Business Review, January-February: 71–79.
[11] Kaplan, R.; Norton, D. 1996b. The balanced scorecard - Translating strategy into action. Boston : Harvard Business School Press.
[12] Striteska, M.; Spickova, M. 2012. Review and comparison of performance measurement systems. Journal of Organizational Management Studies, 2012: 1–13.
[13] Kuwaiti, M. 2004. Performance measurement process: definition & ownership. International Journal of Operations & Production Management, 24 (1-2): 55–78.
[14] Cheffi, W.; Rao, A.; Beldi, A. 2010. Designing a performance measurement system: Accountants and managers diverge. Management Accounting Quarterly, 11 (3): 8– 22.
[15] Ittner, C.; Larcker, D.; Meyer, M. 2003a. Subjectivity and the weighting of performance measures: Evidence from a balanced scorecard. The Accounting Review, 78 (3): 725–758.
[16] Tung, A.; Baird, K.; Schoch, H. 2011. Factors influencing the effectiveness of performance measurement systems. International Journal of Operations & Production Management, 31 (12): 1287–1310. [17] Epstein, M.; Manzoni, J. 1997. The
balanced Scorecard and tableau de bord: A global perspective on translating strategy into action. Management Accounting, 79 (2): 28–36. [18] Epstein, M.; Manzoni, J. 1998.
Implementing corporate strategy : From tableaux de bord to balanced scorecards.
European Management Journal, 16 (2): 190– 203.
[19] Quesado, P.; Guzmán, B.; Rodrigues, L. 2012. O tableau de bord e o balanced scorecard: Uma análise comparativa. Revista de Contabilidade e Controladoria, 4 (2): 128–150. [20] Bourguignon, A.; Malleret, V.; Nørreklit, H.
2004. The American balanced scorecard versus the French tableau de bord: the ideological dimension. Management Accounting Research, 15: 107–134.
[21] Kaplan, R.; Norton, D. 1996a. Linking the balanced scorecard to strategy. California Management Review, 39 (1): 53–79.
[22] Kaplan, R.; Norton, D. 1996c. Using the balanced scorecard as a strategic management system. Harvard Business Review, 74 (1): 75– 85.
[23] Kaplan, R.; Norton, D. 2000. Having trouble with your strategy ? Then map it. Harvard Business Review, September-October (5165): 1–11.
[24] Kaplan, R.; Norton, D. 2001a. The strategy-focused organization. Strategy & Leadership, 29 (3): 41–42.
[25] Kaplan, R.; Norton, D. 2001b. Transforming the balanced scorecard from performance measurement to strategic management: Part I. Accounting Horizons, 15 (1): 87–104.
[26] Kaplan, R.; Norton, D. 2001c. Transforming the balanced scorecard from performance measurement to strategic management: Part II. Accounting Horizons, 15 (2): 147–160.
[27] Kaplan, R.; Norton, D. 2004a. How strategy maps frame an organization’s objectives. Financial Executive, 20 (2): 40–45.
[28] Kaplan, R.; Norton, D. 2004b. Plotting success with strategy maps. Optimize, February: 61-65.
[29] Kaplan, R. 2006. The competitive advantage of management accounting. Journal of Management Accounting Research, 18: 127– 135.
[30] Kald, M.; Nilsson, F. 2000. Performance Measurement At Nordic Companies. European Management Journal, 18 (1): 113–127.
[31] Rigby, D. 2001. Management tools and techniques : A survey. California Management Review, 43 (2): 139–160.
[32] Ittner, C.; Larcker, D.; Randall, T. 2003b. Performance implications of strategic performance measurement in financial services firms. Accounting, Organizations and Society, 28 (7-8): 715–741.
[33] Speckbacher, G.; Bischof, J.; Pfeiffer, T. 2003. A descriptive analysis on the implementation of balanced scorecards in German-speaking countries. Management Accounting Research, 14 (4): 361–387.
[34] Juhmani, O. 2007. Usage, motives and usefulness of the balanced ccorecard: Evidence from Bahrain. International Journal of Business Research, VII (5): 106–117.
[35] Quesado, P.; Rodrigues, L. 2009. Factores determinantes na implementação do balanced scorecard em Portugal. Revista Universo Contábil, 5 (4): 94–115.
[36] Curado, C.; Manica, J. 2010. Management control systems in Madeira island largest firms: Evidence on the balanced scorecard usage. Journal of Business Economics and Management, 11 (4): 652–670.
[37] Kraus, K.; Lind, J. 2010. The impact of the corporate balanced scorecard on corporate control - A research note. Management Accounting Research, 21 (4): 265–277.
[38] Amorim, D.; Machado, M. 2015. Balanced Scorecard: Empirical Study in Brazil. The Social Sciences, 10(6): 723-733.