Performance assessment of vehicular delay-tolerant networks
228
0
0
Texto
(2) ii.
(3) Dedication To my wife, Cláudia Soares, and my son, Francisco Soares, for their love, support and encouragement.. iii.
(4) iv.
(5) Acknowledgements Acknowledgments It would not have been possible to write this thesis without the help and support of the individuals and organizations mentioned here. First and foremost, I would like to express my utmost gratitude to my supervisor Professor Dr. Joel José Puga Coelho Rodrigues for his constant guidance, patience, encouragement, and support. Without his expertise, research insight, and invaluable help this thesis would not have been possible. I also like to express my gratitude to Professor Dr. Farid Farahmand for providing valuable suggestions that improved the quality of this study. I am most grateful to the University of Beira Interior and the Instituto de Telecomunicações Covilhã Delegation for all the support that was given to me. This work was also financially supported in part by the Network of Excellence Euro-NF — Anticipating the Network of the Future – from Theory to Design — the Seventh Framework Programme of the European Community, Information and Communication Technologies, in the framework of the Specific Joint Research Project VDTN, and by the VDTN@Lab Project - Vehicular Delay-Tolerant Networks — an internal project of the Instituto de Telecomunicações. I also want to thank all my colleagues in the Next Generation Networks and Applications (NetGNA) research group for creating a great atmosphere. Special thanks to João Dias, João Isento, and Bruno Silva. It was a pleasure to work together with them on the development of our testbed. I would also like to thank my colleagues of the Technical-Scientific Unit of Informatics of the Superior School of Technology of the Polytechnic Institute of Castelo Branco for their support during this work. I would like to give a very special thanks to Alexandre Fonte, Paulo Neves, and João Caldeira for providing numerous ideas, useful discussions, and continuous encouragement. Also, heartfelt thanks to my parents António Soares and Maria Soares, my brother André Soares, and my grandmother-in-law Lucília Fonseca for their encouragement throughout this work. My last and deepest gratitude goes to my beloved wife Cláudia Soares for her constant love and understanding, and to my wonderful son Francisco Soares who has been an inspiration, and a source of energy for me. They helped me to concentrate on completing this thesis and. v.
(6) supported mentally during the course of this work. Without their help and encouragement, this study would not have been completed.. vi.
(7) Abstract Abstract Vehicular networks have attracted considerable attention in the last few years, both in academia and industry. One of the main reasons for their growing popularity can be attributed to the various applications that they make possible. Road safety, traffic monitoring, driving assistance, entertainment, and delivering connectivity to rural/remote communities or catastrophe-hit areas are just a few examples of the many applications envisioned for these networks. Nevertheless, the special characteristics of vehicular networks such as high mobility, highly dynamic network topology, short contact durations, disruption, intermittent connectivity, significant loss rates, variable node density, and network partitioning introduce unique challenges, which greatly impact the deployment of these networks. Such challenges make data dissemination and routing interesting research topics within the vehicular networking area, which are addressed by this research. The work presented in this thesis is motivated by the need to find new solutions to the communication problems arising in disconnected opportunistic vehicular networking scenarios. A new network architecture for vehicular communications is therefore proposed in this work, called vehicular delay-tolerant network (VDTN). Its layered structure is introduced and the corresponding performance analysis is conducted. This architecture differs from other proposals in the literature in several respects. Briefly, it adopts a store-carry-and-forward paradigm combined with an IP over VDTN approach and out-of-band signaling with control and data plane separation. This thesis presents studies on the impact of stationary relay nodes, node density, vehicles movement patterns, and storage constraints on the VDTN network performance, in terms of bundle delivery probability and bundle average delivery delay. Of particular interest to this thesis is the performance improvement of these networks. In particular, node localization information is exploited to improve and optimize the use of data plane resources. It is demonstrated the performance gains attainable in a VDTN through the cooperation between network nodes, in terms of bundle delivery probability and bundle average delivery delay. These performance metrics are also used to investigate the impact of non-priority and priority-based queueing disciplines. Finally, a detailed analysis is performed with the proposed routing protocol for VDTNs, called GeoSpray, against popular single-copy (Direct Delivery, First Contact, GeOpps), and multiplecopy (Epidemic, Spray and Wait, PRoPHET) routing protocols. Such protocols are considered reference in the literature of DTN networks and were deployed in VDTNs. It is shown that GeoSpray yields significant performance gains in terms of the bundle delivery probability and. vii.
(8) the bundle average delivery delay. The proposed protocol proves to be efficient in terms of storage and bandwidth resources utilization. The results presented in this thesis are based on computer simulations and testbed experiments. The lack of a simulator specialized for VDTN layered network architecture, created the necessity to propose, develop, and implement a simulation tool for VDTNs, called VDTNsim. VDTNsim was used as a basis for the creation of a prototype of a VDTN laboratory testbed, named VDTN@Lab. This thesis aims to contribute to the advance of the state-of-the-art on techniques for tackling the challenges that arise from the unique properties of vehicular networks. Further, this thesis highlights important guidelines for the improvement and design of new protocols, algorithms, services, and applications for vehicular delay-tolerant networks.. Keywords Keywords Vehicular Delay-Tolerant Networking, Vehicular Ad-Hoc Networking, Vehicular Networking, Vehicular. Communications,. Delay. and. Disruption-Tolerant. Networking,. Opportunistic. Networking, Routing, Cooperation, Queuing Disciplines, Scheduling Policies, Dropping Policies, Traffic Differentiation, Rural Connectivity, Geographic Localization, Simulation, Testbed, Performance Assessment. viii.
(9) Contents Contents Acknowledgments .......................................................................................... v Abstract .....................................................................................................vii Keywords ................................................................................................... viii Contents ..................................................................................................... ix List of Figures .............................................................................................xiii List of Tables .............................................................................................. xxi Acronyms and Abbreviations ......................................................................... xxiii Extended Abstract in Portuguese ...................................................................xxvii 1. Introduction .............................................................................................. 1 1.1. Focus.................................................................................................. 1 1.2. Problem Definition and Objectives .............................................................. 3 1.3. Main Contributions.................................................................................. 4 1.4. Thesis Organization................................................................................. 7 2. Background and Related Work ....................................................................... 9 2.1. Introduction ......................................................................................... 9 2.2. Vehicular Networks ................................................................................. 9 2.2.1. Vehicular Networks Applications...........................................................10 2.2.2. Research Projects on Vehicular Networks ................................................11 2.2.3. Vehicular Network Architectures ..........................................................14 2.2.3.1. Routing in Vehicular Ad Hoc Networks ..............................................15 2.3. Delay and Disruption Tolerant Networks .......................................................18 2.3.1. Application Scenarios ........................................................................22 2.3.2. Routing Protocols.............................................................................24 2.3.2.1. Single-copy Routing Protocols.........................................................24 2.3.2.2. Multiple-copy Routing Protocols ......................................................27 2.3.3. Stationary Relay Nodes ......................................................................31 2.3.4. Cooperation ...................................................................................34 2.3.5. Queuing Disciplines ..........................................................................36 2.4. Summary ............................................................................................38 3. Vehicular Delay-Tolerant Networks ................................................................39 3.1. Introduction ........................................................................................39 3.2. A Layered Architecture for Vehicular Delay-Tolerant Networks ...........................39 3.2.1. Data Plane .....................................................................................43 . ix.
(10) Contents. 3.2.1.1. Bundle Aggregation and De-aggregation Layer..................................... 43 3.2.1.2. Media Access Control Layer ........................................................... 45 3.2.1.3. Physical Layer ........................................................................... 46 3.2.2. Control Plane ................................................................................. 46 3.2.2.1. Bundle Signaling Control Layer ....................................................... 46 3.2.2.2. Media Access Control and Physical Layers .......................................... 47 3.3. Exploiting Node Localization..................................................................... 48 3.4. Traffic Differentiation Support .................................................................. 53 3.4.1. Data Bundles Classification and Marking ................................................. 54 3.4.2. Buffer Management Strategies ............................................................. 55 3.4.3. Scheduling Policies........................................................................... 56 3.5. GeoSpray: A Geographic Routing Protocol for VDTNs ........................................ 57 3.5.1. Protocol Operation........................................................................... 57 3.5.2. Protocol Design ............................................................................... 60 3.6. Summary ............................................................................................ 63 4. Design and Implementation of a Simulation Tool and a Laboratory Testbed for VDTNs.65 4.1. Introduction ........................................................................................ 65 4.2. Design and Implementation of a Simulation Tool............................................. 66 4.2.1. Opportunistic Network Environment Simulator.......................................... 66 4.2.1.1. Graphical User Interface of the ONE Simulator .................................... 67 4.2.1.2. Scenario Generation.................................................................... 69 4.2.1.3. Simulation Reports ..................................................................... 72 4.2.2. VDTNsim Simulation Tool ................................................................... 73 4.2.3. Map-based Model Representation of the Serra da Estrela Region .................... 80 4.3. Design and Implementation of a Laboratory Testbed........................................ 82 4.3.1. VDTN@Lab Prototype ........................................................................ 84 4.4. Summary ............................................................................................ 89 5. Performance Assessment of VDTNs in Rural Connectivity Scenarios ........................91 5.1. Introduction ........................................................................................ 91 5.2. Performance Metrics .............................................................................. 94 5.3. Impact of Stationary Relay Nodes on the Network Performance........................... 95 5.3.1. Network Scenario ............................................................................ 95 5.3.2. Performance Assessment.................................................................... 96 5.4. Effect of Mobile Node Density and Movement Models on the Network Performance ... 99 5.4.1. Network Settings ............................................................................. 99 5.4.2. Performance Results....................................................................... 100 5.5. Impact of Storage Constraints on the Network Performance ............................. 107 5.5.1. Network Setup .............................................................................. 107 5.5.2. Results Analysis............................................................................. 109 . x.
(11) Contents. 5.6. Summary .......................................................................................... 114 6. Improving the Performance of VDTNs............................................................ 115 6.1. Introduction ...................................................................................... 115 6.2. Performance Metrics ............................................................................ 116 6.3. Impact of Node Localization on the Network Performance ............................... 117 6.3.1. Network Scenario........................................................................... 117 6.3.2. Performance Assessment .................................................................. 118 6.4. Effect of Cooperation on the Network Performance ....................................... 120 6.4.1. Network Settings ........................................................................... 121 6.4.2. Performance Results ....................................................................... 122 6.5. Impact of Queuing Disciplines on the Network Performance ............................. 126 6.5.1. Scheduling and Dropping Policies ........................................................ 127 6.5.2. Network Setup .............................................................................. 129 6.5.3. Results Analysis ............................................................................. 131 6.6. Impact of Traffic Differentiation on the Network Performance .......................... 136 6.6.1. Network Parameters ....................................................................... 137 6.6.2. Performance Evaluation ................................................................... 138 6.7. Performance Assessment of GeoSpray Routing Protocol................................... 143 6.7.1. Network Settings ........................................................................... 143 6.7.2. Results Analysis ............................................................................. 144 6.8. Testbed-based Performance Evaluation of Routing Protocols ............................ 154 6.8.1. Experimental Setup ........................................................................ 154 6.8.2. Experimental Results ...................................................................... 155 6.9. Summary .......................................................................................... 159 7. Conclusions and Future Work ..................................................................... 163 7.1. Conclusions ....................................................................................... 163 7.2. Future Work ...................................................................................... 167 References ................................................................................................ 169 . xi.
(12) Contents. xii.
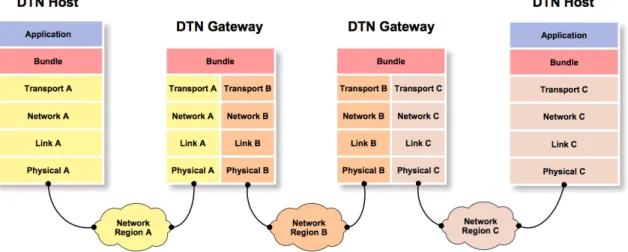
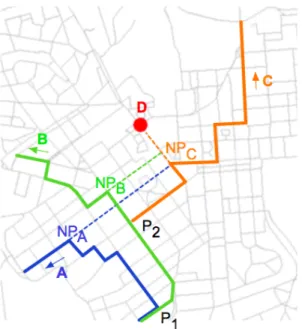
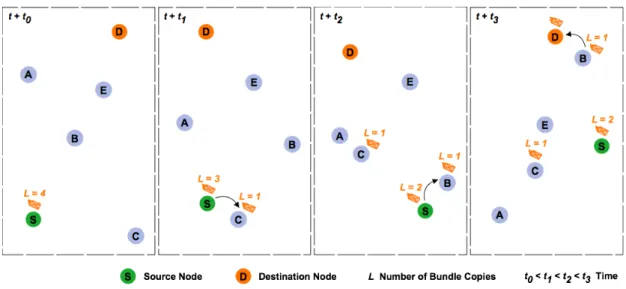
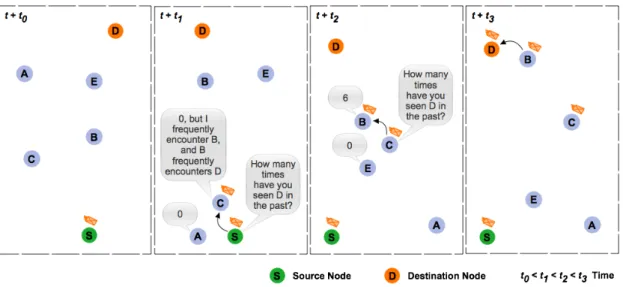
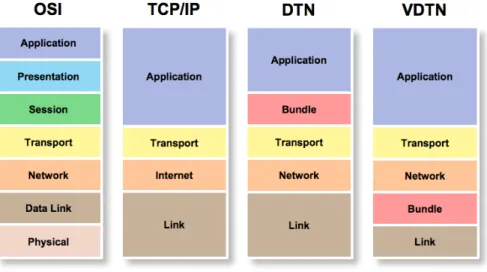
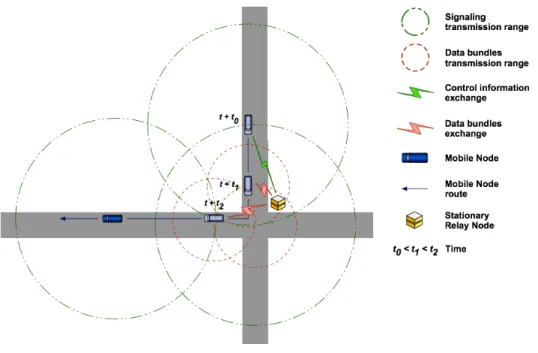
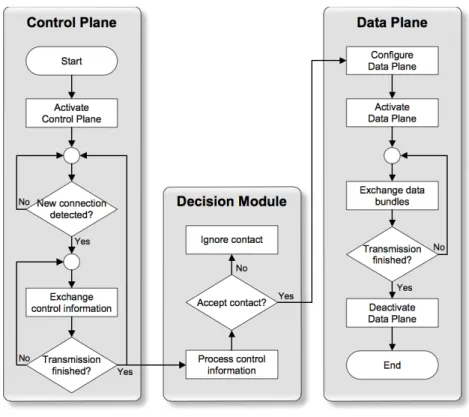
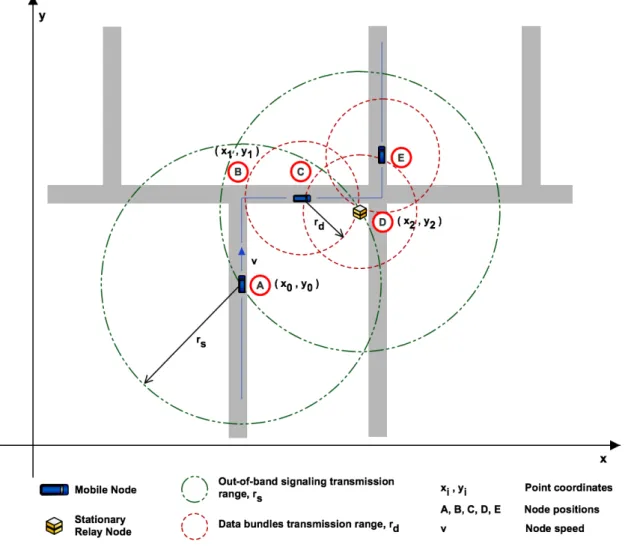
(13) List of Figures List of Figures Figure 2.1: Illustration of communication scenarios in a vehicular ad hoc network. ............15 Figure 2.2: Illustration of (a) unicast, (b) multicast/geocast, and (c) broadcast routing schemes. ...............................................................................................16 Figure 2.3: Illustration of (a) reactive, (b) proactive, and (c) position-based/geographic routing schemes. .....................................................................................17 Figure 2.4: Illustration of DTN layered architecture..................................................19 Figure 2.5: Illustration of DTN (a) custody transfer and (b) return receipt functionalities.....20 Figure 2.6: DTN bundle protocol architecture, and DTN host and gateway concepts. ..........20 Figure 2.7: Illustration of the DTN store-carry-and-forward paradigm. ...........................21 Figure 2.8: Illustration of the Direct Delivery routing protocol operation. .......................25 Figure 2.9: Illustration of the First Contact routing protocol operation. ..........................25 Figure 2.10: Example of GeOpps calculation of the nearest point (NP) from bundle’s destination (D), for vehicles A, B, and C. ........................................................27 Figure 2.11: Illustration of the Epidemic routing protocol operation. .............................28 Figure 2.12: Illustration of the Source Spray and Wait routing protocol operation. .............29 Figure 2.13: Illustration of the Binary Spray and Wait routing protocol operation. .............29 Figure 2.14: Example of using the historic of node encounters and transitivity information, as basis for PRoPHET routing decisions...............................................................30 Figure 2.15: Illustration of the data exchange among vehicles and a stationary relay node deployed at a road intersection....................................................................32 Figure 2.16: Illustration of a non-cooperative network scenario. ..................................34 Figure 2.17: Illustration of a queueing discipline composed by a scheduling and a dropping policy. ..................................................................................................37 Figure 3.1: Illustration of VDTN network nodes. ......................................................40 Figure 3.2: Comparison of OSI, TCP/IP, DTN, and VDTN protocol layers. .........................41 Figure 3.3: IP-over-VDTN layered architecture. .......................................................42 Figure 3.4: Illustration of the store-carry-and-forward paradigm in a VDTN network...........43 Figure 3.5: Example of the transmission of control bundles and data bundles, between network nodes, from a source to a destination..................................................44 Figure 3.6: Illustration of control information and data bundles exchange between network nodes. ..................................................................................................47 Figure 3.7: Illustration of an incomplete bundle transmission. .....................................48 Figure 3.8: Illustration of different types of contacts between network nodes in VDTNs. .....50 Figure 3.9: Flowchart describing control plane and data plane interaction, coordinated by the decision module. .....................................................................................51 Figure 3.10: Prediction of contact duration and data link activation and deactivation time. .53 Figure 3.11: Illustration of FIFO policy..................................................................54 . xiii.
(14) List of Figures. Figure 3.12: Illustration of traffic differentiation in vehicular delay-tolerant networks. ...... 54 Figure 3.13: Operation of a common buffer for all priority classes. ............................... 55 Figure 3.14: Operation of separate queues for each priority class................................. 56 Figure 3.15: UML activity diagram describing the sequence of main actions executed in GeoSpray when two nodes exchange data among them. ...................................... 59 Figure 3.16: Routing control data-fusion model for GeoSpray. ..................................... 60 Figure 3.17: GeoSpray protocol pseudo-code.......................................................... 62 Figure 3.18: Position of data bundle i in a queue of data bundles to be transmitted from the node X to the node Y. ............................................................................... 62 Figure 4.1: Screenshot of the ONE simulator’s graphical user interface. ......................... 68 Figure 4.2: Detail of a mobile node’s current location and its path. .............................. 68 Figure 4.3: Detail about two nodes carrying and exchanging bundles. ............................ 68 Figure 4.4: Detail providing information about a node’s routing module. ........................ 69 Figure 4.5: Screenshot of the ONE running simulations on a batch mode......................... 69 Figure 4.6: Example of a simulation scenario configuration file.................................... 72 Figure 4.7: Bundle stats report from a simulation run. .............................................. 73 Figure 4.8: UML deployment diagram representing the implementation perspective of the VDTNsim framework in the ONE core simulator. ................................................ 74 Figure 4.9: UML class diagram of VDTNsim describing the general classes of the VDTN architecture model and the relations among them. ............................................ 75 Figure 4.10: UML activity diagram of VDTNsim describing the control and data planes interaction coordinated by the decision module. ............................................... 76 Figure 4.11: Example of configuring radio interfaces for control information and data bundles exchange (out-of-band signaling). ................................................................. 76 Figure 4.12: Example of configuring GeoSpray routing protocol parameters. .................... 77 Figure 4.13: Example of configuring a percentage of data plane buffer capacity and bandwidth resources to cooperate in bundle relay. ............................................ 77 Figure 4.14: Bundle stats report with support for traffic differentiation and showing the volume of bytes transferred over the network. ................................................. 79 Figure 4.15: Total number of contacts registered per hour for each type of network nodes. . 79 Figure 4.16: Google™ Map of the Serra da Estrela region, Portugal. .............................. 80 Figure 4.17: Using OpenJUMP to develop a map-based model of the Serra da Estrela region, Portugal................................................................................................ 81 Figure 4.18: VDTNsim running a rural connectivity scenario in the Serra da Estrela region, Portugal................................................................................................ 81 Figure 4.19: Network nodes in the VDTN@Lab testbed. ............................................. 84 Figure 4.20: A photo of a mobile node created using a LEGO MINDSTORMS NXT robot with an integrated (a) PDA or (b) netbook. ................................................................ 85 Figure 4.21: Screenshot of NXT-G showing the program blocks that implement a mobility model. ................................................................................................. 86 . xiv.
(15) List of Figures. Figure 4.22: VDTN@Lab software user interface for mobile nodes ((a) PDAs; (b) netbooks)...87 Figure 4.23: VDTN@Lab software user interface for terminal nodes...............................87 Figure 4.24: VDTN@Lab software user interface for relay nodes. ..................................88 Figure 4.25: VDTN@Lab software user interface for configuring testbed settings. ..............88 Figure 4.26: Photos of the VDTN@Lab testbed running experiments on a rural connectivity scenario with a route-based movement model. .................................................89 Figure 4.27: Photos of the VDTN@Lab testbed running experiments with a random movement model along the road topology.....................................................................89 Figure 5.1: Example of a vehicular delay-tolerant network deployment in a rural scenario. ..93 Figure 5.2: Illustration of the Serra da Estrela region with the location of the terminal nodes and the stationary relay nodes. ....................................................................96 Figure 5.3: Number of contacts per hour between all network nodes as function of the number of stationary relay nodes..................................................................97 Figure 5.4: Bundle delivery probability as function of the number of stationary relay nodes for Epidemic, Spray and Wait, PRoPHET, and MaxProp routing protocols. ......................98 Figure 5.5: Bundle average delivery delay as function of the number of stationary relay nodes for Epidemic, Spray and Wait, PRoPHET, and MaxProp routing protocols...................98 Figure 5.6: Illustration of the Serra da Estrela region with the location of the terminal nodes and stationary relay nodes, and the two buses routes. ...................................... 100 Figure 5.7: Bundle delivery probability for Epidemic, MaxProp, PRoPHET, and Spray and Wait routing protocols with 5 or 8 cars................................................................ 101 Figure 5.8: Bundle average delivery delay for Epidemic, MaxProp, PRoPHET, and Spray and Wait routing protocols with 5 or 8 cars. ........................................................ 102 Figure 5.9: Number of contacts per hour between all network nodes with 5 or 8 cars. ...... 102 Figure 5.10: Number of contacts per hour between all network nodes with 5 or 8 cars...... 103 Figure 5.11: Bundle delivery probability for Epidemic, MaxProp, PRoPHET, and Spray and Wait routing protocols with 5 or 8 cars................................................................ 104 Figure 5.12: Bundle average delivery delay for Epidemic, MaxProp, PRoPHET, and Spray and Wait routing protocols with 5 or 8 cars. ........................................................ 104 Figure 5.13: Bundle delivery probability for Epidemic, MaxProp, PRoPHET, and Spray and Wait routing protocols with 1 or 2 buses. ............................................................. 106 Figure 5.14: Bundle average delivery delay for Epidemic, MaxProp, PRoPHET, and Spray and Wait routing protocols with 1 or 2 buses. ...................................................... 106 Figure 5.15: Illustration of mobile nodes carrying data between terminal nodes.............. 107 Figure 5.16: Illustration of the Serra da Estrela region map area with the location of the terminal nodes and the relay nodes. ............................................................ 108 Figure 5.17: Bundle delivery probability as function of terminal nodes buffer size for Epidemic, MaxProp, PRoPHET, Binary and Normal Spray and Wait routing protocols, using 6 mobile nodes with 200 MB buffer size. ....................................................... 109 . xv.
(16) List of Figures. Figure 5.18: Bundle delivery probability as function of terminal nodes buffer size for Epidemic, MaxProp, PRoPHET, Binary and Normal Spray and Wait routing protocols, using 6 mobile nodes with 400 MB buffer size. ....................................................... 110 Figure 5.19: Bundle delivery probability as function of terminal nodes buffer size for Epidemic, MaxProp, PRoPHET, Binary and Normal Spray and Wait routing protocols, using 12 mobile nodes with 200 MB buffer size....................................................... 111 Figure 5.20: Bundle delivery probability as function of terminal nodes buffer size for Epidemic, MaxProp, PRoPHET, Binary and Normal Spray and Wait routing protocols, using 12 mobile nodes with 400 MB buffer size....................................................... 112 Figure 5.21: Bundle delivery probability as function of terminal nodes buffer size for Epidemic, MaxProp, PRoPHET, Binary and Normal Spray and Wait routing protocols, using 18 mobile nodes with 200 MB buffer size....................................................... 113 Figure 5.22: Bundle delivery probability as function of terminal nodes buffer size for Epidemic, MaxProp, PRoPHET, Binary and Normal Spray and Wait routing protocols, using 18 mobile nodes with 400 MB buffer size....................................................... 113 Figure 6.1: Illustration of the Helsinki downtown (Finland) simulation scenario, with the locations of the stationary relay nodes. ........................................................ 118 Figure 6.2: Average number of contacts registered between mobile nodes (M – M) and between mobile nodes and relay nodes (M – R) as function of average vehicle speed. . 119 Figure 6.3: Number of relayed bundles as function of average vehicle speed when node localization function is disabled or enabled. .................................................. 119 Figure 6.4: Bundle delivery probability as function of average vehicle speed when node localization function is disabled or enabled. .................................................. 120 Figure 6.5: Bundle average delivery delay as function of average vehicle speed when node localization function is disabled or enabled. .................................................. 120 Figure 6.6: Illustration of the Helsinki (Finland) simulation scenario (area of 4500x3000 meters), with the locations of the stationary relay nodes (R). ............................. 122 Figure 6.7: Bundle delivery probability for Epidemic routing protocol as function of the cooperation percentage for vehicles buffer sizes of 25, 50, 75, and 100 MB. ............ 123 Figure 6.8: Bundle average delivery delay for Epidemic routing protocol as function of the cooperation percentage for vehicles buffer sizes of 25, 50, 75, and 100 MB. ............ 124 Figure 6.9: Bundle delivery probability for Spray and Wait routing protocol as function of the cooperation percentage for vehicles buffer sizes of 25, 50, 75, and 100 MB. ............ 125 Figure 6.10: Bundle average delivery delay for Spray and Wait routing protocol as function of the cooperation percentage for vehicles buffer sizes of 25, 50, 75, and 100 MB. ....... 125 Figure 6.11: Number of contacts per hour between network nodes, with 25 or 50 vehicles moving at an average speed of 30 km/h or 50 km/h. ........................................ 126 Figure 6.12: Contact durations with 25 or 50 vehicles moving at an average speed of 30 km/h or 50 km/h. ......................................................................................... 127 . xvi.
(17) List of Figures. Figure 6.13: Illustration of the Helsinki (Finland) simulation scenario (area of 4500×3400 meters), with the locations of the stationary relay nodes. .................................. 130 Figure 6.14: Bundle delivery probability as function of bundles TTL in a scenario with 25 vehicles moving at an average speed of 30 km/h for FIFO, Random, RL ASC, RL DESC, RC ASC, and RC DESC combinations of scheduling and dropping policies...................... 131 Figure 6.15: Bundle average delivery delay as function of bundles TTL in a scenario with 25 vehicles moving at an average speed of 30 km/h for FIFO, Random, RL ASC, RL DESC, RC ASC, and RC DESC combinations of scheduling and dropping policies...................... 132 Figure 6.16: Bundle delivery probability as function of bundles TTL in a scenario with 25 vehicles moving at an average speed of 50 km/h for FIFO, Random, RL ASC, RL DESC, RC ASC, and RC DESC combinations of scheduling and dropping policies...................... 133 Figure 6.17: Bundle average delivery delay as function of bundles TTL in a scenario with 25 vehicles moving at an average speed of 50 km/h for FIFO, Random, RL ASC, RL DESC, RC ASC, and RC DESC combinations of scheduling and dropping policies...................... 133 Figure 6.18: Bundle delivery probability as function of bundles TTL in a scenario with 50 vehicles moving at an average speed of 30 km/h for FIFO, Random, RL ASC, RL DESC, RC ASC, and RC DESC combinations of scheduling and dropping policies...................... 134 Figure 6.19: Bundle average delivery delay as function of bundles TTL in a scenario with 50 vehicles moving at an average speed of 30 km/h for FIFO, Random, RL ASC, RL DESC, RC ASC, and RC DESC combinations of scheduling and dropping policies...................... 135 Figure 6.20: Bundle delivery probability as function of bundles TTL in a scenario with 50 vehicles moving at an average speed of 50 km/h for FIFO, Random, RL ASC, RL DESC, RC ASC, and RC DESC combinations of scheduling and dropping policies...................... 136 Figure 6.21: Bundle average delivery delay as function of bundles TTL in a scenario with 50 vehicles moving at an average speed of 50 km/h for FIFO, Random, RL ASC, RL DESC, RC ASC, and RC DESC combinations of scheduling and dropping policies...................... 136 Figure 6.22: Simulation scenario of Helsinki downtown (Finland) area, with a dimension of 4500×3400 meters. ................................................................................. 138 Figure 6.23: Number of delivered bundles per priority class as function of vehicles buffer size for PG and CST scheduling policies, with 25 vehicles moving at an average speed of 30 km/h.................................................................................................. 139 Figure 6.24: Number of delivered bundles per priority class as function of vehicles buffer size for PG and CST scheduling policies, with 25 vehicles moving at an average speed of 50 km/h.................................................................................................. 139 Figure 6.25: Number of dropped bundles per priority class as function of vehicles buffer size for PG and CST scheduling policies, with 25 vehicles moving at an average speed of 30 km/h.................................................................................................. 140 Figure 6.26: Number of delivered bundles per priority class as function of vehicles buffer size for PG and CST scheduling policies, with 50 vehicles moving at an average speed of 30 km/h.................................................................................................. 141 . xvii.
(18) List of Figures. Figure 6.27: Number of delivered bundles per priority class as function of vehicles buffer size for PG and CST scheduling policies, with 50 vehicles moving at an average speed of 50 km/h. ................................................................................................ 141 Figure 6.28: Number of dropped bundles per priority class as function of vehicles buffer size for PG and CST scheduling policies, with 50 vehicles moving at an average speed of 30 km/h. ................................................................................................ 142 Figure 6.29: Number of dropped bundles per priority class as function of vehicles buffer size for PG and CST scheduling policies, with 50 vehicles moving at an average speed of 50 km/h. ................................................................................................ 142 Figure 6.30: Illustration of the Helsinki downtown (Finland) map (area of 4500×3400 meters), with the locations of the terminal nodes and the stationary relay nodes................. 144 Figure 6.31: Number of initiated bundle transmissions as function of bundles TTL in a scenario with 100 vehicles for First Contact, Direct Delivery, Epidemic, Binary and Source Spray and Wait, PRoPHET, GeOpps, and GeoSpray routing protocols. ............................ 146 Figure 6.32: Number of initiated bundle transmissions as function of bundles TTL in a scenario with 200 vehicles for First Contact, Direct Delivery, Epidemic, Binary and Source Spray and Wait, PRoPHET, GeOpps, and GeoSpray routing protocols. ............................ 146 Figure 6.33: Number of dropped bundles as function of bundles TTL in a scenario with 100 vehicles for First Contact, Direct Delivery, Epidemic, Binary and Source Spray and Wait, PRoPHET, GeOpps, and GeoSpray routing protocols.......................................... 147 Figure 6.34: Number of dropped bundles as function of bundles TTL in a scenario with 200 vehicles for First Contact, Direct Delivery, Epidemic, Binary and Source Spray and Wait, PRoPHET, GeOpps, and GeoSpray routing protocols.......................................... 147 Figure 6.35: Bundle delivery probability as function of bundles TTL in a scenario with 100 vehicles for First Contact, Direct Delivery, Epidemic, Binary and Source Spray and Wait, PRoPHET, GeOpps, and GeoSpray routing protocols.......................................... 148 Figure 6.36: Bundle delivery probability as function of bundles TTL in a scenario with 200 vehicles for First Contact, Direct Delivery, Epidemic, Binary and Source Spray and Wait, PRoPHET, GeOpps, and GeoSpray routing protocols.......................................... 149 Figure 6.37: Bundle average delivery delay as function of bundles TTL in a scenario with 100 vehicles for First Contact, Direct Delivery, Epidemic, Binary and Source Spray and Wait, PRoPHET, GeOpps, and GeoSpray routing protocols.......................................... 150 Figure 6.38: Bundle average delivery delay as function of bundles TTL in a scenario with 200 vehicles for First Contact, Direct Delivery, Epidemic, Binary and Source Spray and Wait, PRoPHET, GeOpps, and GeoSpray routing protocols.......................................... 150 Figure 6.39: Overhead ratio as function of bundles TTL in a scenario with 100 vehicles for First Contact, Direct Delivery, Epidemic, Binary and Source Spray and Wait, PRoPHET, GeOpps, and GeoSpray routing protocols. ..................................................... 151 . xviii.
(19) List of Figures. Figure 6.40: Overhead ratio as function of bundles TTL in a scenario with 200 vehicles for First Contact, Direct Delivery, Epidemic, Binary and Source Spray and Wait, PRoPHET, GeOpps, and GeoSpray routing protocols....................................................... 151 Figure 6.41: Average hop count as function of bundles TTL in a scenario with 100 vehicles for First Contact, Direct Delivery, Epidemic, Binary and Source Spray and Wait, PRoPHET, GeOpps, and GeoSpray routing protocols....................................................... 152 Figure 6.42: Average hop count as function of bundles TTL in a scenario with 200 vehicles for First Contact, Direct Delivery, Epidemic, Binary and Source Spray and Wait, PRoPHET, GeOpps, and GeoSpray routing protocols....................................................... 152 Figure 6.43: Average buffer time as function of bundles TTL in a scenario with 100 vehicles for First Contact, Direct Delivery, Epidemic, Binary and Source Spray and Wait, PRoPHET, GeOpps, and GeoSpray routing protocols....................................................... 153 Figure 6.44: Average buffer time as function of bundles TTL in a scenario with 200 vehicles for First Contact, Direct Delivery, Epidemic, Binary and Source Spray and Wait, PRoPHET, GeOpps, and GeoSpray routing protocols....................................................... 154 Figure 6.45: Photos of the VDTN@Lab testbed under experiments............................... 155 Figure 6.46: Bundle delivery probability as function of bundles size for First Contact, Direct Delivery, Epidemic, Spray and Wait, and PRoPHET routing protocols. .................... 156 Figure 6.47: Bundle average delivery delay as function of bundles size for First Contact, Direct Delivery, Epidemic, Spray and Wait, and PRoPHET routing protocols. ............ 156 Figure 6.48: Number of dropped bundles as function of bundles size for First Contact, Direct Delivery, Epidemic, Spray and Wait, and PRoPHET routing protocols. .................... 157 Figure 6.49: Bundle delivery probability as function of bundles TTL for First Contact, Direct Delivery, Epidemic, Spray and Wait, and PRoPHET routing protocols. .................... 158 Figure 6.50: Bundle average delivery delay as function of bundles TTL for First Contact, Direct Delivery, Epidemic, Spray and Wait, and PRoPHET routing protocols. .................... 158 Figure 6.51: Number of dropped bundles as function of bundles TTL for First Contact, Direct Delivery, Epidemic, Spray and Wait, and PRoPHET routing protocols. .................... 159 . xix.
(20) List of Figures. xx.
(21) List of Tables List of Tables Table 2.1: Main differences between the assumptions of traditional and delay-tolerant networks. ..............................................................................................18 Table 6.1: Combined scheduling and dropping policies. ........................................... 130 . xxi.
(22) List of Tables. xxii.
(23) Acronyms and Abbreviations Acronyms and Abbreviations AHS. Advanced Cruise-Assist Highway Systems. AHSRA. Advanced Cruise-Assist Highway System Research Association. ARQ. Automatic Repeat-reQuest. BAD. Bundle Aggregation and De-aggregation layer. BSC. Bundle Signaling Control layer. C-ARQ. Cooperative ARQ. C2C. Car to Car. C2I. Car to Infrastructure. CB. Control Bundle. CONDOR. Command-Control, On-the-Move, Network, Digital, Over-the-horizon Relay. CoS. Classes of Service. CP. Contact Prediction algorithm. CST. Custom Service Time. CTP. Cabernet Transport Protocol. DARPA. Defense Advanced Research Projects Agency. DB. Data Bundle. DC-ARQ. Delayed Cooperative ARQ. DRIVE. DemonstRator for Intelligent Vehicular Environments. DSCP. Differentiated Services Code Point. DSRC. Dedicated Short Range Communications. DTN. Delay and Disruption Tolerant Network. DTNRG. DTN Research Group. ETA. Estimate the Time of Arrival. EUCAR. European Council for Automotive R&D. FIFO. First In, First Out. GB. Gigabyte. GIS. Geographic Information System. GPS. Global Positioning System. GUI. Graphical User Interface. ICT. Information Communities Technologies. IEEE. Institute of Electrical and Electronics Engineers. ILP. Integer Linear Programming. IP. Internet Protocol. IPN. Interplanetary networking. IRTF. Internet Research Task Force. ISO. International Organization for Standardization. IT. Instituto de Telecomunicações. xxiii.
(24) Acronyms and Abbreviations. ITS. Intelligent Transportation Systems. KB. Kilobyte. km/h. kilometre per hour. LIFO. Last In First Out. MAC. Media Access Control. MANET. Mobile Ad hoc NETwork. MB. Megabyte. MBM. random Map-Mased Movement. Mbps. Megabits per second. METD. Minimum Estimated Time of Delivery. MTU. Maximum Transmission Unit. N4C. Networking for Communications Challenged Communities. NETGNA. Next Generation Networks and Applications research group. NOW. Network On Wheels. NP. Nearest Point. OBS. Optical Burst Switching. ONE. Opportunistic Network Environment simulator. OSI. Open Systems Interconnection. PATH. California Partners for Advanced Transit and Highways. PDA. Portable Digital Assistant. PDU. Protocol Data Unit. PG. Priority Greedy. PHY. Physical. PoI. Point of Interest. PRECIOSA. Privacy Enabled Capability In Co-operative Systems and Safety Applications. QoS. Quality of Service. RC. Replicated Copies. RC ASC. Replicated Copies Ascending Order. RC DESC. Replicated Copies Descending Order. RFC. Request for Comments. RL. Remaining Lifetime. RL ASC. Remaining Lifetime Ascending Order. RL DESC. Remaining Lifetime Descending Order. RMBM. Routed Map-Based Movement. RSU. RoadSide infrastructure Units. RTT. Round-Trip Time. SNC. Saami Network Connectivity. SPMBM. Shortest Path Map-Based Movement. TCP. Transmission Control Protocol. TFT. Tit-For-Tat. xxiv.
(25) Acronyms and Abbreviations. TOS. Type Of Service. TTL. Time To Live. UBI. University of Beira Interior. UDP. User Datagram Protocol. UML. Unified Modeling Language. V2I. Vehicle-to-Infrastructure. V2R. Vehicle-to-Roadside. V2V. Vehicle-to-Vehicle. VANET. Vehicular Ad hoc NETwork. VDTN. Vehicular Delay-Tolerant Network. VSAT. Very Small Aperture Terminal. VTP. Vehicle Transmission Protocol. VWBS. Vehicular Wireless Burst Switching Network. WAVE. Wireless Access in Vehicular Environments. WLAN. Wireless Local Area Network. WSN. Wireless Sensor Network. xxv.
(26) Acronyms and Abbreviations. xxvi.
(27) Extended Abstract in Portuguese Extended Abstract in Portuguese O presente resumo alargado em língua portuguesa sintetiza a tese de Doutoramento intitulada “Avaliação do Desempenho de Redes Veiculares com Ligações Intermitentes” (Performance Assessment of Vehicular Delay-Tolerant Networks). Começa-se por enumerar os objectivos e referir as principais contribuições desta investigação. Depois são sintetizadas as principais conclusões e apontadas direcções para trabalho futuro.. Definição do Problema e Objectivos As redes veiculares são definidas na literatura [1-3] como redes espontâneas e autoorganizadas, onde veículos equipados com dispositivos de comunicação sem fios de curto ou médio alcance, cooperam entre si para permitir a comunicação entre veículos e a comunicação entre veículos e outros equipamentos de infra-estrutura localizados junto às estradas. Os nós destas redes podem estar localizados em linha de vista ou fora do alcance de comunicação se for estabelecida uma rede através de múltiplos saltos entre diversos nós. Em termos de investigação, constata-se que os primeiros esforços na área das redes veiculares remontam aos anos 80 [4]. No entanto, esta área de investigação foi impulsionada por volta do ano de 2000 com o desenvolvimento das tecnologias de comunicação sem fios [5]. Recentemente, tem-se vindo a evidenciar um forte contributo e interesse nesta área por parte de governos, da indústria e de comunidades de investigação. Os fabricantes de automóveis estão já a trabalhar no desenvolvimento de protótipos de veículos dotados de sistemas computacionais, sensores, e interfaces de comunicação sem fios [6-8]. Assim, prevêse que as redes veiculares virão muito provavelmente a ser implementadas num futuro próximo. Uma das razões principais para o crescente interesse nestas redes está relacionada com a sua potencial utilização numa ampla gama de aplicações com impacto na vida quotidiana [1, 9], das quais se destacam, entre muitas outras, as seguintes. As redes veiculares são consideradas uma tecnologia fundamental para a melhoria da segurança rodoviária, podendo ajudar os condutores a evitar acidentes, ou evitar colisões em cadeia após a ocorrência de um acidente. A comunicação veicular pode ser de grande utilidade na melhoria da eficiência dos sistemas de transporte, podendo contribuir para optimizar os fluxos de tráfego e a capacidade das estradas. As redes veiculares também podem ser utilizadas para recolher e transmitir os dados capturados por uma rede de sensores sem fios, por exemplo referentes a condições climatéricas ou medições de poluição. Outros exemplos de aplicações previstas para estas redes, incluem aplicações comerciais (p. ex. para divulgação de anúncios, de informações turísticas e de lazer, e disponibilidade de espaço de estacionamento) e. xxvii.
(28) Extended Abstract in Portuguese. aplicações de entretenimento (p. ex. permitindo o acesso à Internet e partilha de conteúdos de multimédia). As redes veiculares poderão ser particularmente importantes em regiões remotas ou comunidades rurais em países subdesenvolvidos, que não dispõem de qualquer tipo de meio de comunicação convencional de acesso à Internet, permitindo um conjunto diversificado de serviços (p. ex. transferência de ficheiros, correio electrónico, acesso à Web baseado em mecanismos de cache e aplicações de telemedicina e monitorização à distância). Estas redes podem ainda revelar-se muito úteis num cenário de catástrofe natural (p. ex. um terramoto, inundação ou incêndio), quando as infra-estruturas de rede tradicionais são destruídas ou largamente afectadas, permitindo apoiar a comunicação entre equipas de resgate e outros serviços de emergência. No entanto, para que estas aplicações se tornem uma realidade, é fundamental encontrar soluções para uma série de inúmeros problemas e desafios técnicos que caracterizam estas redes. Alguns desses desafios são comuns a outras redes sem fios, enquanto outros são colocados pelas características particulares das redes veiculares. De acordo com [2, 3, 10-12], a maioria dos problemas é causada pela mobilidade e a velocidade dos veículos, a qual é responsável por uma topologia de rede altamente dinâmica e tempos de contacto entre nós da rede de duração reduzida. A estes problemas acrescentam-se as limitações no alcance da transmissão, os problemas de propagação causados por obstáculos (tais como edifícios, túneis, terreno e vegetação) e as interferências. Em conjunto, estes problemas tornam estas redes susceptíveis a problemas de conectividade intermitente e divisão/partição da rede, resultando na impossibilidade frequente de estabelecer uma ligação extremo-a-extremo entre a origem e o destino para a comunicação de dados. Além disso, destaca-se que a densidade de nós nestas redes pode ser altamente variável. Por exemplo, uma rede veicular pode ser classificada como sendo densa num engarrafamento, enquanto que no tráfego suburbano pode ser esparsa, ou até mesmo extremamente esparsa em zonas rurais/remotas. Dada a grande abrangência dos tópicos de investigação nestas redes, considerou-se adequado focar a investigação apresentada nesta tese nas questões inerentes à disseminação de dados e encaminhamento de dados. Estes tópicos haviam merecido uma atenção considerável por parte da comunidade científica à data de inicio desta investigação, Setembro de 2007. No entanto, a maioria dos estudos publicados considerava habitualmente cenários de autoestradas e ruas citadinas, caracterizados por uma alta densidade de nós ou até mesmo redes totalmente conectadas. Os protocolos de encaminhamento propostos na literatura para estas redes, designadas de redes veiculares ad-hoc (vehicular ad-hoc networks (VANET)) [1-3, 9, 13-15], assumem a existência de uma ligação extremo-a-extremo entre o emissor e o receptor de dados [16, 17]. Desta forma, estes protocolos apresentam como grande limitação a incapacidade de lidar com ligações intermitentes, com a frequente desconexão da rede (partições da rede) e atrasos longos ou variáveis [2], [3], [18], [19], [20]. Tais situações são. xxviii.
(29) Extended Abstract in Portuguese. muito comuns em cenários urbanos ou rurais caracterizados por densidades de nós moderadas ou reduzidas, e pouca ou nenhuma infra-estrutura de rede fixa disponível. A. arquitectura. de. rede. delay/disruption-tolerant. proposta networks. para (DTN). redes [21],. com e. ligações. inicialmente. intermitentes, aplicada. às. ditas redes. interplanetárias, foi entretanto considerada como uma solução para resolver estes problemas, dando origem a uma nova abordagem para as redes veiculares designada por redes veiculares ad-hoc baseadas em DTNs [10, 11, 22-26]. A arquitectura DTN propõe a introdução de uma camada protocolar, sobre a camada de “transporte”, segundo o modelo de referência OSI [27, 28], designada por camada de “agregação” (“bundle layer”). Esta camada pretende criar uma rede “overlay”, permitindo a interligação de redes altamente heterogéneas (p. ex. uma rede interplanetária ou uma rede de sensores) através de um paradigma de comutação assíncrona de mensagens. Segundo este paradigma, as mensagens também designadas por agregados (“bundles”) são armazenadas (em memória persistente) e enviadas assincronamente nó a nó, desde a origem até o destino [29]. Considera-se que as mensagens têm tamanho variável e representam agregados de dados vindos da camada de “aplicação”, segundo o modelo de referência OSI. A arquitectura DTN oferece uma solução promissora para melhorar o desempenho do encaminhamento. e. da. disseminação. de. dados. em. redes. veiculares. desconectadas/intermitentes e oportunísticas, a qual tem recebido uma atenção crescente nos últimos anos. A utilização deste paradigma permite que o tráfego de dados de uma variedade de aplicações veiculares tolerantes ao atraso e à perda de alguns dados, seja encaminhado ao longo do tempo, explorando-se o movimento físico dos veículos e os contactos oportunísticos estabelecidos entre estes e com outros nós da rede. Contudo, esta solução afasta-se do modelo Internet caracterizado pela utilização do protocolo Internet (IP) [30] extremo-a-extremo em vez do “bundling” das DTNs [31]. Os benefícios de manter a semântica de comunicação IP extremo-a-extremo são evidentes, uma vez que facilita a interoperabilidade com as redes existentes e com algumas aplicações da Internet. Além disso, não são necessários gateways de conversão protocolar. Pode ainda observar-se que o IP em si oferece um mecanismo de entrega assíncrona de datagramas, e que a entrega de datagramas IP pode ser adiada se as aplicações envolvidas tolerarem atrasos elevados e comunicações assíncronas [32]. Desta forma, poderá combinar-se a utilização de protocolos UDP [33] ou baseados em UDP nas camadas superiores, com a resolução das questões inerentes à intermitência e desconexão abaixo da camada de “rede” segundo o modelo de referência OSI. O trabalho apresentado nesta tese é motivado pela necessidade de encontrar novas soluções para os problemas de comunicação decorrentes de cenários de redes veiculares desconectadas/intermitentes e oportunísticas. O principal objectivo deste trabalho é. xxix.
(30) Extended Abstract in Portuguese. apresentar a proposta de uma nova arquitectura de camadas para redes veiculares, designadas de redes veiculares com ligações intermitentes, ditas vehicular delay-tolerant networks (VDTN), incluindo a definição dos elementos/nós da rede. Para além disso, apresenta-se um estudo do desempenho desta arquitectura de rede e respectivos protocolos, algoritmos e serviços, analisando-se a sua aplicação em diferentes cenários. Para atingir este objectivo principal, foram identificados os seguintes objectivos intermédios: •. Proposta de uma arquitectura de camadas para redes veiculares, designadas de redes veiculares com ligações intermitentes (ditas vehicular delay-tolerant networks (VDTN)), compostas por diferentes tipos de nós com funções e capacidades distintas;. •. Proposta e criação de uma ferramenta de simulação para redes VDTN para apoio ao desenvolvimento, experimentação e avaliação de desempenho de protocolos, algoritmos e serviços;. •. Proposta e construção de um protótipo (ou demonstrador) laboratorial para redes VDTN para demonstrar estas redes e verificar experimentalmente as melhores soluções obtidas nos estudos realizados por simulação, ficando também disponível para permitir a realização de novos estudos;. •. Estudo do impacto dos nós fixos de relay, da densidade de nós e dos modelos de mobilidade, e das restrições de armazenamento, no desempenho de protocolos de encaminhamento populares em redes DTN (Epidemic, Spray and Wait, PRoPHET, e MaxProp) aplicados a VDTNs;. •. Estudo do impacto da utilização de informação de localização de nós no desempenho das redes VDTN;. •. Estudo do efeito do nível de cooperação dos nós no desempenho das redes VDTN;. •. Estudo do impacto de politicas de escalonamento e de politicas de descarte, com base ou não em prioridades, no desempenho das redes VDTN;. •. Proposta e estudo do desempenho de um novo protocolo de encaminhamento para redes VDTN.. Principais Contribuições Esta secção é dedicada às principais contribuições científicas da presente tese. Neste sentido, os próximos parágrafos descrevem, na opinião do autor, as principais contribuições para o avanço do estado da arte na área das redes veiculares com ligações intermitentes. A primeira contribuição desta tese é uma análise detalhada e compreensiva do estado da arte relacionado com as redes veiculares e as redes com ligações intermitentes (redes DTN), a qual é apresentada no Capítulo 2. Uma versão resumida desta análise foi apresentada na 10ª. xxx.
(31) Extended Abstract in Portuguese. Conferência sobre Redes de Computadores (CRC 2010) [34]. Um artigo de análise com uma visão e discussão das abordagens actuais e mais representativas às redes veiculares e dos desafios identificados nesta área de investigação foi aceite para publicação na revista IEEE Communications Surveys & Tutorials Journal [35]. A segunda contribuição é a proposta inovadora de uma arquitectura organizada em camadas para redes veiculares com ligações intermitentes (vehicular delay-tolerant networks (VDTN)), baseada nos seguintes princípios: i) comunicação orientada à transmissão de agregados de datagramas; ii) paradigma baseado no “armazenamento, transporte e envio de agregados”; e iii) separação do plano de controlo e do plano de dados, utilizando sinalização fora-de-banda (“out-of-band signaling”). Esta proposta é apresentada na Secção 3.2. Uma proposta inicial com vista à especificação da arquitectura VDTN foi apresentada no 3rd IEEE Workshop on Automotive Networking and Applications (Autonet 2008), que fez parte da IEEE GLOBECOM 2008 [36]. A proposta da arquitectura de camadas VDTN foi apresentada no Fourteenth IEEE Symposium on Computers and Communications (ISCC 2009) [37]. Estes trabalhos conduziram a um pedido de patente Portuguesa para a arquitectura VDTN e respectivo método de transmissão de dados. Este pedido de patente intitula-se “Método de transmissão de dados em redes veiculares com ligações intermitentes” [38] e foi publicado em 27 de Outubro de 2010. Considera-se também relevante, neste contexto, a publicação dos principais resultados do NoE Euro-NF Specific Joint Research Project VDTN, apresentada na 7th Euro-NF Conference on Next Generation Internet (NGI 2011) [39]. A terceira contribuição é a proposta e implementação de uma ferramenta de simulação para redes veiculares com ligações intermitentes, denominada VDTNsim, que é descrita na Secção 4.2. Esta ferramenta de simulação foi apresentada no 15th IEEE International Workshop on Computer-Aided Modeling Analysis and Design of Communication Links and Networks (IEEE CAMAD 2010) [40]. A quarta contribuição é a proposta e implementação de uma testbed laboratorial para redes veiculares com ligações intermitentes, designada VDTN@Lab, a qual é apresentada na Secção 4.3. Uma versão preliminar deste protótipo foi apresentada na 5.ª Conferência de Engenharia (Engenharia'2009) - Inovação e Desenvolvimento [41]. Uma versão mais avançada da testbed foi utilizada num conjunto de estudos subsequentes apresentados na 8th Conference on Telecommunications (CONFTELE 2011) [42], na 2011 IEEE International Conference on Communications (IEEE ICC 2011) [43], e na 16th IEEE International Workshop on Computer Aided Modeling Analysis and Design of Communication Links and Networks (IEEE CAMAD 2011) [44]. A quinta contribuição é um estudo do impacto dos nós fixos de relay no desempenho de protocolos de encaminhamento populares em redes DTN aplicados a VDTNs, o qual é apresentado na Secção 5.3. Um primeiro estudo para avaliação de desempenho, considerando. xxxi.
(32) Extended Abstract in Portuguese. apenas um cenário de conectividade urbana, foi apresentado na 5th Euro-NGI Conference on Next Generation Internet Networks (NGI 2009) [45]. Uma versão estendida deste trabalho, apresentando estudos que consideram cenários de conectividade urbana e rural com áreas de diferentes dimensões, diferentes densidades de nós e modelos de mobilidade, foi publicado como capítulo do livro Mobile Opportunistic Networks: Architectures, Protocols and Applications [46], publicado pela CRC Press – Taylor & Francis Group. A sexta contribuição é uma análise da influência dos modelos de mobilidade e da densidade do número de nós móveis (veículos) no desempenho de protocolos de encaminhamento populares em redes DTN aplicados a uma rede VDTN num cenário de conectividade rural, a qual é apresentada na Secção 5.4. Uma versão preliminar deste estudo foi apresentada na 7th Conference on Telecommunications (CONFTELE 2009) [47]. Uma versão estendida deste trabalho foi seleccionado para publicação na revista International Journal of Mobile Network Design and Innovation (IJMNDI), Inderscience Publishers [48]. Esta versão estendida considerou diferentes modelos de mobilidade e diferentes densidades de nós, e analisou a variação dos parâmetros dos protocolos de encaminhamento com o objectivo de determinar o seu impacto no desempenho da rede. A sétima contribuição é um estudo que avalia o efeito causado pelas restrições ao nível da capacidade de armazenamento dos nós da rede, no desempenho de redes veiculares com ligações intermitentes. Este estudo, descrito na Secção 5.5, foi apresentado na Second International Conference on Communication Theory, Reliability, and Quality of Service (CTRQ 2009) [49]. Este trabalho recebeu o prémio de melhor artigo (“best paper award”) na conferência. A oitava contribuição é um estudo que analisa a utilização de informação de localização dos nós para prever a duração do tempo de contacto, por forma a melhorar o desempenho das redes VDTN. Este estudo, exposto na Secção 3.3 e avaliado na Secção 6.3, foi apresentado na 2010 IEEE International Conference on Communications (IEEE ICC 2010) [50]. A nona contribuição é uma análise da influência da cooperação dos nós da rede no desempenho de redes veiculares com ligações intermitentes, a qual é apresentada na Secção 6.4. Este trabalho foi seleccionado para publicação como capítulo do livro Cooperative Networking [51], publicado pela Wiley. A décima contribuição é uma análise do impacto das politicas de escalonamento e das politicas de descarte no desempenho das redes VDTN, a qual é apresentada na Secção 6.5. Uma versão preliminar deste estudo foi apresentado no Second International Workshop on Next Generation of Wireless and Mobile Networks (NGWMN-09), que fez parte da 38th. International Conference on Parallel Processing (ICPP-2009) [52]. Uma versão estendida deste artigo foi publicada na revista International Journal On Advances in Internet. xxxii.
(33) Extended Abstract in Portuguese. Technology, IARIA [53]. Esta versão estendida teve em conta um conjunto alargado de politicas de escalonamento e de politicas de descarte, as quais foram avaliadas em cenários com diferentes densidades de nós móveis movendo-se a diferentes velocidades. A décima primeira contribuição é um estudo da problemática do suporte de diferenciação de tráfego em redes VDTN, o qual é apresentado na Secção 3.4 e avaliado na Secção 6.6. Uma versão preliminar deste estudo foi apresentado na 17th International Conference on Software, Telecommunications and Computer Networks (SoftCOM 2009) [54]. Uma versão estendida deste trabalho foi aceite para publicação na revista Telecommunication Systems Journal, Springer [55]. Esta versão estendida teve em conta um conjunto alargado de mecanismos necessários à diferenciação de tráfego, nomeadamente, estratégias de gestão de buffers, politicas de escalonamento e de politicas de descarte. O desempenho destes mecanismos foi avaliado em cenários com diferentes densidades de nós móveis movendo-se a diferentes velocidades. A décima segunda contribuição é a proposta, especificação e avaliação do desempenho de um novo protocolo de encaminhamento geográfico para redes VDTN, intitulado de GeoSpray, que é apresentado na Secção 3.5 e avaliado na Secção 6.7. Esta contribuição foi aceite para publicação na revista Information Fusion Journal, Elsevier [56].. Conclusões e Sugestões para Trabalho Futuro Ao longo da presente tese foi estudado o desempenho de redes veiculares com ligações intermitentes (redes VDTN). Este ponto apresenta uma síntese da tese e aponta algumas direcções para trabalho futuro. Após a apresentação e delimitação do tema da tese, descrevendo-se os seus objectivos e as suas principais contribuições, foram descritos os principais aspectos das redes veiculares e das redes com ligações intermitentes (redes DTN). Neste ponto começou-se por apresentar um sumário das principais aplicações das redes veiculares e de projectos de investigação relacionados com estas redes. Depois, o trabalho centrou-se na apresentação da arquitectura/tecnologia das redes veiculares ad-hoc, ditas vehicular ad-hoc networks (VANET), prestando-se especial atenção à discussão das limitações das estratégias usuais de disseminação de dados e de encaminhamento propostas na literatura para estas redes. Estas limitações motivaram a introdução dos conceitos da arquitectura de rede proposta para redes com ligações intermitentes nas redes VANET. No que diz respeito às DTNs, foi descrita a arquitectura proposta para estas redes. Vários tópicos de investigação em DTNs foram também apresentados e discutidos, nomeadamente, cenários de aplicação, protocolos de encaminhamento, nós fixos de relay, cooperação e disciplinas de filas (politicas de escalonamento e politicas de descarte).. xxxiii.
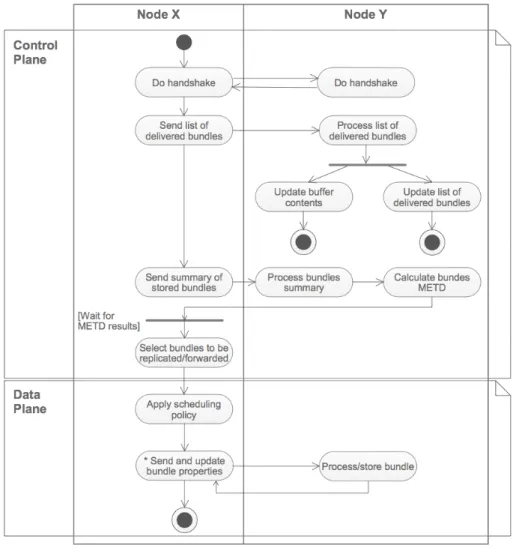
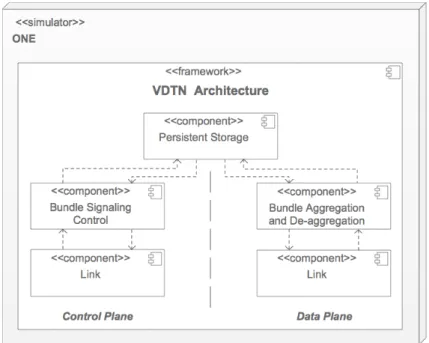
(34) Extended Abstract in Portuguese. Em seguida, foi apresentada a proposta de uma arquitectura organizada em camadas para comunicações veiculares em redes esparsas/particionadas e oportunisticas, designadas de redes veiculares com ligações intermitentes (redes VDTN). A arquitectura de rede VDTN apenas partilha em comum com a arquitectura DTN a assumpção de comunicação de dados assíncrona, baseada no paradigma de “armazenamento, transporte e envio de mensagens”. Porém, distancia-se da abordagem muito abrangente da arquitectura DTN, posicionando a camada de “agregação” entre a camada de “rede” e a camada de “ligação de dados” segundo o modelo de referência OSI. Desta forma, os datagramas (p. ex. pacotes do Internet protocol - IP) com características comuns (p. ex. mesmo destinatário) são agrupados numa unidade protocolar de dados designada também de “agregado” (“bundle”). A arquitectura VDTN também introduz o conceito de separação entre o plano de controlo e o plano de dados, com recurso a sinalização fora-de-banda (“out-of-band signaling”). Este conceito, permite que o método de transmissão de dados utilizado nas redes VDTN, utilize um conjunto de mensagens de sinalização enviadas a priori (no plano de controlo), para efectuar a reserva de recursos disponíveis nos nós da rede para a (eventual) posterior transmissão dos agregados (no plano de dados). Inclusivamente, é possível utilizar diferentes tecnologias de transmissão de dados para cada um dos planos. Neste ponto, foram definidas as camadas propostas pela arquitectura VDTN e foram descritas e discutidas as características dos protocolos a implementar em cada uma delas. Depois, foi apresentada a proposta de um novo protocolo de encaminhamento geográfico para redes VDTN, designado por GeoSpray. Este protocolo de encaminhamento é baseado nos seguintes princípios: i) suporte a um paradigma de rede oportunística e entrega de agregados com base no paradigma de “armazenamento, transporte e envio de agregados”; ii) utilização de informação de localização geográfica disponibilizada por dispositivos para obtenção de posição, para auxiliar na tomada de decisões de encaminhamento; iii) utilização de um esquema de encaminhamento multi-cópia com um limite estrito no número de cópias criado por agregado, combinado com uma estratégia de forwarding com vista a melhorar a probabilidade de entrega dos agregados via rotas multi-salto; iv) libertação de espaço em buffer, relativo aos agregados que já foram entregues; v) optimização dos recursos utilizados na rede, incluindo armazenamento, largura de banda e energia; e vi) maximizar a probabilidade de entrega de agregados, minimizar o atraso na entrega de agregados e sobrecarga de recursos (“overhead”). Dadas as particularidades da arquitectura de rede VDTN, tornou-se necessário desenvolver uma ferramenta de simulação, designada por VDTNsim, para suportar trabalhos de investigação. relacionados. com. o. desenvolvimento,. experimentação. e. avaliação. de. desempenho de protocolos, algoritmos e serviços para estas redes. Esta ferramenta foi utilizada em todos os estudos de simulação apresentados nesta tese. Apresentou-se ainda uma testbed laboratorial (protótipo) para redes VDTN, designada por VDTN@Lab. Esta testbed. xxxiv.
Imagem
+7
Documentos relacionados