www.scielo.br/rbg
MORPHOLOGICAL AND SEDIMENTARY CHARACTERIZATION THROUGH ANALYSIS
OF MULTIBEAM DATA AT DECEPTION ISLAND, ANTARCTIC
Filipe Japiass´u Leit˜ao, Arthur Ayres Neto and Rosemary Vieira
ABSTRACT.Multibeam sonar systems have transformed the area of underwater geoacoustics and present an important tool for seabed characterization. This work aims to demonstrate the processing and interpretation of multibeam bathymetric data, supported by geological samples collected in the area of Deception Island, South Shetland Islands – Antarctic, for morphological and sedimentary characterization for the seabed. Data were collected during the commission OPERANTAR XXXII, totaling 28 bathymetric lines and 4 geological surface samples using a Box-Corer sampler. By analyzing the maps, digital terrain models and morphological profiles generated for the area, we identified ravines, a depression and a volcanic structure as important characteristics of the morphology of the region. The seabed of Deception Island is predominantly composed of mud with high concentrations of silt grains. This characterization was performed by analyzing the backscattering mosaic and signal intensities for the area, together with the interpretation of geological characteristics of the collected samples.
Keywords: bathymetry, seabed, marine geology, underwater geoacoustic.
RESUMO.Sonares multifeixe tˆem transformado a ´area de geoac´ustica submarina e se apresentado como uma ferramenta importante para a caracterizac¸˜ao do fundo marinho. Este trabalho consiste na demonstrac¸˜ao do processamento e interpretac¸˜ao de dados batim´etricos, suportados por amostragens geol´ogicas, coletados na regi˜ao da ilha de Deception, Ilhas Shetland do Sul – Ant´artica, apresentando assim uma caracterizac¸˜ao morfol´ogica e sedimentar do fundo marinho mais consistente. Os dados foram coletados durante a comiss˜ao OPERANTAR XXXII, totalizando 28 linhas batim´etricas e 4 amostras geol´ogicas de superf´ıcie utilizando-se um amostrador tipo Box-Corer. Pela an´alise dos mapas, modelos digitais de terreno e perfis morfol´ogicos gerados para a ´area, identificaram-se ravinas, uma depress˜ao e uma estrutura em cone vulcˆanico como caracter´ısticas importantes da morfologia da regi˜ao. O fundo marinho da ilha de Deception ´e constitu´ıdo predominantemente por um sedimento lamoso com alta concentrac¸˜ao de silte. Essa caracterizac¸˜ao foi feita pela an´alise do mosaico de retroespalhamento (backscatter) para a ´area, e pelo processamento dos dados do sinal de retorno em conjunto com a interpretac¸˜ao das caracter´ısticas das amostras geol´ogicas coletadas.
Palavras-chave: batimetria, fundo marinho, geologia marinha, geoac´ustica submarina.
Universidade Federal Fluminense (UFF), Lagemar, Av. General Milton Tavares de Souza, s/n, Gragoat´a, 24310-346 Niter´oi, RJ, Brazil. Phone: +55(21) 2629-5920; Fax: +55(21) 2629-5931 – E-mails: [email protected]; [email protected]; [email protected]
When using a multibeam echo sounder in order to obtain in-formation about the seabed characteristics, backscattering data is acquired. Backscatter intensity is essentially a function of the seafloor’s physical properties, namely acoustic impedance, roughness (grain-size and small-scale topography) and volume inhomogeneity (variability in the thin layer of sediment penetrated by the acoustic signal) (Hewitt et al., 2013).
A signal generated by an echo sounder is affected by dif-ferent factors and it may be natural, electronic or anthropogenic noises. Other non-seabed influences on echoes are water depth and seabed slope. Echo durations increase with depth and seabed slope lengthens and distorts echoes (Preston et al., 2007).
Supported by multibeam sonar data acquired during a com-mission of the Brazilian Navy, this paper aims to demonstrate the processing and interpretation of bathymetric data, thus presenting the morphological and sedimentary characterization to the studied area, given its importance to vessels that sail close to the island. This work is motivated on the fact that acoustic classification of the seabed using multibeam sonars is extremely important these days in the context of underwater engineering, and investments in this area tend to increase in the near future.
Previous Studies
Reson SeaBat 8125 backscatter data as a tool for seabed characterization (Central Mediterranean, South-ern Italy): Results from different processing approaches
Innangi et al. (2014)
This previous study aimed to show two different processing ap-proaches, and discuss the produced output. The authors evalu-ated the capability of Multi-Beam Echo Sounder (MBES) system data to distinguish different seabed types in a site in the Tyrrhe-nian Sea (Mediterranean) which the dataset included bathymetric data and backscatter intensity, with the support of sediment sam-ples acquired and scuba investigations. The acoustic response of identified facies was statistically analyzed and characterized com-posing mosaics. At each sampled location, the gray-scale pixel
Sounder (MBES) backscatter data with visual data mining
Ahmed & Demsar (2013)
This paper examines the complexity of one of most com-monly used classification approaches and suggests an alternative where feature dataset is optimised in terms of dimensionality us-ing computational and visual data minus-ing. Both the original and the optimised method are tested on a MBES backscatter dataset and validated against ground truth. The study found that the op-timised method improves accuracy of classification and reduced complexity of processing. This is an encouraging result, which shows that bringing together methods from acoustic classifica-tion, visual data mining, spatial analysis and remote sensing can support the unprecedented increases in data volumes collected by contemporary acoustic sensors.
STUDIED AREA
The area under investigation is the Deception Island (Fig. 1) and it is located northwest of the Antarctic Peninsula. The Deception Island is an important structure which composes the South Shet-land IsShet-lands set and it plays a significant role for the nearby area. Its bay is used as a shelter for the sake of ship safety when there are no conditions of navigation in the region, thus making extremely necessary to determine local depths with precision.
According to Mart´ı et al. (2013), the Deception Island is the most active volcano that composes the arc of volcanic is-lands associated with the rift axis of the Bransfield Strait, being formed during the late Mesozoic-Cenozoic. The Bransfield Basin, a 500 km long and 100 km wide extensional structure, is consid-ered a back-arc basin developed since the Pliocene and associ-ated with subduction of the former Phoenix Plate below the South Shetland Islands (Dalziel, 1984).
Deception Island is a large composite volcano which has a single and large central vent within the region best known as Port Foster. The volcano is still active and there is no reason to doubt that this activity will continue (Shultz, 1970). The island is
com-Figure 1 – Location of the Deception Island, composing the South Shetland Islands set, in the northwest of the Antarctic Peninsula.
posed predominantly of pyroclastics, with only minor amounts of highly viscous lavas, and most of the island is covered with glacial ice, cindery scree, or fluvioglacial material (Shultz, 1970). Hawkes (1961) subdivided the volcanics into a Pre-Caldera and a Post-Caldera Series, each consisting of several formations. His correlations were done on the basis of stratigraphic sequence, and geomorphic and petrographic similarity (Shultz, 1970).
Moreover, as said by Mart´ı et al. (1996), the Deception Island has traditionally been considered as a collapsed caldera formed by subsidence into a magma chamber of a group of overlapping volcanoes along arcuate and radial faults. In fact, the morpholog-ical features of Deception Island (horseshoe shape, location of post-caldera vents apparently along concentric faults, existence of a depression in the centre of the island, concentration of post-caldera activity along the ‘ring fault’, etc.) support this idea.
Eruptions in the Deception Island are known to have taken place in 1842, 1967, 1969 and the last one in 1970 (Mart´ı et al., 1996). According to Orheim (1970), subglacial eruptions in 1969 opened a series of fissures 30-60 meters deep through glaciers on the east side of the island. The fissures were formed by a com-bination of subglacial melting, ejection of blocks of ice, lifting of the downslope portion of the glaciers, and lateral enlargement by horizontal ablation.
Smellie (2002) said that the centre of Deception Island, Port Foster, is a flooded restless caldera which have been formed by an eruption which may have ejected more than 25 to 30 km3of magma, but all post-caldera eruptions appear to have been small volume (typically less than 0.05 km3of magma).
MULTIBEAM SONAR SYSTEM
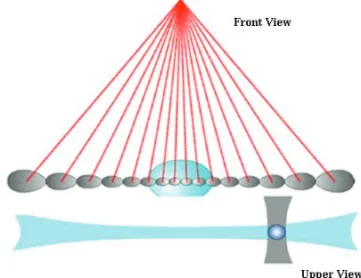
Multibeam sonars provide us with coincident measurements of depth and acoustic backscatter over a large swath of the seafloor and thus offer a promising tool for seafloor characterization (Fonseca & Mayer, 2007). Figure 2 represents the geometric
arrangement of a multibeam system. The central beams represent the most accurate data if compared with the outer beams, and it happens due to the angle of incidence relative to the seabed. The central ones have a lower incidence angle and then not so much signal is lost in comparison with the outer beams. Moreover, the footprints of the central beams are smaller, resulting in less in-coherent reflections. The light and dark blue area represents the region insonified by the beams (footprint). The points with smaller footprint and incidence angle are the most reliable acquired data.
Figure 2 – Geometric arrangement of a multibeam sonar system. Modified of USACE (2001).
The acoustic backscatter returned to multibeam sonar is the result of a complex interaction of the acoustic wavefront with an often rough and inhomogeneous seafloor. The wavefront from a typical multibeam sonar system usually intersects the seafloor at an angle, and is subject to scattering, which redistributes the in-cident acoustic energy in multiple directions. The nature of the energy returned to the transducer carries important information about the seafloor morphology and physical properties, providing valuable data to aid in the difficult task of seafloor characterization (de Moustier & Matsumoto, 1993; Hughes-Clark et al., 1997).
impedance contrast between the water column and the seafloor (MacLennan & Simmonds, 2005). The backscattered signal is in-fluenced by different characteristics such as seafloor irregularities, physical and chemical properties, or sedimentary forms as ripple marks and the texture of the rocks and even fauna over the seafloor (Pinho et al., 2011).
When using the intensity of the return signal to seafloor clas-sification, we must carry out analyzes of different features present along the backscatter. They are; the textural analysis (which pro-vides different parameters as energy, entropy, contrast and ho-mogeneity, from the information that composes the mosaic of backscattering signal); the probability density function analysis (which characterizes the roughness of the seafloor, describing the signal/noise ratio of the return signal and analyzing the rel-ative values for standard deviation. Higher standard deviation values represent less roughness on the seafloor); energy’s spec-trum analysis (uses the transform method of Fourier together with values for the backscatter signal intensities, representing certain variations in the topography and sediment) and angular analy-sis (which determines that the angle of incidence, of the acoustic signal wavefront on the seabed, influences the values of the re-sponses of backscatter intensities, which may hamper the sedi-ment characterization) (Conceic¸˜ao, 2009).
METHODOLOGY
The bathymetric data collected at Deception Island were acquired from October 2013 to April 2014. Data is part of a project best known as INCT-Criosfera. The following figure (Fig. 3) represents the 28 bathymetric lines acquired inside Port Foster, Deception Island.
The multibeam echo sounder used to the data acquisition was a Kongsberg SIMRAD EM-302 operating with a frequency range of 30 kHz coupled to the hull of the vessel. The data processing and interpretation was supported by several softwares. Caris Hips & Sips 9.0 was used to the bathymetric and backscattering data processing, Geosoft Oasis Montaj was used to generation,
visu-which were correlated to the sediment type of each sample. The previous figure (Fig. 3) shows the location of each sample.
RESULTS
The final bathymetry generated to the area is of good quality and allowed the analysis of different structures presented on the seabed of Port Foster. As part of the results, Figure 4 represents the map generated to the area. Depth values, represented by the isobaths contours of 5 meters and the scale on the right side of the map, and some seabed features as ravines, a depression and an elevated structure; which represents a volcanic structure, are the main information provided by the map.
Analyzing the digital terrain model generated at the end of the processing data step, we were able to set several profiles in order to make the morphological characterization of the studied area. The first profile (WNW-ESE), as can be seen on Figure 5, extends since the inlet of Port Foster to one of its extremities and shows that the deepest region within the area of the bay is 170 meters deep. By calculating using the software Google Earth, it was de-fined that the approximated area is about 36.9 km2. The WNW flank at Port Foster presents a very steep slope which must be showed up due to the historical intensive volcanic activity in the island, at the time the caldera was generated.
The bathymetry has indicated the presence of some underwa-ter ravines present in the cenunderwa-ter of the bay, over its south, east and west flanks, that should be originated either by the influence of thaw water as well as by the strong and historical volcanic ac-tivity of the region. Magrani (2011) describes that in glacial envi-ronments the ice and thaw water are the main agents of erosion, transportation and deposition of sediments. Moreover, by grav-ity, glaciers moves down gradient in the direction of the bottom of the bay.
Figure 6 represents profile 2 (NW-SE), which shows the mor-phology of the ravines, at the east flank of Port Foster. Those structures are in the deepest area of the Deception Island and its valleys present slightly vertical variations up to 2 meters deep.
Figure 3 – The multibeam and seismic lines acquired at Port Foster and location of the 3 geological samples acquired (red markers).
Figure 4 – Bathymetric map of Port Foster Bay, using tools of Geosoft Oasis Montaj.
This information reinforces the theory that those ravines were originated by the dragging of sediments at the bottom of the seabed by thaw water.
Profile 3 (W-E) (Fig. 7) shows a feature characterized as a de-pression which has a vertical variation up to 12 meters and 160
meters length at the south flank of Port Foster. The origin of this feature is unknown, but it may be associated to the collapse of the part of the seafloor during a volcanic event.
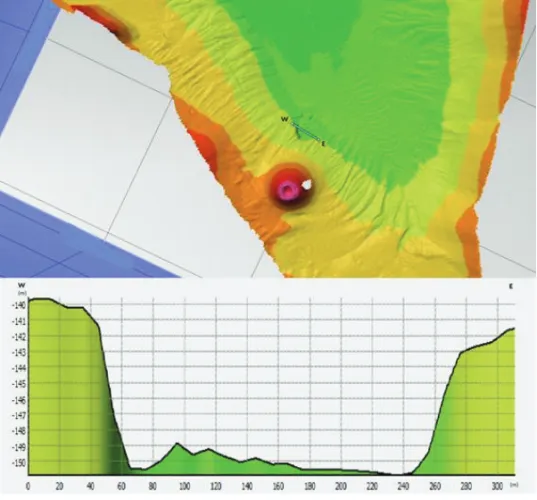
At last, to conclude the morphological characterization of Port Foster, profile 4 (W-E) (Fig. 8) shows the most interesting seafloor
Figure 5 – Profile 1 (WNW-ESE) along the entrance of Port Foster Bay.
Figure 7 – Profile 3 (W-E) characterizing a depression close to a inactive volcanic peak at Port Foster.
structure present at the bay. An elevated area representing a vol-canic structure localized at the south flank. The feature is 600 me-ters wide, presents a relative relief of 100 meme-ters and a depth of 30 meters deep and flanks presenting a slant of approximated 21.8 degrees.
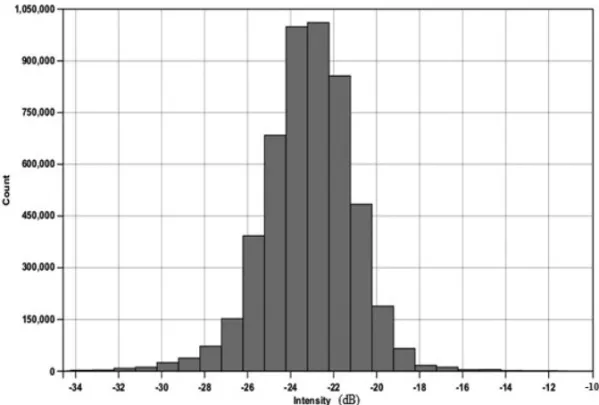
The final mosaic, generated to characterize the backscattering pattern of signal intensity responses, is shown on Figure 9. It is clear that the mosaic presents a homogeneity standard on the in-tensities distribution over the area. Furthermore, it was possible to analyze the values of the intensity responses using the histogram (Fig. 10), and it clearly shows the pattern of the intensity values.
Table 1 presents the average grain size distribution for each collected sample and values for mean grain size, mean P-wave velocity, mean density and mean acoustic impedance. These 4 last properties were provided by the Multisensor Core-Logger (MSCL). The values of P-wave velocity and density for the sam-ples present very similar values, which seems to be coherent because after analyzing the mean grain size and the values of backscattering intensity, we were able to characterize the area over a dominant type of sediment. It is observed that the seafloor has a very homogeneous grain size distribution, mainly composed of clayed-silt with very small amounts of sandy material. The Mean P-wave velocity and Mean Impedance to point 3 showed very low
values, which were not expected, and then, they were discarded from the table and not analyzed.
Table 1 – Grain size distribution and physical and acoustic properties for the 3 geological samples. There are no Vp and density measurements for Sample 3. Sample 1 Sample 2 Sample 3
Gravel (%) 0 0 0
Sand (%) 2 2 1
Clay (%) 13 14 13
Silt (%) 85 84 86
Mean grainsize (phi) 6.83 6.99 6.97
Mean P-wave velocity (m/s) 1532 1564 –
Mean density (gm/cc) 1.71 1.80 1.61
Mean impedance (N.s.m–3) 2631 2818 –
According to a mathematical-computed model quoted by Conceic¸˜ao (2009), the angular analysis of the grain size presents average values of backscatter intensity about –20 to –30 deci-bels (dB) for silt and, as shown on the histogram (Fig. 10), our responses for backscatter intensities are concentrated about –18 to –28 dB (mainly silt sediment). This was expected because the geological samples analysis showed us a homogeneity sedimen-tary distribution with most of the sediments composed of very fine silt, sedimentologically characterized as silty mud (Table 1).
Figure 8 – Profile 4 (W-E) detailing the volcanic structure located at the southern flank of Port Foster Bay.
Figure 10 – Histogram showing the distribution of the backscatter values.
However, looking at the mosaic, an important information is that the backscatter intensity is also standardized to the area of the location of the volcanic structure. So, it indicates that the struc-ture should be entirely covered by the silty sediment laid up at the bottom of the seabed.
CONCLUSION
The Port Foster is an asymmetric bay, with steepest flanks at the west side of the bay. The final bathymetric model for the area al-lowed the recognition of different morphological features at the seabed of the studied area associated to volcanic and glacial processes.
The acoustic characterization carried out after the process-ing and analysis of the backscatterprocess-ing signal indicated a very sedimentary homogeneity to the area. The geological samples acquired at the area endorse this interpretation, evidencing a seafloor essentially composed by silty sediment. The method could produce a highly detailed acoustic mosaic represent-ing backscatter intensities as well as presented by Innangi et al. (2014).
Therefore, the acoustic classification method combining multibeam sonar system with backscatter analysis and geological samples represents nowadays an efficient way to seabed recog-nition, obtaining information about seafloor’s morphological and sedimentary characteristics by a non-invasive tool.
REFERENCES
AHMED KI & DEMSAR U. 2013. Improving seabed classification from Multi-Beam Echo Sounder (MBES) backscatter data with visual data min-ing. Journal of Coastal Conservation, 17: 559–577. May 10.
BULLA L & HARTMANN C. 2009. Aplicac¸˜ao do QTC SIDEVIEW na classificac¸˜ao de sedimentos atrav´es de imagens de Sonar de Varredura Lateral, num trecho do canal de S˜ao Gonc¸alo, RS, Brazil. GRAVEL, 7(1): 19–30. July.
COLLINS WT & RHYNAS KP. 1998. Acoustic Seabed Classification Us-ing Echosounders: Operational Considerations and Strategies. Canadian Hydrographic Conference, Victoria – Canada, pp. 1–7.
CONCEIC¸˜AO FV. 2009. Utilizac¸˜ao do Backscatter de Sonares Multifeixe na Classificac¸˜ao Ac´ustica do Fundo Oceˆanico: Um Exemplo de Aplicac¸˜ao na Enseada de Martel, Ba´ıa do Almirantado, Pen´ınsula Ant´artica. Under-graduate Final Project, Geophysics, Universidade Federal Fluminense, Niter´oi, RJ, Brazil. 67 pp.
DALZIEL IW. 1984. Tectonic evolution of a Forearc Terrane, Southern Scotia Ridge, Antarctica. Geological Society of America Special Papers, 200, 32 pp.
DE MOUSTIER C & MATSUMOTO H. 1993. Seafloor acoustic remote sensing with multibeam echo-sounders and bathymetric sidescan sonar systems. Marine Geophysical Research, 15: 27–42.
FONSECA L & MAYER L. 2007. Remote Estimation of Surficial Seafloor Properties through the Application Angular Range Analysis to Multibeam Sonar Data. Marine Geophysical Researches, 28(2): 119–126. June.
ence Proceeding CP-45, Lerici, (pp. 243–250).
INNANGI S, BARRA M, DI MARTINO G, PARNUM I, TONIELLI R & MAZZOLA S. 2014. Reson SeaBat 8125 backscatter data as a tool for seabed characterization (Central Mediterranean, Southern Italy): Results from different processing approaches. Elsevier Applied Acoustics, 87: 109–122. July.
MacLENNAN D & SIMMONDS E. 2005. Fisheries Acoustics (5 ed., Vol. Fish and Fisheries Series). London: Springer. 317 pp.
MAGRANI FJ. 2011. Ecocar´ateres s´ısmicos e correlac¸˜ao sedimentar na margem continental do arquip´elago das Shetland do Sul, Ant´artica. Undergraduate Final Project, Geophysics, Universidade Federal Flumi-nense, Niter´oi, RJ, Brazil.
MART´I J, VILA J & REY J. 1996. Deception Island (Bransfield Strait, Antarctica): an Example of a Volcanic Caldera developed by Extensional
plataforma externa e talude das bacias de Pelotas e Santos em um SIG 3D. In: Congresso Brasileiro de P&D em Petr´oleo e G´as, 6., Brazil, 1-8. October.
PRESTON JM, BIFFARD BR & CHAPMAN NR. 2007. Acoustic Classifica-tion with Single-Beam Echosounders: Processing Methods and Theory for Isolating Effects of the Seabed on Echoes. OCEANS, 1–8.
SHULTZ CH. 1970. Petrology of the Deception Island Volcano, Antarc-tica. Antarctic Journal of the United States, 5(4): 97–98. July-August. SMELLIE JL. 2002. The 1969 subglacial eruption on Deception Island (Antarctica): events and processes during an eruption beneath a thin glacier and implications for volcanic hazards. Geological Society Spe-cial Publications, 202: 59–79.
USACE. 2001. Acoustic Multibeam Survey Systems for Deep-Draft Navigation Projects – Chapter 11. pp. 1–33. January 1st.
Recebido em 2 fevereiro, 2016 / Aceito em 17 outubro, 2016 Received on February 2, 2016 / Accepted on October 17, 2016