i
A Panel Data Econometric Study of VAT Rate Impact on
Consumption in European Union
Irina Akhmetova
Tese de Mestrado em Finanças e Fiscalidade
Orientada por
Francisco Vitorino da Silva Martins
Elísio Fernando Moreira Brandão
ii ABSTRACT
In this study we analyze if taxing consumption discourages consumption, as it is believed to encourage savings, and thus to generate higher economic growth. Despite much theory literature about substituting income taxes by consumption taxes, there are still few empirical works on the data available. Are consumption taxes more effective than income taxes? In this paper, we estimate the impact of a broad-based consumption tax, the value-added tax (VAT), on the aggregate consumption of twenty seven European Union countries over the period 2000–2010. Our empirical results indicate that the effective VAT rate has a positive impact on the consumption and reaches its maximum point when the effective VAT rate variable is equal to 13.18 percent. The further increase of the effective VAT rate implies a decrease of the final household consumption.
iii INDEX
1. INTRODUCTION ... 1
2. LITERATURE REVIEW... 4
2.1. VAT theory literature. ... 4
2.2. Consumption and savings literature. ... 4
2.3. Literature about substitution of income tax by consumption tax. ... 5
2.4. Literature on VAT rate impact on consumption. ... 7
3. DATA AND METHODOLOGY ... 8
3.1. Data description. ... 8
3.2. Data statistics. ... 11
3.3. Econometric issues and methodology ... 15
4. EMPYRICAL ANALYSIS AND ESTIMATION RESULTS ... 17
5. CONCLUSIONS. ... 20
1
1. INTRODUCTION
The introduction of the value-added tax (VAT), also known as goods and services tax or GST, can be considered one of the most important events in the world tax structure evolution in the last half of the 20th century, mainly due to its expansion across the world.
The VAT is a general tax on consumption levied on the value added to intermediate products by businesses at each stage of production. It is a multistage sales tax that excludes the purchase of intermediate goods and services from the tax base. So, value added is simply a difference between sales proceeds and purchases of intermediate goods over a certain period.
The VAT was first introduced in France, in 1954, by the French tax authority, in order to arrest the increasing smuggling and cheating, which were resultants of high sales tax and tariffs. Initially introduced for large businesses, with the passage of time, VAT was employed for all businesses sectors of the country, and nowadays is still considered to be one of the major sources of French state finance.
The fact is that since the late 1960s the VAT has become the main consumption tax in 105 developed and developing countries, being nowadays the most commonly used consumption-based tax in the world. All the 30 member nations of the Organization for Economic Cooperation and Development (OECD), except for the United States, use the value-added tax and its introduction is one of the conditions of membership in the European Union (EU).
The main argument for the VAT universal usage has been that a well configured VAT permits more revenue with less administrative and economic costs than other generally based consumption taxes. Another argument is that the VAT generates revenues in a highly neutral mode. Unlike the income taxes, it does not influence the forms or methods of doing business. Obviously, these VAT attributes are important in an interdependent, competitive and global world.
As a matter of fact, VAT proves to be beneficial for the government, because through implementation of this tax system government can raise revenues invisibly,
2
where the tax is not shown on the bill paid by the buyer. Therefore VAT policy is an important part of the macroeconomic fiscal policy of any country, taking into consideration that in most part of the countries the VAT is the main revenue source for the state.
Nowadays, when the integrity of Euro Zone is threatened by high instability caused by the sovereign debt crisis, everybody’s attention is specially focused on austerity measures, rescue plans, financing and refinancing of public debt, as well as on the fiscal measures that determine the revenue of the national budgets.
The fact is that fiscal policies usually have impact on different aspects of the economy. For instance, an increase or decrease in tax rates has an impact on the immediate tax revenues, as well as on long term state revenues and economic growth. Being the VAT a general tax on consumption, its influence on the consumption is predictable. And this role can be even more important as the consumption is one of the determinants of economic and GDP growth.
Furthermore, there is a general notion that the consumption taxes are more favorable to savings and investment than income tax. On the other hand, it is widely believed that consumption taxes discourage consumption, stimulate savings, and thus generate higher economic growth.
Today, more than ever, the governments should analyze the consumers’ behavior in order to implement the most adequate fiscal strategy that should be able to achieve the aim of increasing public revenue, without prejudicing economic growth.
In fact, consumption taxes are believed to be more favorable for savings and help to avoid the efficiency loss in the allocation of resources between present and future consumption. The concern about the impact of income tax on investment and savings makes many economists consider consumption taxation an alternative to income-based taxes.
We should mention that there are a considerable number of studies regarding consumption taxation. Some of them focus on the general aspects of VAT, its history, evolution and particular aspects in some developed or developing countries. Others try
3
to measure the influence of VAT rates on the overall VAT revenues, economic growth and GDP. There is also much literature examining the determinants of consumption and savings.
However, there are very few studies exploring the impact of VAT or consumption taxes on main economic variables like consumption, although it has a crucial interest to practitioners, academics and policymakers.
In this sense the purpose of this paper, keeping in mind the present need of fiscal revenue growth in most of the EU countries public finances, is to estimate the impact of the value-added tax on the aggregate consumption of twenty seven EU member states over the period 2000–2010.
We organized the structure of this paper in order to review the literature analyzing theoretical knowledge and some empirical data about the VAT and consumption in Chapter 2. We describe the data and methodology adopted in Chapter 3. We analyze the empirical results in the Chapter 4 and express the conclusions in Chapter 5.
4
2. LITERATURE REVIEW.
As we have already mentioned above, there are many studies dedicated to different aspects of VAT and consumption.
2.1. VAT theory literature.
Firstly, the general literature about value-added tax describes and studies its main features, namely its design, implementation and administration. For instance, Cnossen (1998) analyzes various VAT structure and policy issues, such as tax coverage features, tax base aspects, hard-to-tax sectors, rate structure issues, and interjurisdictional coordination problems. Bird (2005) studies some issues regarding the VAT implementation in developing countries.
2.2. Consumption and savings literature.
Secondly, there are theoretical classic studies about consumption and savings, such as Friedman (1957), Hall (1978) and Dynan (1993), among many others. Some of these works link the consumption taxes to the consumers’ options from the theoretical point of view.
For example, the elasticity of intertemporal substitution as one of the determinants of the response of saving and consumption to the real interest rate is studied in the work of Hall et al. (1988).
Stokey (1995) examines the features of tax policy, among other factors, that are critical for conclusion about the long-run growth effects of taxation.
Darby (1996) attempts to assess the overall effectiveness of fiscal policy, estimating the marginal rate of substitution between aggregate capita consumption and per-capita government expenditure on goods and services in the United States (US).
5
Jappelli (2010) evaluates the empirical evidence on the sensitivity of consumption to predicted income changes, distinguishing these situations from the episodes in which income changes unexpectedly.
2.3. Literature about substitution of income tax by consumption tax.
Several studies try to link the consumption taxes to the consumers´ behavior and savings. Most of them focus on the theory of switching from an income based tax to a consumption based tax.
For example, Batina (1999) studies the properties of the switch from an income tax to a consumption tax in the presence of bequests, showing that the consumption tax will distort the bequest decision if bequests are taxed at the consumption tax rate but not when bequests are exempt. The author concludes that including bequests in the tax base under the consumption tax may reduce the incentive to save and that the main benefit from reforming the tax system may arrive from the switch away from the income tax and not in the move toward the consumption tax if bequests are taxed. So taxing bequests at the consumption tax rate may result in a decline of capital accumulation.
Hyman (2007) studies the government fiscal policy and the theory of taxation, defining the consumption as a tax base in alternative to income. He also evaluates the taxes in turns of their effects on the distribution of income. One of the chapters analyzes the impact of substituting consumption tax by income tax from the theoretical point of view, considering the consumption tax as equivalent to an income tax that excludes the taxation of savings.
Dresch et al. (1977) make an attempt to identify the mechanisms by which the effects of the tax substitution from income tax to a value-added tax in the United States would be transmitted through the economy. They identify the probable price changes resulting from the tax substitution and discuss the potential implications of these changes on such substantial issues like income distribution and international trade, among others. The authors also make a detailed analysis of the theoretical issues which must be resolved if changes in tax structure are to be translated into changes in the structure of prices. They analyze:
6
- criteria for defining a compensating tax substitution, i.e., for determining tax rates;
- alternative variants of a value-added tax;
- the meaning of tax shifting and the treatment of depreciation;
- fiscal implications of a tax substitution; and
- the input-output model as a means of analytical synthesis.
On the basis of this model, compensating VAT/CIT substitutions and price changes by component of final demand and by industry are examined, under alternative stipulations concerning the degree of CIT reduction and shifting.
Some other studies discuss the economic implications of a policy shift from an income to a consumption tax. So, Diamond (2008) suggests introducing in the US a new consumption-based tax to replace the current system, which is a hybrid tax that has both income tax and consumption tax elements.
Fullerton (1983) examines the welfare consequences of changing the US income tax system to a progressive consumption tax, defending that with this change individuals initially will save more and consume less. In the long run, as the capital stock grows, consumption eventually overtakes the original path and the economy approaches the new balanced growth path with higher consumption and a greater capital stock.
Studying the relation between consumption-based taxes and savings, Lewis (1998) comes to a conclusion that conversion of an income tax to a consumption tax can increase aggregate saving even if each household maintains a constant propensity to save.
Dynan et al. (2004) find a strong positive relationship between saving rates and lifetime income and a weaker but still positive relationship between the marginal propensity to save and lifetime income.
Finally, Blumkin et al. (2008) construct an environment in which individuals make real labor-leisure choices and spend their earned income on real goods. They use that
7
experimental framework to test whether a labor income tax and an equivalent consumption tax lead to an identical labor-leisure allocation. They curiously conclude that despite controlling individuals’ work ability and inherent labor-leisure preferences and not allowing for saving, individuals reduce their labor supply significantly more in response to an income tax than they do in response to an equivalent consumption tax.
2.4. Literature on VAT rate impact on consumption.
Despite the variety of studies, the empirical literature that ties consumption taxes to consumer behavior is quite limited. Indeed, most studies that incorporate taxes when estimating the aggregate consumption function use either tax revenue as a percent of GDP or some measure of the marginal income tax rate.
There is also a large theoretical literature (see for example Kneller (1999)) that examines the impact of taxes (e.g., income versus consumption taxes, progressive versus flat rate taxes) on endogenously determined economic growth. In a similar way, several empirical papers have tested for the effects of fiscal policy in general, and taxes in particular, on country-level economic growth.
The most recent study of Alm and El-Ganainy (2012) is an empirical analysis that examines the impact of the VAT rate on consumption, being their study limited to the fifteen European Union countries and to the 1961 - 2005 period. Their empirical results indicate, across a variety of estimation methods and specifications, that a one percentage point increase in the VAT rate leads to roughly a one percent reduction in the level of aggregate consumption in the short run and to a somewhat larger reduction in the long run.
Some other studies simply conclude that the effect of the VAT on consumption is an important but unresolved issue.
In our paper we make an attempt to provide formal empirical evidence on the relationship between the VAT and consumption, using actual and recent available data extended to twenty seven EU countries.
8
3. DATA AND METHODOLOGY
Our approach follows previous empirical studies that are based upon the estimation of an aggregate consumption function in which consumption depends upon current income, economic factors, and additional variables that include (among other things) taxes. Our dataset includes twenty seven EU countries over the period 2000–20101.
It should be noted that this analysis was performed for European Union countries for various reasons. First of all, data on main variables is more available for these countries. Secondly, it is also important to notice this analysis shall be relevant in the current conjuncture of financial, economic and even political crisis that the European Union faces, where fiscal policy assumes an increasingly key role.
The period 2000 – 2010 deserves our special attention as it includes most part of the actual 27 states already in the European Union or preparing to enter the European Union. On the other hand, we also have in consideration, on one hand, that in 2000 the Euro started its life as a credible currency. Lastly, only starting from the 2000 VAT existed in all the twenty seven countries of the actual European Union. The last country introducing VAT was Slovenia, in 2000.
3.1. Data description.
Annual data on final consumption expenditure of households (national concept) and gross domestic product at market prices (GDP) are generated from Eurostat statistics.
Data on the consumer price index (CPI) (with 1995 as the base year), total population, inflation and unemployment are generated from various years of the World Development Indicators of the World Bank.
1 These twenty seven countries (with their entry into the EU in parentheses) are: Austria (1995), Belgium (founding member), Bulgaria (2007), Cyprus (2004), Czech Republic (2004), Denmark (1973), Estonia (2004), Finland (1995), France (founding member), Germany (founding member), Greece (1981), Hungary (2004), Ireland (1973), Italy (founding member), Latvia (2004), Lithuania (2004), Malta (2004), the Netherlands (founding member), Poland (2004), Portugal (1986), Romania (2007), Slovakia (2004), Slovenia (2004), Spain (1986), Sweden (1995), and the United Kingdom (1973).
9
Data on different tax indicators are drawn from the Eurostat statistics, including: the VAT standard rate; VAT revenues; and taxes on individual or household income.
As Eurostat and World Bank statistics present all the data in current prices, we used the CPI to adopt the data available and to get the same data in real prices, on the basis of the year 2000.
The dependent variable is final consumption expenditure of households for country
i in year t, in natural logs (or Ln CONSUM_REALi,t ); its sample mean is about 11. We shall try to explain consumption with several “core” independent variables.
The first key explanatory variables are the following tax variables:
• The effective value-added tax rate for country i in year t (or EfVAT_Rate i,t ) is
the main variable to which this study is dedicated. Although we could have oriented this study on either a revenue measure or a statutory rate, we declined these options in favor of the effective VAT rate because it is the more appropriate measure of VAT influence on the consumption. Our choice is explained by two main reasons.
On one hand, the VAT statutory rate has variations across countries and time, including or excluding some specific types of products from the tax base. The VAT rate also has exemptions that may depend on subjective or objective requirements. So, in order to reduce these differences and to allow better comparability across countries and time, we prefer the more reliable effective VAT rate.
On the other hand, since we are concerned about the intertemporal effect generated by the VAT as a tax on consumption, the effective rate will better reflect that effect than a tax revenue measure, as the effective rate is easier to perceive as altering relative prices of the present consumption versus the future consumption.
We calculate the effective VAT rate through dividing the VAT revenues (real prices) by the final consumption expenditure of households (real prices):
EfVAT_Rate i,t = [VAT revenues (real prices) / Final consumption expenditure of households (real prices)] x 100
10
The effective VAT rate is expected to be negatively related to the level of final consumption expenditure of households.
• Taxes on individual and household income at real prices, in natural logs (Ln TAX_IND_REALi,t) is a control variable, since we believe the income based taxes decreasing the individuals´ income available, are strongly capable to restrict the consumption. This variable is expected to capture the negative effect of income taxes on the final consumption of households.
In addition to these tax variables, other core regressors include (where i denotes the country and t denotes the year):
• Lagged household final consumption expenditures, in natural logs (Ln CONSUM_REALi,t−1). This variable is supposed to capture the influence of habits acquired in the past on current consumption behavior.
• Gross domestic product per capita at real prices, in natural logs (Ln GDP_PC_REALi,t ). The level of income represents the expected or planned component of life-cycle income. It is expected that GDP per capita has a positive impact on the consumption, since more developed countries are more leaning to consume.
• Unemployment rate (UNEMPi,t). The unemployment rate for country i in year t refers to the share of the labor force that is without work but available for and seeking employment. Definitions of labor force and unemployment differ by country. We use this variable to represent the effect of uncertainty about future income and we expect it to have negative impact on the consumption.
• Total population (POPi,t). It is expected that current consumption should have a scale effect, reflected in a positive relation with the total population of the state. Our total population variable is based on the de facto definition of population, which counts all residents regardless of legal status or citizenship, except for refugees not permanently settled in the country of asylum, who are generally considered part of the population of their country of origin. The values considered are midyear estimates.
11
• Inflation rate (INFLi,t ). The inflation rate represents the annual percent change in
consumer prices. We include this variable to capture the effect of economic uncertainty, nominal income decrease and consumers confidence.
In table 1 we resume the information about the initial data, without considering the respective natural logs.
Table 1 The data information
Abbreviation Description Source Measure unit
DEPENDENT VARIABLE
CONSUM_REAL Final consumption expenditure of households at real prices (basis =
2000) Eurostat Millions of euro
INDEPENDENT VARIABLES
EfVAT_RATE VAT effective rate Eurostat %
TAX_IND_REAL Taxes on individual or household
income at real prices (basis = 2000) Eurostat Millions of euro
GDP_PC_REAL Nominal Gross Domestic Product per
capita at real prices (basis = 2000) Eurostat Euro per inhabitant
UNEMP Unemployment, total WDI % of total labor force
POP Population, total WDI Inhabitant
INFL Inflation, consumer prices WDI Annual %
3.2. Data statistics.
Table 2 provides descriptive statistics of the dataset. There is substantial variation in the measures of effective VAT rate. Descriptive statistics show that the effective VAT rate ranges between 7.51 and 21.79 percent, with a sample mean of 13.72 percent.
12
Table 2 The data descriptive statistics
Observations Mean Median Maximum Minimum Std. Dev. CONSUM_REAL 297 206.405 73.097 1.191.317 2.692 330.628 EFVAT_RATE 286 13,72 13,38 21,79 7,51 2,95 TAX_IND_REAL 239 38.499 8.229 216.470 205 59.085 GDP_PC_REAL 297 18.089 15.600 66.394 1.264 12.588 UNEMP 297 8,13 7,40 20,10 1,80 4,01 POP 297 18.254.945 8.993.531 82.534.176 381.363 22.669.493 INFL 297 3,29 2,53 34,47 -4,48 3,24
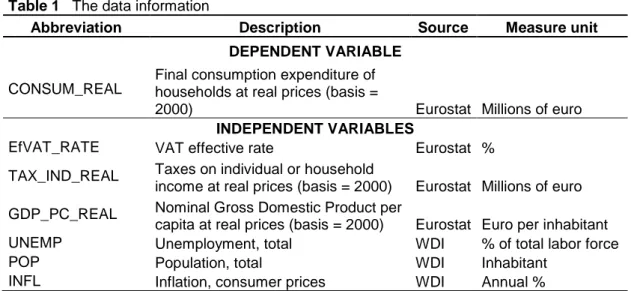
Figure 1 shows the effective VAT rate for the 27 EU countries over the entire 2000–2010 time period. These figures indicate clearly the significant variations in the effective VAT rate across all countries.
Fig. 1 Effective VAT rate: average EU 27 (2000-2010)
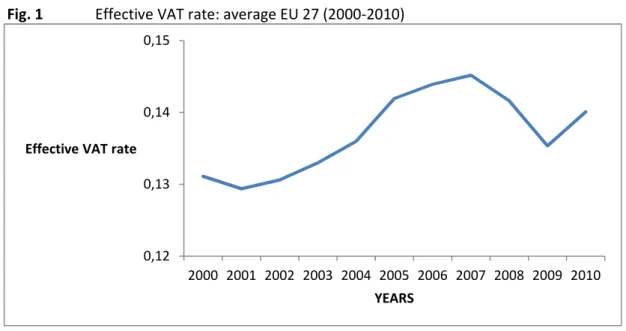
Figure 2 shows the final consumption for the 27 EU countries over the entire 2000–2010 time period. It is worth to stress the constant increase until 2008, the first year of the recent European crisis, a considerable decrease in 2009 and a recovery in 2010. 0,12 0,13 0,14 0,15 2000 2001 2002 2003 2004 2005 2006 2007 2008 2009 2010
Effective VAT rate
13
Fig. 2 Final consumption: average EU 27 (2000-2010)
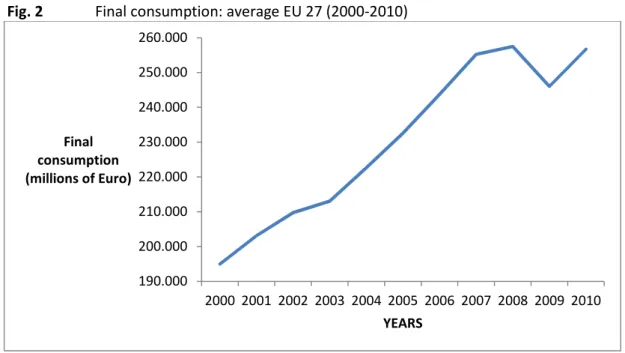
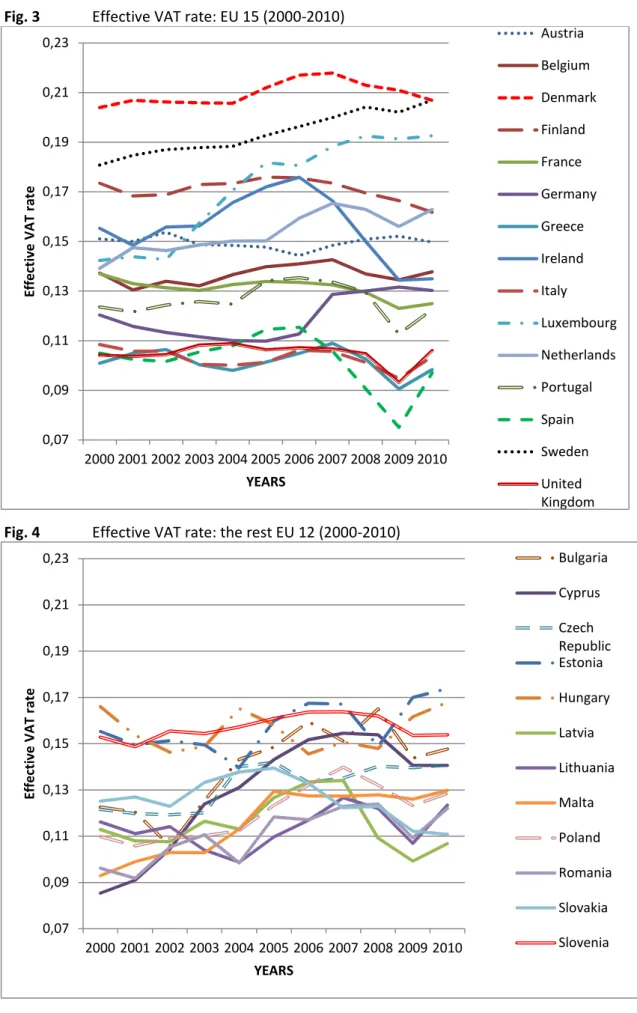
Figures 3 and 4 show the effective VAT rate per country for the 15 EU countries and for the other 12 EU countries respectively. Indeed, when one examines the individual country data, the variation over time is of course even greater. The highest individual country effective VAT rate was implemented in Denmark in 2007 (21.79 percent), and the lowest rate was applied in Spain in 2009 (7.51 percent). Curiously the 12 EU states that joined the European Union after 2004 represent the lower variation and seem to have the closest rates (most of them between 9 and 17 percent).
190.000 200.000 210.000 220.000 230.000 240.000 250.000 260.000 2000 2001 2002 2003 2004 2005 2006 2007 2008 2009 2010 Final consumption (millions of Euro) YEARS
14 Fig. 3 Effective VAT rate: EU 15 (2000-2010)
Fig. 4 Effective VAT rate: the rest EU 12 (2000-2010) 0,07 0,09 0,11 0,13 0,15 0,17 0,19 0,21 0,23 2000 2001 2002 2003 2004 2005 2006 2007 2008 2009 2010 E ff e ct iv e V A T r a te YEARS Austria Belgium Denmark Finland France Germany Greece Ireland Italy Luxembourg Netherlands Portugal Spain Sweden United Kingdom 0,07 0,09 0,11 0,13 0,15 0,17 0,19 0,21 0,23 2000 2001 2002 2003 2004 2005 2006 2007 2008 2009 2010 E ff e ct iv e V A T r a te YEARS Bulgaria Cyprus Czech Republic Estonia Hungary Latvia Lithuania Malta Poland Romania Slovakia Slovenia
15
3.3. Econometric issues and methodology
We employ a reduced form of linear equation for consumption. We focus on a core set of regressors as determinants of consumption, selected based on theoretical connection and analytical relevance. We also examine the impacts of a number of less-standard consumption determinants.
As discussed earlier, our core regressors include lagged consumption expenditures, GDP per capita, unemployment rate, total population, inflation rate, control variable (taxes on individual and household income), and naturally our main variable of interest, the effective VAT rate.
We are interested in estimating the following simple consumption model with unobserved country-specific effects:
Ln CONSUM_REALi,t = α Ln CONSUM_REALi,t−1 +β´Xi,t + µi,t , for i = 1, . . . , N and t = 2, . . . , T , (1)
where
CONSUM_REALi,t is the observable dependent variable (and CONSUM_REALi,t−1 is its lagged value)
Xi,t is a K ×1 vector of observable independent variables
β is a K ×1 vector of parameters
µi,t is a random disturbance term satisfying the assumptions that
E(µi,t ) = 0, E(µ2i,t) = σ2µ, and E(µi,tµj,s ) =0 if i ≠ j and/or t ≠ s
N is the number of cross-sectional units, or countries
T is the number of time periods, or years
Standard estimation by OLS (Ordinary Least Squares) implies that all observations are homogeneous regarding the variance of disturbances or “errors” (homocedasticity), so they have equal weight in estimation.
16
Since this study analyzes a panel data, 27 countries over 11 years, we use cross-section fixed-panel method of estimation assuming the presence of cross-cross-section heteroskedasticity.
17
4. EMPYRICAL ANALYSIS AND ESTIMATION RESULTS
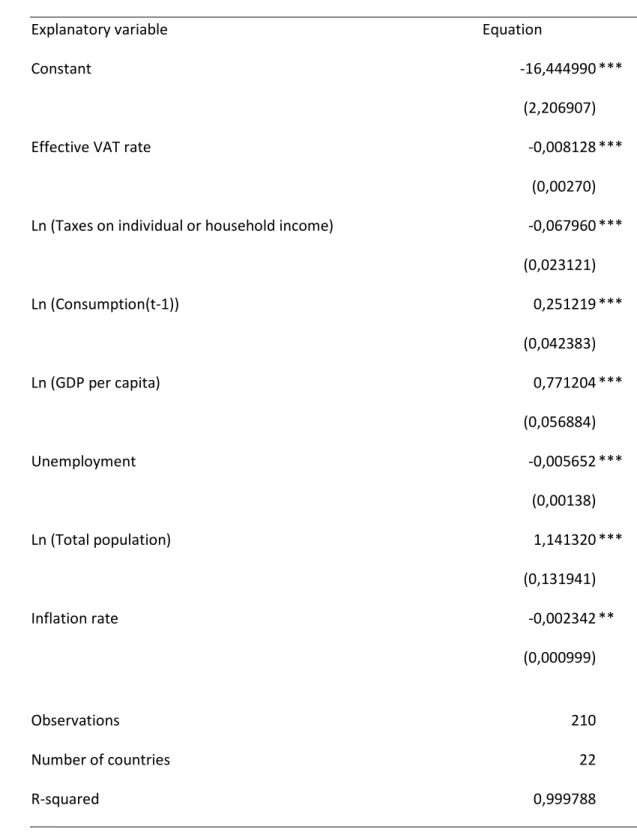
It should be remembered that we have estimated many variants, with some substantive change in our results, as in some cases the variable coefficients lose their statistical significance. Table 3 reports the core results for the final consumption of households using our OLS estimator.
The results show a statistically significant relation between the effective VAT rate and the level of final consumption of households. This relation is statistically significant (at the 1 percent level), and implies that the impact of the effective VAT rate on final household consumption is negative. The coefficient of -0.0081 implies that if the effective VAT rate increases one percentage point the consumption declines in the short run by 0.81 per cent.
The lagged consumption coefficient will lead us to the long-run impact of effective VAT rate on consumption, by dividing the coefficient of EfVAT_Rate (-0.0081) by 1 minus the coefficient of lagged consumption (1 - 0.2512 = 0.7488). As expected, the long-run impact of an increase in the effective VAT rate is almost 75% larger than the short-run impact.
Further, the influence of the income tax on consumption is negative, highly relevant and significant at 1% level. The estimated income tax coefficient (-0.068) implies that a one per cent increase of the income tax rate results in a 6.8 per cent decrease in the households consumption expenses.
From the point of view of option between consumption and income based taxes this result is a patent evidence of a much smaller impact of VAT rate on the final consumption comparing it with the income tax rate impact.
As for other variables, the general economic variables as GDP per capita and total population have a positive and significant impact on the final household consumption, with the significance level of 1%.
The estimated GDP per capita coefficient (0.77) indicates that an increase in the GDP per capita by 1 per cent leads to an increase of final household consumption by
18
0,77 per cent. This result confirms that in countries with high GDP and subsequently high income, the consumption follows the growth tendency.
The estimated total population coefficient (1.14) shows, as expected, that an increase in total population by 1 per cent leads to an increase of consumption by 1.14 per cent. This seems to demonstrate the scale effect, as in countries with higher population the consumption should tend to be more significant.
The estimated coefficients of unemployment rate (-0.006) and inflation rate (-0.002) have a slightly negative impact on the final households consumption at 1% and
5% significance level respectively. The negative impact of these two variables is predictable, as the increase of unemployment rate and inflation rate usually means a decrease of available income and lower confidence of consumers considering pessimistic expectations.
19
Table 3 Determinants of Final Consumption in European Union - Effective VAT rate
Explanatory variable Equation
Constant -16,444990 ***
(2,206907)
Effective VAT rate -0,008128 ***
(0,00270) Ln (Taxes on individual or household income) -0,067960 ***
(0,023121) Ln (Consumption(t-1)) 0,251219 *** (0,042383) Ln (GDP per capita) 0,771204 *** (0,056884) Unemployment -0,005652 *** (0,00138) Ln (Total population) 1,141320 *** (0,131941) Inflation rate -0,002342 ** (0,000999) Observations 210 Number of countries 22 R-squared 0,999788
Notes: The dependant variable is the Final Consumption of Households in natural logs (Ln CONSUM_REALi,t).
Standard errors are in parentheses
** Significant at 5 % *** Significant at 1 %
20
5. CONCLUSIONS.
In this paper we make an attempt to include explicitly and to estimate directly the effect of the VAT rate on consumers´ behavior. We try to find out if the value-added tax affects the consumption level. We based our research on a sample of twenty seven EU countries over the recent period of 2000–2010 and the OLS estimator.
The main contribution of this study is that it extends the previous literature by considering all European Union members, more recent years and, additionally, it analyzes the influence of income based taxes on the consumption level.
The results show, just as it was expected, that the level of aggregate consumption is highly and negatively dependent on the effective VAT rate.
In fact, we are able to conclude that if the effective VAT rate increases one percentage point the consumption declines in the short run by 0,81 per cent. The use of the lagged consumption coefficient permits us to make conclusions about the long-run effect of the variations in VAT rate, more precisely we estimate that the long-run impact of a variation in the effective VAT rate is almost 75% larger than the short-run impact.
Besides the effective VAT rate, our econometric model estimates the impact of income based taxes state revenue on the consumption, predicting that a one per cent increase of the state income tax revenue implies a 6.8 per cent decrease of the final consumption of households.
We also found out the impact of other determinants on the consumption level, such as GDP per capita, total population, unemployment and inflation rate. As predicted, the first two factors have a positive impact on the households consumption and are statistically significant. While the impact of unemployment and inflation rate - which is also statistically significant - is negative, due to the expectations of individuals about the future income.
In the result of our research we found out that all the variables analyzed play an important role in the households consumption, although having different effect.
21
Although the results obtained in our research were expected and confirm the previous theoretical studies, we should always have in mind the restrictions resulting from the lack of some data available. We also acknowledge that more studies can be conducted, regarding the impact of other variables on the consumption level, or comparing the impact of different taxes on the consumption, or analyzing the impact of VAT rate in different classes of products.
Nevertheless, our results clearly have a certain implication concerning policymakers that should consider the potential impact of taxes on households’ consumption decision when designing a fiscal policy.
Besides many other considerations that influence the decision about the best way to tax consumption, estimation made in our study demonstrates globally that greater use of the VAT leads, at least in EU countries, to less consumption.
22
REFERENCES
Alm, J. & El-Ganainy, A. (2012), "Value-added taxation and consumption",
International Tax and Public Finance, 10.
Aschauer, D. (1985), "Fiscal policy and aggregate demand", American Economic
Review, 75(1), 117–127.
Attanasio, O. P., & Low, H. (2004), "Estimating Euler equations", Review of Economic
Dynamics, 7(4), 406–435.
Batina, R. (1999), "A differential incidence analysis of a tax reform from an income tax to a consumption tax in the presence of bequests", Public Finance Review, 27(3), 353– 370.
Bird, R. (2005), Value-added taxes in developing and transitional countries: lessons
and questions. Working Paper N. 05-05, International Studies Program, Andrew Young
School of Policy Studies, Georgia State University, Atlanta, GA.
Blumkin, T., Ruffle, B. J., & Ganun, Y. (2008), Are income and consumption taxes ever
really equivalent? Evidence from a real-effort experiment with real goods. CESifo,
Working Paper Series No. 2194, Munich, Germany.
Cnossen, S. (1998), "Global Trends and Issues in Value Added Taxation", International
Tax and Public Finance, 5, 399–428.
Darby, J., & Malley, J. (1996), "Fiscal policy and aggregate consumption: new evidence from the United States", Scottish Journal of Political Economy, 43(2), 129–145.
Diamond, J., & Zodrow, G. (2008), Consumption tax reform. In J. Diamond & G.
Zodrow (Eds.), Fundamental tax reform: issues, choices, and implications (pp. 226–
237). Cambridge: MIT Press.
Dresch, Stephen P., An-loh Lin, and Stout, D. K. (1977), "Substituting a Value Added Tax for the Corporate Income Tax: First-Round Analysis", National Bureau of Economic Research (http://www.nber.org/books/dres77-1 accessed in the 15th of June, 2012)
Dynan, K. (1993), "How prudent are consumers?", Journal of Political Economy, 10(6), 1104–1113.
23
Dynan, K., Skinner, J. and Zeldes, S.P. (2004), "Do the Rich Save More?", Journal of
Political Economy, vol. 112, n. 2.
Fullerton, D., Shoven, J., & Whalley, J. (1983), "Replacing the U.S. income tax with a progressive consumption tax: a sequenced general equilibrium approach", Journal of
Public Economics, 20(1), 3–23.
Hall, R. (1978), "Stochastic implications of the life cycle-permanent income hypotheses: theory and evidence", Journal of Political Economy, 86(6), 971–987.
Hall, Robert E. (1988), "Intertemporal Substitution in Consumption", Journal of
Political Economy, v. 96, iss. 2, pp. 339-57.
Hyman, D. N. (2007), Public Finance: A Contemporary Application of Theory to
Policy (http://books.google.pt/books?id=ujHQIfeBm5YC&pg=PA652&lpg=PA652&dq=a+differ ential+incidence+analysis+of+a+tax+reform+from+an+income+tax+to+a+consumption&source
=bl&ots=C4oE9F_BZX&sig=L1ZI0I-VUbOv0NnEdOFNqxge-eg&hl=pt-PT&sa=X&ei=-1OBT_rcJ6ad0AW664WRBw&ved=0CDsQ6AEwAw#v=onepage&q=a%20differential%20inciden ce%20analysis%20of%20a%20tax%20reform%20from%20an%20income%20tax%20to%20a%2 0consumption&f=false, accessed in the 14th of May 2012).
Jappelli, T., & Pistaferri, L. (2010), "The consumption response to income changes",
Annual Review of Economics, 2, 479–506.
Kneller, R., Bleaney, M., & Gemmell, N. (1999), "Fiscal policy and growth: evidence from OECD countries", Journal of Public Economics, 74(2), 171–190.
Lewis, K., & Seidman, L. (1998), "The impact of converting to a consumption tax when saving propensities vary: an empirical analysis", International Tax and Public Finance,
5(4), 499–503.
Stokey, N., & Rebelo, S. (1995), "Growth effects of flat-rate taxes", Journal of Political