Department of Information Science and Technology
Explaining Portuguese’s Public Administration Absenteeism
Through Data Mining
Leandro Miguel Bartolomeu da Cruz Costa
A Dissertation presented in partial fulfillment of the Requirements for the Degree of Master in Computer Science and Business Management
Supervisor: Sérgio Moro, PhD, Assistant Professor, Instituto Universitário de Lisboa (ISCTE-IUL)
Co-supervisor: Ricardo Ramos, MSc, Researcher at ISTAR-IUL, Instituto Universitário de Lisboa (ISCTE-IUL)
Department of Information Science and Technology
EXPLAINING PORTUGUESE’S PUBLIC ADMINISTRATION
ABSENTEEISM THROUGH DATA MINING
Leandro Miguel Bartolomeu da Cruz Costa
A Dissertation presented in partial fulfillment of the Requirements for the Degree of Master in Computer Science and Business Management
Supervisor: Sérgio Moro, PhD, Assistant Professor, Instituto Universitário de Lisboa (ISCTE-IUL)
Co-supervisor: Ricardo Ramos, MSc, Researcher at ISTAR-IUL, Instituto Universitário de Lisboa (ISCTE-IUL)
E
x
p
lai
n
in
g
P
o
rt
u
g
u
es
e’s
p
u
b
lic a
d
m
in
is
tra
tio
n
a
b
se
n
te
ei
sm t
h
ro
u
g
h
d
at
a mi
n
in
g
L
ean
d
ro
M
ig
u
el
Bar
to
lo
me
u
d
a Cr
u
z Co
st
a
i
Abstract
Portuguese Public Administration (PPA) is the largest contractor in the country, with 12.8% of the Portugal’s active people working for it. Absenteeism and productivity are mutually connected. Thus, companies from public and private sector should always have it in mind, to prevent flaws in the processes and profit loss.
Effectively, the main goal of this study is to understand PPA’s absenteeism, particularly the duration of the worker’s next absence, what leads to it, as well as explaining it, by creating a data mining model that fits the problem.
To study PPA’s absenteeism it was collected data from a Human Capital Management (HCM) system, by extracting the annual absenteeism report, for 2016, and queries to the worker’s profile, absenteeism history and job characteristics, resulting in around 59,000 different absence records.
Data mining techniques were used to clean the dataset and Recency, Frequency and Monetary (RFM) value methodology to add new variables to the problematic, originating richer information about the worker and the absence itself.
Thereafter, the Support Vector Machines (SVM) algorithm was applied for modeling the absence duration in day and a 10-fold cross-validation scheme was adopted to assess and confirm the model’s robustness.
Finally, major findings were revealed by this study as features related to the worker’s profile are less relevant than absence related features; the influence of the RFM methodology in this study, which managed to get all its computed variables in the 25th most important features; and the discovery of the most concerning employee profile.
ii
Resumo
A Administração Pública Portuguesa (APP) é o maior contratante do país, englobando 12.8% da população ativa. O absentismo e a produtividade estão mutuamente ligados, logo tanto as empresas dos vários setores devem tê-las em atenção para prevenir falhas nos processos e perda de lucro.
Efetivamente, o principal propósito deste estudo é perceber o absentismo na APP, em especial a duração da próxima ausência de um trabalhador, as suas causas e explicá-la, através da criação de um modelo adequado ao problema.
Para modelar o absentismo na APP recolheram-se dados de um sistema de gestão de recursos humanos, extraindo o relatório anual de absentismo, para 2016, e dados do perfil do trabalhador, histórico de absentismo e especificações do contrato, resultando em cerca de 59,000 ausências.
Por sua vez, foram usadas técnicas de data mining para limpar o conjunto de dados e a metodologia Recency, Frequency and Monetary value (RFM) para adicionar novas variáveis à problemática e obter mais perspetivas sobre o trabalhador e a ausência.
De seguida, foi aplicado o algoritmo Support Vector Machines (SVM) para modelar a duração da ausência em dias e um esquema de validação cruzada com 10 folds, que testou e aprovou a robustez do modelo.
Por fim, este estudo revelou várias descobertas como: variáveis relacionadas com o perfil do trabalhador são menos relevantes que as relacionadas com a ausência em si; a influência da metodologia RFM neste estudo, que conseguiu ter todas as suas variáveis nas mais importantes; e a descoberta do perfil do trabalhador mais preocupante.
iii
Acknowledgements
I am thankful to my supervisors, whose continuous support, concern and motivation have allowed this study to be carried out, despite the most difficult moments, due to the lack of time and the very specificities of the data. I learned a lot from this project, in addition to the deepening of my knowledge in this area, the ability to manage my time well, between work and the thesis, was key to achieve the final version of this study, but also with them, like the importance of the literature review and the ability to state our ideas in the most perceivable way for the greatest number of people, changed the way I used to think and expressed myself.
The institution should also be thanked to, because of its role in making available very good and professional supervisors and, also, the resources I needed to make the best thesis I could.
I am also grateful to my coworkers for sharing their ideas with me, which improved the quality of this study exponentially, and I am deeply thankful to my project managers that provide me access to the data, without it, this study would not be possible.
Last but not least, I want to thank my family and friends, which encouraged and motivated me in the most difficult times. Without them, it would have been way harder and as most students that work at the same time they are doing their thesis, I would have delayed the delivery or even given up.
iv
Table of contents
Abstract ... i Resumo ... ii Acknowledgements ... iii Table of contents ... iv Index of figures ... v Index of tables ... viList of abbreviations ... vii
1. Introduction ... 1
1.1 Portuguese Public Administration ... 1
1.2 Motivation and contribution ... 2
1.3 Review method ... 3
2. Theoretical background ... 5
2.1 Human resources and absenteeism ... 5
2.2 Public services ... 8
2.2.1 Reforms ... 8
2.2.2 Labor mobility ... 10
2.2.3 Contract of Employment characterization ... 11
2.2.4 Worktime schedule ... 13
2.2.5 Absences ... 14
2.2.5.1 Licenses and leaves ... 15
2.2.5.2 Unplanned Absences ... 16
2.2.5.3 Vacations ... 18
2.3 Human resources and data mining ... 19
2.4 Data mining and public sector ... 20
2.4.1 Support vector machines ... 21
2.4.2 Recency, frequency and monetary value (RFM) ... 22
2.4.3 Regression performance metrics ... 23
2.4.4 Sensitivity analysis ... 24
3. Materials and methods ... 26
3.1 CRISP-DM ... 26
3.2 Business and data understanding, and data preparation ... 29
3.3 Modeling and evaluation ... 33
4. Results and discussion ... 34
4.1. Model evaluation ... 34
4.2. Knowledge extraction ... 36
5. Conclusions ... 47
v
Index of figures
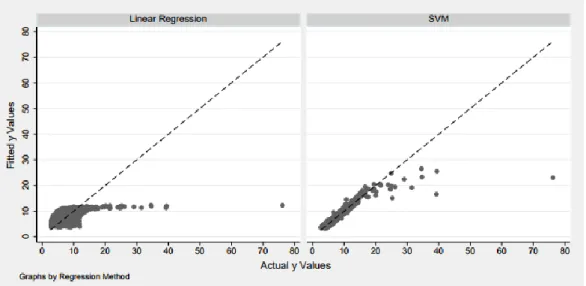
Figure 1 - Fitted versus actual values for both linear regression and SVM ... 22
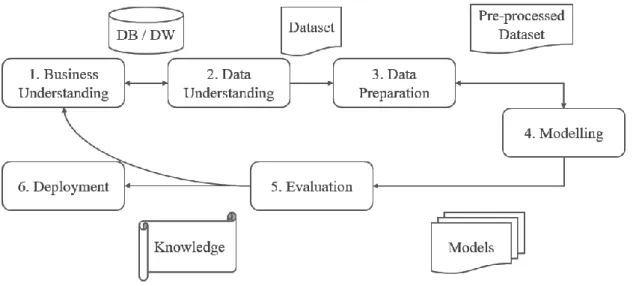
Figure 2 - The CRISP-DM process model, adapted from ... 26
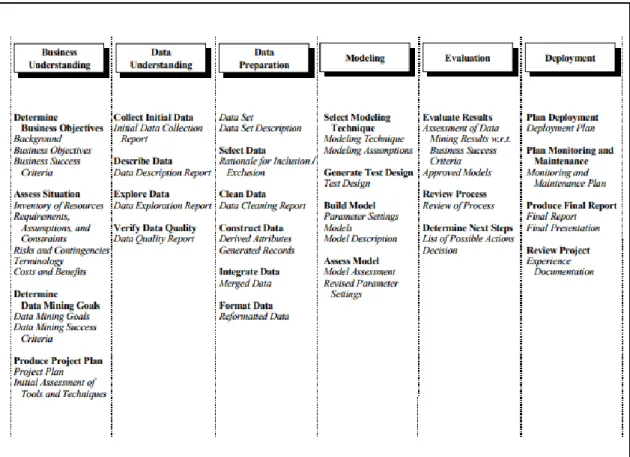
Figure 3 - Overview of the CRISP-DM tasks and their outputs ... 28
Figure 4 - PPA ID Card Front ... 29
Figure 5 - PPA ID Card Back ... 29
Figure 6 - Work schedule’s details ... 30
Figure 7 – Absence’s details ... 30
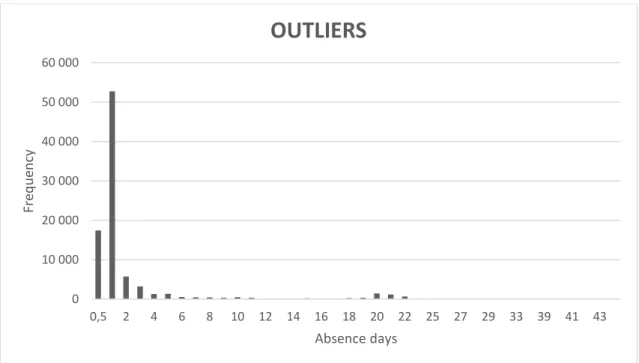
Figure 8 - Outliers ... 32
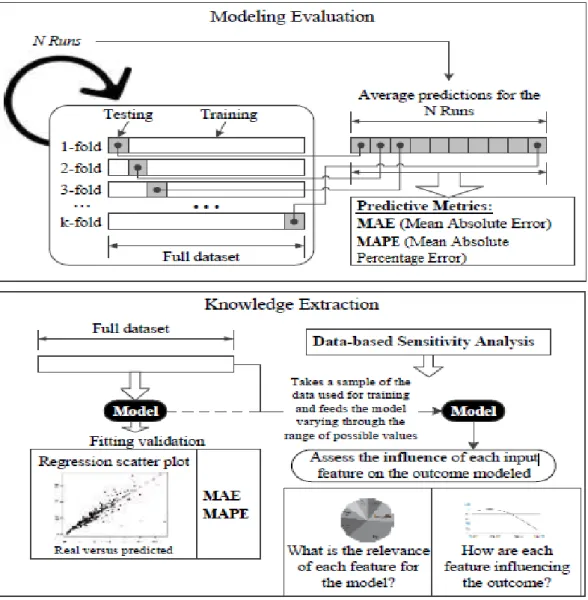
Figure 9 - Modelling evaluation and Knowledge extraction scheme ... 33
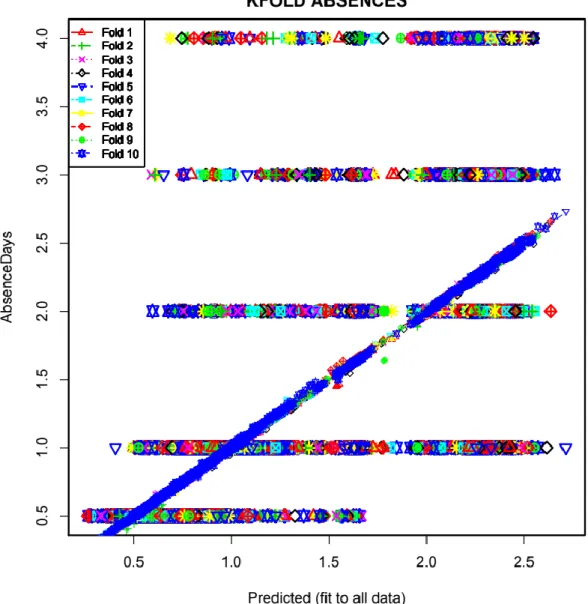
Figure 10 - K-fold model on the variable Absence Days ... 35
Figure 11 - Feature's relevance ... 36
Figure 12 - Effect of motive recurrence in absenteeism ... 39
Figure 13 - Absenteeism's motives and their impact ... 40
Figure 14 - Cumulative days of absence influence... 41
Figure 15 - Working time impact ... 42
Figure 16 - Absence after vacations ... 43
Figure 17 - Times absent ... 44
Figure 18 - Disability percentage ... 44
Figure 19 - Days with no absences ... 45
vi
Index of tables
Table 1 - Adapted RFM telemarketing features analyzed ... 23
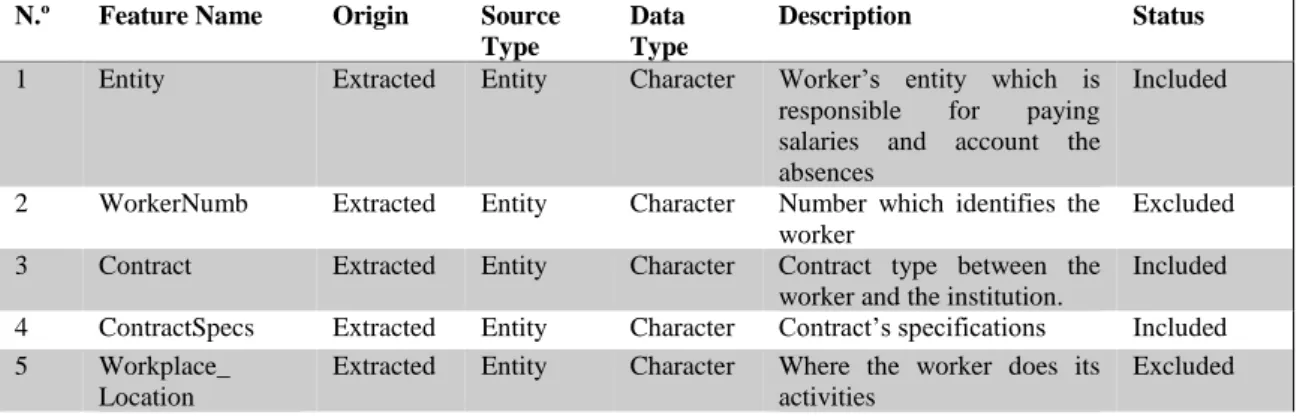
Table 2 - Features list ... 30
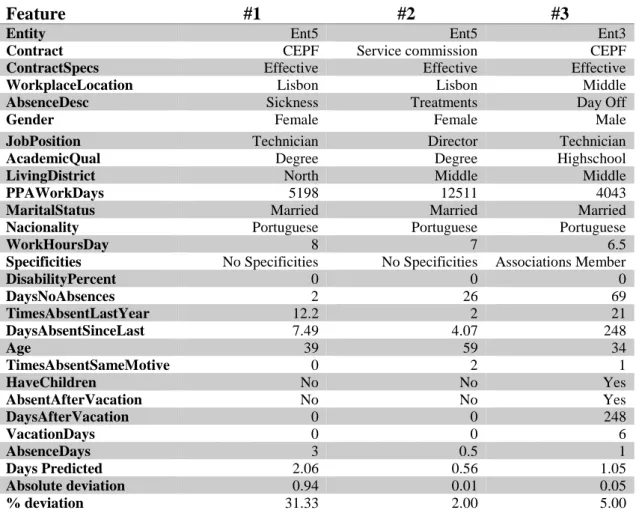
Table 3 - Prediction results for three absences ... 34
Table 4 - Performance metrics ... 35
Table 5 - Features' relevance ... 37
Table 6 - Major findings ... 48
vii
List of abbreviations
CE Contract of Employment CID Contract of indefinite duration
CRISP-DM CRoss-Industry Standard Process for Data Mining DSA Data-based Sensitivity Analysis
EU European Union
ERP Enterprise Resource Planning
GLPAE General Law for Public Administration Employment GM General Mobility
HCM Human Capital Management
HR Human Resources
MAE Mean Absolute Error
MAPE Mean Absolute Percentage Error
OECD Organization for Economic Co-operation and Development PA Public Administration
PPA Portuguese Public Administration RFM Recency, frequency and monetary value SA Sensitivity analysis
SM Special Mobility
SRM Structural Risk Minimization SVM Support vector machines TEC Term employment contract
1
1. Introduction
1.1 Portuguese Public Administration
Portugal is an EU member since 1986, where around 4.8 million Portuguese males and 5.4 million Portuguese females live in (PORDATA, 2017a), from which 6.5% works in the public administration, resulting in 12.8% of the active people and 14.0% of employed workers, by the end of the second trimester of 2017 (DGAEP - Direção-Geral da Administração e do Emprego Público, 2017b), close to the 18.1% general government employment as a percentage of total employment across OECD countries, in 2015 (OECD, 2017). Effectively, at 30th of June of 2017, the public employment was distributed as: 76.2% of the workers were working in the central administration (e.g., Tax Authority, Social Security, Police); 16.7% of the workers were working in the local administration (e.g., City councils, Hospitals, Trains); 5.6% of the workers were working in the autonomous regions’ administrations (e.g., Regional Governments) (DGAEP - Direção-Geral da Administração e do Emprego Público, 2017a).
As it is written in the Portuguese Constitution’s 266th article, the Public Administration shall seek to pursue the public interest, with respect for all those citizens’ rights and interests that are protected by law. Administrative organs and agents are subject to the Constitution and the law, and in the exercise of their functions must act with respect for the principles of equality, proportionality, justice, impartiality and good faith (Portuguesa, 2005).
Although in 2008 Portugal got caught in the global financial crisis that led to years of austerity where public debt, unemployment and taxes were the predominant subject of the daily news. Unemployment rates reached historical levels, 16.2% in 2013 (PORDATA, 2017b), deficit high as never seen before, around 20,000 million euros in 2010 (PORDATA, 2017c) and the constant raise of income from taxes, 21.6% of Portugal’s GDP in 2015 (PORDATA, 2017d) pictured Portugal for the last years.
However, Portugal is turning around as the results of 2017 show, the GDP per capita had a positive variation of 4.3% over the last year (AICEP, 2018), and the public debt dropped to 125.7% of the GDP, from 129.9% registered in 2016 (AICEP, 2018). In order to extend the prosperity of the country, this study will cover the case of PPA’s absenteeism, as explained in the next section.
2
1.2 Motivation and contribution
As stated in Perry’s (2010) article, it was found that those who wanted to work for government attached more importance to the social significance of a job as well as to job characteristics related to quality of life. In addition, PPA is the largest Portuguese contractor when talking about employees, including a total of 669.331 workers in 31st December of 2017 (DGAEP - Direção-Geral da Administração e do Emprego Público, 2018), with different personalities and characteristics.
Thus, it is important to be able to find patterns to comprehend why a PPA’s employee do not show up to work, as well as drawing a profile of the most absent worker, in order to provide the human resources department substantiated information so that they can accomplish the efficiency desired.
There is research about human resources management (Armstrong, 2014), the absenteeism (Schaufeli, Bakker, & van Rhenen, 2009) and even the Portuguese public sector (Carvalho & Bruckmann, 2014), as well as, data mining (Wu, Zhu, Wu, & Ding, 2014) and its application in various areas (Moro, Rita, & Vala, 2016); however, there is a lack of studies about predicting the absenteeism in the PPA, while comparing the ideas supported by human resources studies’ authors with the results obtained. Consequently, this research aims to fill in this gap as well as to provide public organizations some indicators that might identify a more likely longer absent worker based on his/her profile. Effectively, through this study, understanding PPA’s absenteeism, what leads to it, as well as explaining it, by creating a data mining model that fits the problem, is the main objective and what determines if it a was successful dissertation or not.
This study focuses on modeling the number of consecutive days a worker is absent, thus aiming to predict it based on the motive of the absence, the worker’s absenteeism history, its profile and its job specificities. Through data mining, models are tested to best fit the data collected, around 59,000 records of absences.
The second section of this study is focused on the theoretical background that supports all the assumptions and comparisons of this research. Data mining models as well absenteeism causes and consequences are explained. After that, the spotlight is on the collected dataset and its attributes along with the obtained results. To conclude, a comparison between the results found and absences causes identified in the theoretical background is made, to provide evidences for a better decision making.
3
1.3 Review method
To determine the quality of references and state of the art concerning the object of study, the protocol for the systematic review developed by Dybå & Dingsøyr’s (2008) was undertaken. The criteria for considering studies for review, were as follows:
• Types of studies: Articles to be included in the review must present empirical data and pass the minimum quality threshold described below.
• Types of participants: Studies of both students and recognized figures on the scientific community will be included.
• Types of intervention: Inclusion of studies will not be restricted to any specific type of intervention.
The search strategy for identification of studies will include articles published on the primary journals, primarily preference for Scopus Q1 journals, followed by Q2, Q3 and Q4, in this order, and textbooks, from the last five years, except for very specific question, which might imply then need to go back some years in order to get a valid insight for the study.
Scopus was selected to find relevant literature, since it is generally accepted as bibliographic database to find indexed publications, and queries were applied to conduct and narrow the search. The queries included the Boolean expression AND implying that any article must contain all the expressions used. If the outcome revealed few results, the Boolean expression OR will substitute ANDs to increase the spectrum of search. The OR expression implies that any article should contain at least one of the expressions. The terms used to conduct this search were absenteeism, public sector, data mining, stress, recency frequency monetary value and public administration. Some variations were used to find a satisfactory number of relevant articles needed for this study.
It was also followed some conditions to cover the three main quality issues (rigor, credibility and relevance) that need to be considered when appraising the studies of this research (Dybå & Dingsøyr, 2008). Each article was assessed according to whether:
i. the aims and objectives are clearly reported;
ii. there is an adequate description of the context in which the research was carried out; iii. there is an adequate description of the sample used and the methods for how the
sample was identified and recruited;
4 v. the study provides clearly stated findings with credible results and justified
conclusions;
vi. the study provides value for research or practice.
Together, these criteria should provide a measure to extend the confidence on a specific study’s findings as a valuable contribution to this review.
5
2. Theoretical background
Following the main objectives, theoretical background encompasses themes such as human resources and absenteeism, public services, where it will be specified the reforms that Portugal has been through, as well as some public labor characteristics, and data mining literature review, applied to the human resources and to the public sector.
2.1 Human resources and absenteeism
Employee absences are both costly and disruptive for business, and the trend has been increasing steadily over the years. Personal illness and family issues are cited as the primary reason for unplanned absences. Illness, family responsibilities, personal issues and stress all take a toll on the worker which in turn affects morale, absences and productivity in the workplace (Kocakülâh, Kelley, Mitchell, & Ruggieri, 2016). Employers have been attempting to determine the validity of these illnesses, incentives and propose possible solutions to mitigate these absences, including those caused by family issues.
The U.S. service sector alone loses 2.3% of all scheduled labor hours to unplanned absences, but in some industries, the total cost of unplanned absences approaches 20% of payroll expense. The principal reasons for unscheduled absences (personal illness and family issues) are unlikely to abate anytime soon (Eastont & Goodale, 2005). In 2002, personal illness accounted for 33 percent of unscheduled absences. The three most common reasons for unscheduled absences are personal illness (33%), family issues (24%), and personal needs (21%). Stress as a reason for absenteeism has increased over 300 percent since 1995 (Kim & Garman, 2003).
Although personal illness is a common reason for not coming to work, as Kocakülâh et al. (2016) stated, companies are now attempting to determine whether the employee is actually sick when they call in. Effectively, there are studies such as the one conducted by Hughes and Bozionelos (2007) on a sample of male workers employed as bus drivers, where interviewees confessed that many bus drivers, including themselves, consistently fake illness or sickness in order to be able to participate in and take care of important non-work activities and obligations. For example, one driver noted: “There would be no
6 chance [to be granted permission for time off] ... even for a funeral... people end up going on the sick.”.
On the other hand, as McHugh (2001) stated in his study, interviewees attributed the low absence statistics within their organizations to the fact that the organization is located in a small town where employees are exposed. This tends to make it more difficult for individuals to fake sickness.
Similarly, family issues also play a crucial role in absenteeism. Balancing work and family life can be a struggle in a way that there are plenty of studies about work–family conflicts and how it affects absenteeism and job satisfaction (AlAzzam, AbuAlRub, & Nazzal, 2017; Anafarta, 2011; Vignoli, Guglielmi, Bonfiglioli, & Violante, 2016). Childcare is often a major issue, as Payne et al. (2012) pointed, without childcare, most parents are unable to work, so if parents are not satisfied with their childcare arrangements, they may not be able to fully engage in their work, which should cause concernment in employers about the adequate childcare and parents’ satisfaction.
In addition, as Calvano stated (2013), who has cared for frail, ill, or disabled elders while working knows that juggling the two roles can be complicated, daunting, and laden with practical and emotional challenges. Katz and colleagues (2011) found that caregivers experienced a disruption in their work functioning due to absenteeism. Interestingly, eldercare negatively affects women’s employment across the European Union, with the greatest effect in Southern Europe and the least in Nordic countries and Central Europe in between (Kotsadam, 2011).
When talking about personal needs, it is critical that individuals seek periodic medical attention, including regularly scheduled “healthy” checkups, as it’s proven that maintaining health behaviors and having good health status were associated with less absenteeism (Yun, Sim, Park, Park, & Noh, 2016). Even though, the law (Portuguesa, 2017a) establishes that the public employer has a duty to provide good working conditions and to prevent occupational risks and diseases, taking into account the protection of workers' safety and health, there is no obligation to schedule these checkups. So, it is often difficult for individuals to work a full day and be able to schedule a needed doctor’s appointment that does not interfere with their scheduled work day, costing both worker and employer much needed time, which can never be recovered (Kocakülâh et al., 2016).
7 Finally, it is needed to refer stress as a cause to absenteeism. Employees who are suffering from stress at work are less likely to be productive (Kim & Garman, 2003). The causes of stress, or the stressors, are numerous and can be found anywhere in the workplace. Psychosocial work stressors such as job strain, low decision latitude, low social support, high psychological demands, effort-reward imbalance, and high job insecurity have all been implicated as causes of work stress-related anxiety and depressive illnesses (Stansfeld & Candy, 2006). Furthermore, stress at work also can lead to physical illness, psychological distress and illness, and sickness absence (Jordan et al., 2003). Alongside these, Hauge et al. (2010) demonstrated that workplace bullying is a potent social stressor that is negatively associated with both individual well-being and work-related outcomes, with consequences similar to and even stronger than those of other more frequently studied job stressors. All of this culminates into lowering morale among employees and lowering productivity because of poor performance (Haswell, 2003). Interestingly, burnout, resulted by stress, might explain the relationship between job satisfaction and absenteeism, when referring to total time lost, but not for absence frequency (Ybema, Smulders, & Bongers, 2010). Consequently, stress, depression, or anxiety accounts for 46% of days lost due to illness, according to Cooperand are the single largest cause of all absences attributable to work-related illness. Likewise, stress can, in its turn, lead to seeking alternate employees, which costs the employer money in the form of recruitment and training. What’s more, stress can overburden co-workers with additional responsibilities while replacement personnel are hired. This can lead to a heavier workload for already distraught employees, which affects their health and eventually results in even more absenteeism (Haswell, 2003).
Effectively, absenteeism has a large effect either directly or indirectly on a company’s bottom line. The costs associated with dealing with absenteeism are significant when everything involved is taken into account. One cannot look at just what it costs to replace the employee for a day. It is necessary to look at what it is going to cost to lighten the load and attempt to attack these ongoing ever-increasing problems in the workplace. One also has to look at the increase in corporate health benefit costs that will result if a hands-off policy is adopted and absenteeism is not taken seriously (Quinley, 2003).
To conclude, since every company is different, it will require various levels of analyses to identify the factors that impact absenteeism for a specific employer. If absenteeism is identified as a significant problem, the company will need to take a hard
8 look at the cause of the problem and begin to consider strategies to recapture lost revenues. Furthermore, as the economy tightens and the related financial stress increases for most employees, it is very likely that employers may see an increase in absenteeism due to stress related issues. The more aware a company is of issues related to employee absenteeism, the more successful they will be in implementing strategies to reduce the related cost and increase productivity (Kocakülâh et al., 2016).
2.2 Public services
2.2.1 ReformsFor the past forty years PPA has seen its rulers proclaiming reforms in all its areas of action (Madureira, 2015), from employment to public debt, going by taxes and its own structure (DGAEP - Direção-Geral da Administração e do Emprego Público, 2013).
From 2005 to 2009, Portugal was subject of a wide PA reform focused mainly on the: Structural Reorganization of State Central Administration; Reform of the Civil Service Regime; Modernization and Administrative Simplification; Modernization of Public Management, as well as the Development of e-Administration (Presidency, 2010).
The reform of the civil service regime presents the following features (Presidency, 2010):
• Progressive convergence of the Civil Service Social Protection Scheme with the General Social Security Scheme;
• Abolishment of the former general mobility mechanisms and their replacement by two new mechanisms: assignment of public interest and internal mobility. Establishment of the special mobility regime;
• Reform of the attachment, careers and remuneration scheme of staff fulfilling public functions, from which should be highlighted the following:
o Alignment with the private sector with regard to the legal employment relationship;
o The status of “civil servant” is assigned to a few, special functions related to the exercise of powers conferred by public law that safeguard the general interests of the state: Military, Foreign Affairs, State Security, Criminal Investigation, Public Protection and Inspection Activities;
9 o Reduction in the number of general and special regime careers. Establishment
of only 3 general regime careers;
o Establishment of a single pay scale made of 115 pay-steps to be used in setting workers’ basic remuneration, replacing the 22 existing pay scales with a total of 522 pay-steps.
o Replacement of a “career system” by a “position system”;
o Progressions are no longer based on seniority and career advancement and change of pay step is based on performance assessment according to available budget appropriations;
o Introduction of performance bonuses related to assessment;
• Establishment of the employment contract in public functions scheme aiming at bringing the labor legislation of PA closer to the labor regime of the private sector, highlighting collective bargaining (signing of the first two collective agreements in PA). Together with this new employment contract scheme a new disciplinary statute has entered into force;
• Establishment of an Integrated Public Administration Management and Assessment System (SIADAP) that, for the first time, is applicable to the assessment of services of respective managers and remaining staff. A percentage system (quotas) was set up for the differentiation of performance, including managers: 25% for relevant performance and, within this percentage, 5% for excellent performance. In case of the service itself obtaining the classification of excellent, the percentages for workers increase respectively to 35% and 10%.
In 2008 a financial crisis strikes in and the government sees its ideals being forced by external entities which demanded measures to be taken and directives to be followed as mentioned in Memorandum of Understanding (Troika, 2011).
Effectively, the goals set in the Memorandum, by the IMF, European Central Bank and European Commission colligation, also referred as Troika, resulted in reform measures. A lot of them being applied between 2011 and 2013 without any studies to back up their implementation (Madureira, 2015). As matter of fact, there were reforms like on the mobility regime and HR valorization that were adopted and should be explained, despite some adjustments recently (INA - Direção-Geral da Qualificação dos Trabalhadores em Funções Públicas, 2017a).
10 Although, not only is needed to understand the influence of these reforms but also why are they needed, i.e. the nature of the crisis itself. The perception of the causes of failure and the responses to those failures will reflect a number of factors (Peters, Pierre, & Randma-Liiv, 2010). One way of understanding the different responses is that they will reflect the interaction of national patterns of governance (Painter, 2010) with the real and perceived nature of the crisis within that country. Thus, the nature of the crisis may be very different in different countries. A comparative analysis of these differences is crucial for understanding the nature of the crisis and to learn from it (Peters et al., 2010).
To conclude his study, Peters et al. (2010) stated, the various responses to the crisis across the range of industrialized countries make the point that there has been no new paradigm for governance emerging as a result of the crisis. This absence of a paradigm appears to result from at least three broad factors: the crisis has been perceived differently in different settings; the different starting points for the different regimes have meant that the policy and governance options available to them were very different, having a new paradigm requires new ideas and those appear to have been in rather short supply.
2.2.2 Labor mobility
As the Ministry of the Presidency (2010) mentioned, the mobility regime includes two patterns, General Mobility (GM) and Special Mobility (SM), also known as professional valorization (INA - Direção-Geral da Qualificação dos Trabalhadores em Funções Públicas, 2017a).
The GM regime consists of transitional modification of functional situation of the worker, within the same body or service, or between different bodies or services, based on grounds of public interest, targeting to increase effectiveness of services by way of a rational use and valuing of Public Administration human resources (Presidency, 2010).
The SM regime has been defined to frame processes for the abolishment, merger and restructuring of public services. Likewise, a general regime for the staff rationalization process has been laid down in situations where human resources assigned to some services are mismatched with regard to permanent needs and the pursuit of the objectives (Presidency, 2010). In order to maximize the full productivity of the workers, it seeks to meet the needs identified by the different bodies and services, promoting the professional valorization of the workers, through standardized training and ensure the resumption of
11 functions by integration, in a period of 3 months (INA - Direção-Geral da Qualificação dos Trabalhadores em Funções Públicas, 2017b).
Additionally, mobility can be external or internal, always presupposing the existence of a public interest. On one hand, external mobility, also called as a public interest cession, occurs when mobility is from public entities to private entities, or by public entities not covered by GLPAE, or vice-versa. On the other hand, internal mobility covers workers who have a legal relationship of public use, for an indefinite period, and can be operated between public entities not belonging to the GLPAE. In this case, there are two situations to consider: mobility in the same category and mobility intercarrier or categories (between different ones) (INA - Direção-Geral da Qualificação dos Trabalhadores em Funções Públicas, 2017c).
To conclude, these regimes had, and still have, an important role in the PPA, noticing that, according to public employment statistics, there were 1176 workers, in December of 2011, placed in the valorization regime, and, in September of 2017, that number dropped to 323 workers (DGAEP - Direção-Geral da Administração e do Emprego Público, 2017b), meaning that there were a significant amount of workers who did not get unemployed, which has been, as referred before, a big deal in Portugal, because of these reforms. Additionally, as Boswell et al. (2005) proved that, for a 5-year period, low satisfaction would precede a voluntary job change, which is followed by an immediately increase in job satisfaction (the honeymoon effect), even though there is a decline in job satisfaction after (the hangover effect), and as demonstrated in Ybema’s et al. (2010) study, individuals who are dissatisfied with their jobs are more likely to be frequently absent in future. It’s possible to infer that mobility might influence positively absenteeism.
2.2.3 Contract of Employment characterization
According to the 11th article, Contract of Employment (CE) is the contract in which a person undertakes, through retribution, to provide his or her activity to another person or persons, within the organization and under their authority (Portuguesa, 2016);
However, it is presumed that the parties have concluded an employment contract if it has some of the following characteristics, according to the 12th article (Portuguesa, 2016):
12 • activity carried out in a place belonging to or by the beneficiary has been
determined;
• the equipment and work tools used belong to the beneficiary of the activity; • the provider of the activity complies with times determined by the beneficiary of
the activity;
• a certain amount is paid to the provider of the activity as a consideration thereof; • the provider of the activity performs managerial or managerial functions.
Effectively, according to the 6th article, the work in public functions may be provided through the CE, being this the one by which a natural person provides his activity to a public employer, in a subordinate manner and for remuneration. The public employment link has the following modalities (Portuguesa, 2017b):
a) Contract of employment in public functions, which is, usually, the main public employment link, according to the 7th article;
b) Appointment; c) Service commission.
Thus, the bond of public employment may be constituted for an indefinite period or for a definitive term (Portuguesa, 2017b).
On one hand, according to the 8th article, the public employment link is constituted by appointment in the cases of exercise of the following functions (Portuguesa, 2017b):
a) Generic and specific missions of the Armed Forces in permanent staff; b) External representation of the State;
c) Safety information; d) Criminal investigation;
e) Public security, both in the free environment and in an institutional environment; f) Inspection.
On the other hand, the public employment link is constituted by service commission in the following cases, as stated in the 9th article (Portuguesa, 2017b):
a) Positions not included in careers, namely positions of leadership;
b) Functions exercised with a view to acquiring specific training, academic qualification or professional title per employee with public employment bond of indefinite duration.
One empirical variation of these contracts was studied by Chatterji (2002) that extended the analysis of absence and sick pay by considering the impact on productivity
13 of work attendance by sick workers, also called as presenteeism. The resulting contract embodies a richer complex of incentive compatibility considerations, which involves firms offering: a wage that is strictly higher than sickness pay offer and a sickness pay that is strictly positive. In addition, the results showed that the typical reaction to lower sickness pay in order to reduce absenteeism, may have another outcome, resulting in greater presenteeism instead.
2.2.4 Worktime schedule
According to the nature of their activities, services may adopt, with regard to workers on an appointment regime, the following patterns of working hours (Portuguesa, 2017b): a) Flextime – are those enabling workers to manage their working hours, by choosing the beginning and end working hours, complying with the previously established fixed core morning and afternoon working hours;
b) Fixed working hours – are those which are divided by two daily periods, with beginning and end fixed hour, separated by a rest break;
c) Staggered working hours – are those enabling establish, service by service or by groups of workers, different fixed beginning and end working hours, while maintaining unchanged the daily work period;
d) Shift working hours- are those in which, for need of regular and normal operation of the service, there is the performance of work in, at least, two daily and successive periods, being each one of them of duration not lower than the daily average work duration;
e) Continuous journey working hours – are those in which are uninterrupted work, except for a rest period of no more than thirty minutes, which for all purposes is considered as working time;
f) Half journey working hours – are those which are known as part-time work and it consists in the provision of work in half of the normal full-time working schedule; g) Specific working hours – are those which are envisaged to adjust to workers’
needs or of his/her members of the family (i.e. student-worker).
According to the 109th article, the typical daily work period is interrupted by a rest break of duration not lower than one hour nor higher than two hours, except in duly grounded exceptional cases, so as workers do not perform more than five hours of consecutive work, save in case of continuous work (Portuguesa, 2017b).
14 In the employment contract for public functions a model of working hours was not set. Instead, it was left to public employer entities upon consultation of the workers’ representative entities and works councils or in the default of these ones the inter-trade union commissions, trade union commissions or trade union representatives (Presidency, 2010).
Referring to the 105th article, the law maker set the limits of duration of the daily normal work period (7 hours) and weekly (35 hours), as well as the interruption for the rest break so as to ensure a performance of work not higher than 5 consecutive work hours (Portuguesa, 2017b).
These issues may the subject of change by collective labor regulation instrument, enabling, for example, reduction of the rest break and reduction or increase of the work period (Presidency, 2010).
Evidence suggests that flextime appears to lower the incidence of tardiness, although the reduction appears to be significant only for women employees (Ala-Mursula, Vahtera, Kivimaki, Kevin, & Pentti, 2002). Another benefit of flexible work scheduling in the form of flextime is decreased absenteeism (Casey & Grzywacz, 2008). Employers seem to benefit when employees have working time autonomy to the extent that more flexible working time arrangements reduce absenteeism if they facilitate the combination of paid work with other activities. In the longer term, they may further decrease absenteeism by also improving worker health, through reduced stress and increased job satisfaction (Possenriede, 2011).
2.2.5 Absences
A major source of cost savings for organizations is lower rates of absenteeism (Kelly et al., 2008; Kossek & Hammer, 2008). As Golden (2011) stated, rates of absenteeism are one indicator of employee commitment that affects organizational productivity. Effectively, in the United States there is little variation between industries, although the absence rate is highest in public sector (especially education and health) jobs and lower in construction.
De Paola et al. (2014) also studied absenteeism in public sector, specially the effects of an Italian policy intervention reducing sick leave compensation and increasing the monitoring of the health status of absent employees in the absenteeism. Interestingly, the
15 reform started to change civil servants’ behavior before its effective implementation. Effectively, they discovered that workers’ probability of taking days off work for sick leave decreased strongly (the estimated effect was of about 53%) once the reform was effectively implemented. The authors also found that absence behavior is responsive both to wage reductions and to changes in monitoring intensity.
This study will explore different kinds of absences and, in order to understand them, the next section will explain the differences between licenses/leaves, unplanned absences and vacations.
2.2.5.1 Licenses and leaves
According to the 34th article, in the scope of protection to parenthood releases are also granted to cope with the need of absence of parents in following situations (Portuguesa, 2016):
• Prenatal consultations; • Breastfeeding and nursing;
• Release for assessment for adoption;
• Release from performance of work in the night period;
• Release from performance of work by pregnant worker, worker who has recently given birth or breastfeeding worker, on grounds of protection of her safety and health;
It is important to remark these absences do not impact the workers’ rights, namely their salary, unlike the unjustified leaves (Portuguesa, 2016).
Although, there are other leaves in which total loss of remuneration is verified, such as (Presidency, 2010):
• Leave up to 90 days; • Leave for one year; • Extended leave;
• Leave for accompanying spouse placed abroad;
• Leave for performing functions in international organizations; • Leave for the performance of functions in trade union association; • Leave for attendance of training courses;
16 • Non-specified leave.
Regarding releases, another pattern is provided in the PPA. It consists of granting workers release from appearing in the service, that, in a determined working day are bound to the duty of assiduity. It is not regarded as holiday, it does not suspend holidays and workers who are enjoying holidays are not entitled to an extra day of holiday for compensation. For example, at 12th of May of 2017, due to Pope’s visit to Portugal, the PPA’s workers could decide to not show up to work without repercussions in their salaries (Primeiro-Ministro, 2017).
Note that as Ziebarth’s (2013) study suggested that cuts in statutory sick pay did not significantly affect the incidence of long-term absenteeism. Employees did not significantly adjust their long-term sick leave behavior on the decision to enter an episode of term sick leave. As for the effects on the decision to reduce the length of the long-term sick leave episodes, the models also produced mostly insignificant and small, but negative, reform effects. However, for two subsamples, the poorer half of the sample as well as middle-aged employees working full-time, the findings suggest that cutting long-term sick pay may have reduced the length of such absences significantly.
2.2.5.2 Unplanned Absences
According to the 133rd article, an employee is absent when not present in the work place during the normal worktime schedule. If the absence is inferior to the normal worktime schedule, then the nonappearance durations are add up, respectively, to determine the absence period (Portuguesa, 2017b).
In the same article, there is a mention to the difference between justified and unjustified absences. The justified absences are the following (Portuguesa, 2017b):
a) Those given, for 15 consecutive days, at the time of marriage; b) Those motivated by the death of the spouse, relatives or alike;
c) Those motivated by the provision of evidence in an educational establishment; d) Those motivated by the impossibility of providing work when is not attributable
to the worker, namely the observance of medical prescription following the use of medically procreative technique assisted, illness, accident or fulfillment of legal obligation;
17 e) The one motivated by the provision of urgent and essential assistance to the child,
grandchild or member of the household of the worker;
f) Those motivated by the transfer to educational institution responsible for the education of minor, by reason of the educational situation, for the strictly necessary time, up to four hours per quarter, for each minor;
g) Those of worker elected to the collective representation structure of the workers, in accordance with 316th article;
h) Those given by candidates for elections to public office, during the legal period of their election campaign, in the terms of the corresponding electoral law; i) Those motivated by the need for outpatient treatment, medical consultations and
complementary tests which cannot be carried out outside the normal working hours and only for the time strictly necessary;
j) Those motivated by prophylactic isolation; k) Those given for blood donation and rescue;
l) Those motivated by the need to submit to selection methods in insolvency proceedings;
m) Those given on account of the period of leave; n) Those that by law are considered as such.
Naturally, all the others not mention above are considered as unjustified absences (Portuguesa, 2017b).
Easton and Goodale (2005) studied the unplanned absences and strategies to recover from them. They found that the reduction in total profits due to absenteeism is strongly influenced by the staffing strategies and absence recovery policies that firms adopt to cope with absenteeism. Forty-hour work weeks and zero anticipated absenteeism with holdover absence recovery appears to be a fairly robust combination, on average reclaiming nearly 60% of the profit consumed by unchecked absenteeism. For firms unwilling or unable to implement active absence recovery policies, however, planned overtime staffing strategies with absence anticipation appear less vulnerable to absenteeism.
Another study suggests that, there is a strong positive relationship between the generosity of granting sick leave days and days of absenteeism. Furthermore, the results showed that there is a positive relationship between income differences of neighboring states and sick leave days. Which can be interpreted as an evidence that employees of
18 lower income countries in the OECD, like Portugal, have an incentive to report in sick on their regular job and, instead, work in the unofficial market of the high-income neighbor state (Osterkamp & Rohn, 2007).
2.2.5.3 Vacations
Despite being an absence, vacations according to 237th article of Employment Contract, holidays constitute a right that cannot be waived by the worker and its enjoyment shall not be replaced by any economic compensation whatsoever (Portuguesa, 2016), which is why it will not be considered when creating the data model to forecast absenteeism. In the same article it is mentioned that the right to holidays is obtained on the 1st January of each calendar year and is related to, as a rule, the service performed in the preceding calendar year (Portuguesa, 2016).
Referring to the 238th article, each worker is entitled to a minimum holiday period of 22 remunerated working days (Portuguesa, 2016). The minimum holiday period may still be increased in the framework of performance rewarding systems, without prejudice to increases granted to each job attachment (Portuguesa, 2017b).
The worker is entitled to a holiday allowance, as mentioned the 152nd article, which value is the same as the salary. The aforementioned should be paid in June or together with the salary of the month just before the vacation’s enjoyment month (Portuguesa, 2017b).
Although vacations will not be considered as an absence, it is important to note that, as Westman and Etzion (2001) stated in their study, vacations alleviated perceived job stress and thus also the experience of burnout. However, the most notable contribution of the study was the finding of a respite effect on a behavioral strain, the absenteeism, measured objectively. It was found that absenteeism for non-health reasons decreased after vacation, which implies that taking a vacation can be regarded as a stress management technique. As such, it corroborates findings concerning the beneficial effects of stress management intervention on burnout and absenteeism. Thus, in order to decrease absenteeism, the organization should try to regulate vacations according to stressful periods.
19
2.3 Human resources and data mining
As Bernik et al. (2007) stated, we are now in the knowledge era. Thus, the basic element of HR research is the acquirement of knowledge. The amount of information currently available is huge and the problem of the HR management is mainly the filtering and integration of information. Numerous scholars in the area of HR management that delved in this problem have reached the conclusion that it is not only the acquirement of information, but mostly its management, stemming from the fact that information is one of the basic resources of every organization. Like an organization manages material, human and other resources, it also manages the information that flow either within the company or outside. Because of that, information management has recently become one of the priority tasks of HR management (Bernik et al., 2007).
In this context, data mining techniques can be used to extract and discover the valuable and meaningful knowledge from a large amount of data. Additionally, among the major tasks in data mining are classification and prediction, concept description, rule association, cluster analysis, outlier analysis, trend and evaluation analysis, statistical analysis, and others. Classification and prediction tasks are among the popular tasks in data mining, widely used in many areas especially for trend analysis and future planning (Jantan, Hamdan, & Othman, 2010).
As matter of fact, there are many areas which adapted such approach to solve their problems such as in finance (Cowan, 2002), tourism (Moro, Rita, & Oliveira, 2018), medical and engineering (Kusiak, Kernstine, Kern, McLaughlin, & Tseng, 2000), marketing (Silva, Moro, Rita, & Cortez, 2018), telecommunication (Verbeke, Dejaeger, Martens, Hur, & Baesens, 2012), customer relationship (Chen, Wu, & Chen, 2005), social media (Moro et al., 2016), among others. Nevertheless, data mining application has not attracted much attention from people in HR field (Chien & Chen, 2008). In fact, prediction applications are mainly developed in business and industrious fields and quite restricted studies involved human talent in an organization (Jantan, 2009). HR data can provide a rich resource for knowledge discovery and for decision support system development (Jantan et al., 2010).
Regardless of the location, the HR database mostly contains data on the employee and the job position that are sorted into these categories (McLeod & Sanctis, 1995):
20 • Data on professional, work related and personal development;
• Data on work and job performance; • HR social data;
• Work safety data, data on managerial and societal activities of the employees. In fact, this study is based on a dataset where the information about the employee and its job is sorted just like McLeod and Sanctis (1995) mentioned.
2.4 Data mining and public sector
Finding useful patterns in data has been given, through the years, a lot of names, one of those being data mining. Typically used by statisticians, data analysts, and the management information systems communities, data mining gained its popularity in the database field (Fayyad & Uthurusamy, 1996).
For the past few years, the uncontrolled growth of database brought data mining to the forefront of new business technologies. Estimates show that double of the world’s data is being stored every 20 months, which creates a big opportunity for the increase of data mining use (Witten, Frank, & Hall, 2016).
Nowadays, with the world’s complexity growing day by day, data should be intelligently analyzed so it can lead to new insights, better decision making and competitive advantages (Witten et al., 2016).
Effectively, within the public sector the same problem resides, as the need to have tools in order to dig through huge collections of data, often referred as “official data”, are needed to recognize trends or patterns (Antti, Syvajarvi, & Stenvall, 2010).
Mining public sector’s data is crucial to evaluate public programs and investments, for example in social security, health and economic growth (Antti et al., 2010). Although, a major concern is always brought up, which is the balance between managing personal information, respecting its privacy, as well as data integrity and data security, and maximizing the available information for general policy purposes (Antti et al., 2010).
In order to performance’s measurements requirements are met, policy makers see themselves studding a mix of different types of information and making decision based on that (Hamlin, 2007). Although, with insufficient high-quality data and available
21 information as well as high-stakes pressures to demonstrate organization improvements, the data for these purposes is still more likely to be misused and manipulated.
It is certain that organization and government activities confront requirements like predicting and forecasting (Antti et al., 2010), so this study shall give them some conclusions to support their next decision, as other studies about that used data mining in the public sector tried to do (Cleary, 2011; Durairaj & Ranjani, 2013; Moro, Cortez, & Rita, 2014).
2.4.1 Support vector machines
The foundations of SVMs have been developed by Vladimir Vapnik (1995) and are gaining popularity due to many attractive features, and promising empirical performance. The formulation embodies the SRM principle. SVMs were developed to solve the classification problem, but recently they have been extended to the domain of regression problems (for prediction of continuous variables). SVMs can be applied to regression problems by the introduction of an alternative loss function that is modified to include a distance measure. The term SVM is referring to both classification and regression methods, and the terms Support Vector Classification (SVC) and Support Vector Regression (SVR) may be used for more precise specification (Kantardzic, 2011).
As Kantardzic (2011) mentions in his book, an SVM is a supervised learning algorithm creating learning functions from a set of labeled training data (Figure 2). It has a sound theoretical foundation and requires relatively small number of samples for training; experiments showed that it is insensitive to the number of samples’ dimensions. Initially, the algorithm addresses the general problem of learning to discriminate between members of two classes represented as n-dimensional vectors. The function can be a classification function (the output is binary) or the function can be a general regression function.
22
Figure 1 - Fitted versus actual values for both linear regression and SVM
(Guenther & Schonlau, 2016).
An SVM includes a set of techniques which produces nonlinear boundaries by constructing a linear boundary in a large, transformed version of the feature space (Hastie, Tibshirani, & Friedman, 2009). Essentially, what occurs is that through the usage of a kernel, an approximation function, and addition of a loss function, the hinge loss function, the desired outcome is optimized. The jumbled data in the input space takes form into a separating hyper plane, the feature space, which will be easier to analyze because the data becomes structured and, therefore, further analysis is made possible until it develops into intelligible information (Silva, 2016).
2.4.2 Recency, frequency and monetary value (RFM)
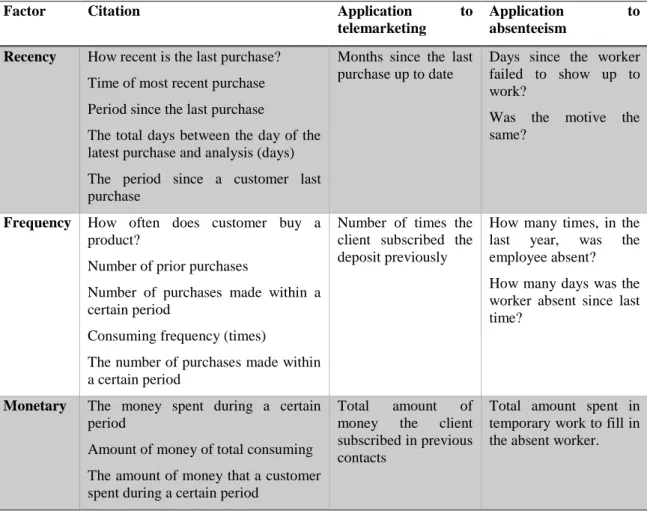
As mentioned by Moro et al. (2015), one way of characterizing a database of customers is by computing their recency, frequency and monetary (RFM) characteristics. These allow to capture customer behavior in a very small number of features (Table 1). Still, the relative importance among RFM varies with the characteristics of the product and industry (Moro et al., 2015). As matter of fact, feature weight has been a subject of research in order to improve classification accuracy (Ahn, Kim, & Man, 2006). Actually, there are already some studies to determine the relevance of each of the three RFM features like the use of the K-means algorithm to build clusters by RFM attributes (Cheng & Chen, 2009), the analytic hierarchy process to determine the relative weights of RFM (Liu & Shih, 2005), and measuring loyalty through a user’s RFM and a smart object that attributes weights to RFM features based on its goal (Kwon & Lee, 2011).
23
Table 1 - Adapted RFM telemarketing features analyzed
(Moro et al., 2015)
Based on the Moro’s (2014) telemarketing RFM approach, in the present study it will be studied the historic variables which reflects the worker’s behavior (contrasting with the consumer behavior used in telemarketing study), using recency as well as frequency, in order to get the most accurate model for the absenteeism in PPA.
If the model’s results turn out to be positive, it may open the door to use this the RFM features in other areas than customer-oriented subjects like marketing or sales.
2.4.3 Regression performance metrics
According to Moro et al. (2016), one of the crucial steps in model building is assessing its adequacy in predicting what it is supposed to. As matter of fact, if one model fails to predict its output then it is inadequate (Diebold & Mariano, 2002). Which brings out the importance of forecast accuracy since the derived forecasts are used for guiding decisions-making (Moro et al., 2016).
Factor Citation Application to
telemarketing
Application to absenteeism
Recency How recent is the last purchase? Time of most recent purchase Period since the last purchase
The total days between the day of the latest purchase and analysis (days) The period since a customer last purchase
Months since the last purchase up to date
Days since the worker failed to show up to work?
Was the motive the same?
Frequency How often does customer buy a product?
Number of prior purchases
Number of purchases made within a certain period
Consuming frequency (times)
The number of purchases made within a certain period
Number of times the client subscribed the deposit previously
How many times, in the last year, was the employee absent? How many days was the worker absent since last time?
Monetary The money spent during a certain period
Amount of money of total consuming The amount of money that a customer spent during a certain period
Total amount of money the client subscribed in previous contacts
Total amount spent in temporary work to fill in the absent worker.
24 Thus, there are some metrics to measure the accuracy of the forecasts, as Witten (2016) mentioned, such as the mean-squared error, which is one of the most commonly used measure, because it tends to be the easiest measure to manipulate mathematically. The Mean Absolute Error (MAE) is an alternative: just average the magnitude of the individual errors without taking account of their sign. Mean-squared error tends to exaggerate the effect of outliers—instances whose prediction error is larger than the others—but absolute error does not have this effect: all sizes of error are treated evenly according to their magnitude (Witten et al., 2016). Thus, in this study the MAE is chosen as one of those metrics to measure the model performance.
From the MAE value, it is possible to get another perspective of the deviation in predictive capacity of the model and that’s by using the mean absolute percentage error (MAPE), the other metric that will be used to evaluate the model.
𝑀𝐴𝐸 = 1
𝑛 ∑|𝑦𝑜𝑏𝑠𝑒𝑟𝑣𝑒𝑑 − 𝑦𝑝𝑟𝑒𝑑𝑖𝑐𝑡𝑒𝑑|
Effectively, MAPE is the ratio of the MAE divided by the total of true values, e.g. it is the relative variation to those values and it can only be applicable if the actual value, of the predicted one, is greater than 0, otherwise the calculation is impossible (Moro et al., 2016). 𝑀𝐴𝑃𝐸 = 100 ×1 𝑛∑ |𝑦𝑜𝑏𝑠𝑒𝑟𝑣𝑒𝑑− 𝑦𝑝𝑟𝑒𝑑𝑖𝑐𝑡𝑒𝑑| 𝑦𝑜𝑏𝑠𝑒𝑟𝑣𝑒𝑑 2.4.4 Sensitivity analysis
It is often a challenge to extract knowledge in a way that is easy to understand, specially from a black box model, which lead to a new stream of research to tackle this problem. Therefore, methods like extracting rules from networks and the sensitivity analysis have emerged.
As Saltelli et al. (2002) mentioned, SA is the study of how the uncertainty in the output of a model (numerical or otherwise) can be apportioned to different sources of uncertainty in the model input. Therefore, SA is considered as the study of the relative importance of different input factors on the model output.
SA has been mostly used as a variable/feature selection method (e.g. to select the least relevant feature that is deleted in each iteration of a backward selection). However, SA
25 can also be used to explain the model, as recognized in but more explored in and, thus, opening the black box (Cortez & Embrechts, 2011).
There are several types of algorithms to choose from within SA. The one chosen for this study is the data-based sensitivity analysis, mainly due to its capability of detecting input variable interactions. Effectively, DSA uses training samples and its’ main goal is to harvest the possible interactions between inputs, while speeding up if a proportion of the training samples (randomly selected) are used instead of the whole training set (Cortez & Embrechts, 2013).
Although, it is important to recognize that the sensitivity of the parameter in the equation is what is being determined, not the sensitivity of the parameter in nature. If the model is wrong or if it is a poor representation of reality, determining the sensitivity of an individual parameter in the model is a meaningless pursuit (Pilkey & Pilkey-Jarvis, 2009).
26
3. Materials and methods
3.1 CRISP-DM
Over the last few years, the field of data mining became very important for different industries, co-corporations and businesses because of its ability to use huge amount of data that had previously no use and to analyze and predict trends and patterns (Shafique & Qaiser, 2014). Essentially, the risk of wasting the wealthy and valuable information contained by the big databases was arise and this requires the use of adequate techniques to get useful knowledge (Chen, Han, Yu, & Han, 1996) so that the field of data mining had been emerged in 1980’s and is still making progress. With the emergence of this field different process models were introduced. These process models guide and carry the data mining tasks and its applications (Shafique & Qaiser, 2014). One of these models it will be used in this study and it’s called as CRoss-Industry Standard Process for Data Mining (CRISP-DM).
Effectually, CRISP-DM is a popular methodology for increasing the success of DM projects (Chapman et al., 2000). The methodology defines a non-rigid sequence of six phases, which allow the building and implementation of a DM model to be used in a real environment, helping to support business decisions (Moro, Cortez, & Laureano, 2011) (Figure 2).
Figure 2 - The CRISP-DM process model, adapted from Moro et al. (2011)
According to Moro and Laureano (2011), CRISP-DM defines a project as a cyclic process, where several iterations can be used to allow final result more tuned towards the
27 business goals. Effectively, this cycle goes through the following phases (Figure 3) (Wirth, 2000):
• Business Understanding - This initial phase focuses on understanding the project objectives and requirements from a business perspective, and then converting this knowledge into a data mining problem definition, and a preliminary project plan designed to achieve the objectives.
• Data Understanding - The data understanding phase starts with an initial data collection and proceeds with activities in order to get familiar with the data, to identify data quality problems, to discover first insights into the data, or to detect interesting subsets to form hypotheses for hidden information.
There is a close link between Business Understanding and Data Understanding. In fact, the formulation of the data mining problem and the project plan require at least some understanding of the available data.
• Data Preparation - The data preparation phase covers all activities to construct the final dataset (data that will be fed into the modeling tool(s)) from the initial raw data. Data preparation tasks are likely to be performed multiple times, and not in any prescribed order. Tasks include table, record, and attribute selection, data cleaning, construction of new attributes, and transformation of data for modeling tools. In this context, Witten described data as concepts (what needs to be learned), instances (independent records related to an occurrence) and attributes (which characterize a specific aspect of a given instance) (Witten et al., 2016); • Modeling - In this phase, various modeling techniques are selected and applied,
and their parameters are calibrated to optimal values. Typically, there are several techniques for the same data mining problem type. Some techniques require specific data formats.
• Evaluation - At this stage in the project you have built one or more models that appear to have high quality, from a data analysis perspective. Before proceeding to final deployment of the model, it is important to more thoroughly evaluate the model, and review the steps executed to construct the model, to be certain it properly achieves the business objectives. A key objective is to determine if there is some important business issue that has not been sufficiently considered. At the end of this phase, a decision on the use of the data mining results should be reached.
28 • Deployment - Creation of the model is generally not the end of the project. Usually, the knowledge gained will need to be organized and presented in a way that the customer can use it. Depending on the requirements, the deployment phase can be as simple as generating a report or as complex as implementing a repeatable data mining process. In many cases it will be the user, not the data analyst, who will carry out the deployment steps. In any case, it is important to understand up front what actions will need to be carried out in order to actually make use of the created models.
Figure 3 - Overview of the CRISP-DM tasks and their outputs
29
3.2 Business and data understanding, and data preparation
The problem that lead to this report is, in fact, the lack of knowledge about the possible duration of an absence in the PPA, given a worker’s profile and the reason why that is a need to get off work, as well as, other information that is relevant to get a solid prediction.
With that in mind, it was extracted from HCM ERP system, which manages the human resources of seven public entities, data that will be tested in order to get a stable combination to predict the duration of the next absence, by using the error measures referred before. The two main sources of information were an absenteeism map and a query to get the most important details about the worker.
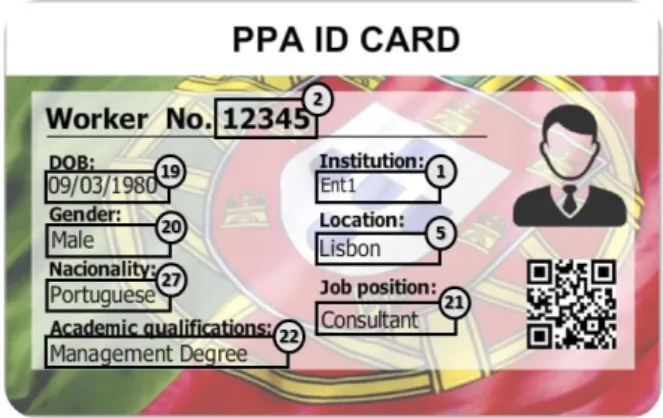
With the intention of understanding where the information was extracted, it was illustrated in the Figures 4 to 7, where it’s shown the workers’ profile and work schedule, as well as, the absence details, which resulted in the features used to create the model used to predict the number of days a worker will miss work.
Figure 4 - PPA ID Card Front