Repositório ISCTE-IUL
Deposited in Repositório ISCTE-IUL:
2020-11-10
Deposited version:
Accepted Version
Peer-review status of attached file:
Peer-reviewed
Citation for published item:
Ferreira, M. A., Keswani, A., Miguel, A. F. & Ramos, S. B. (2019). What determines fund performance persistence? International evidence. Financial Review. 54 (4), 679-708
Further information on publisher's website:
10.1111/fire.12202
Publisher's copyright statement:
This is the peer reviewed version of the following article: Ferreira, M. A., Keswani, A., Miguel, A. F. & Ramos, S. B. (2019). What determines fund performance persistence? International evidence. Financial Review. 54 (4), 679-708, which has been published in final form at
https://dx.doi.org/10.1111/fire.12202. This article may be used for non-commercial purposes in accordance with the Publisher's Terms and Conditions for self-archiving.
Use policy
Creative Commons CC BY 4.0
The full-text may be used and/or reproduced, and given to third parties in any format or medium, without prior permission or charge, for personal research or study, educational, or not-for-profit purposes provided that:
• a full bibliographic reference is made to the original source • a link is made to the metadata record in the Repository • the full-text is not changed in any way
The full-text must not be sold in any format or medium without the formal permission of the copyright holders.
Serviços de Informação e Documentação, Instituto Universitário de Lisboa (ISCTE-IUL) Av. das Forças Armadas, Edifício II, 1649-026 Lisboa Portugal
Phone: +(351) 217 903 024 | e-mail: [email protected] https://repositorio.iscte-iul.pt
What Determines Fund Performance Persistence?
International Evidence
*Miguel A. Ferreira†
Nova School of Business and Economics Aneel Keswani‡
Cass Business School - London Antonio F. Miguel§
ISCTE – Instituto Universitário de Lisboa Sofia B. Ramos**
ESSEC Business School
This version: July, 2018
* We thank Alessandro Beber, Jonathan Berk, Gordon Gemmill, Andrey Golubov, Wei Jiang, Frank de Jong, Marcin
Kacperczyk, Andrew Karolyi, Robert Kosowski, Robert Marquez, Ian Marsh, Kjell Nyborg, Benilde Oliveira, Lubos Pastor, Richard Payne, Raghu Rau, Lucio Sarno, Peter Scholz, David Stolin, Lucian Taylor and Paolo Volpin; seminar participants at Piraeus University, and the University of Sydney; and participants at the 2011 Financial Management Association meeting (Porto), the 2011 Financial Management Association meeting (Denver), the 2012 Southwestern Finance Association meeting (New Orleans), the 2012 Midwest Finance Association meeting (New Orleans), and the 2013 Northern Finance Association meeting (Quebec) for helpful comments. This research is supported by a grant from the Fundação para a Ciência e Tecnologia (FCT/PTDC/EGE-GES/112820/2009).
† Campus de Campolide 1099-032 Lisboa, Portugal; Email: [email protected] ‡ 106 Bunhill Row London EC1Y 8TZ, United Kingdom; Email: [email protected]
§ Av. Forças Armadas 1649 Lisboa, Portugal; Email: [email protected]
** ESSEC Business School, 3 Av. Bernard Hirsch B.P. 50105, 95021 Cergy Pontoise Cedex France; Email:
What Determines Fund Performance Persistence?
International Evidence
This version: July, 2018
Abstract
We study performance persistence across a global sample of equity mutual funds from 27 countries. In contrast to the existing U.S.-based evidence, we find that performance persistence is present in the majority of fund industries suggesting that fund manager skill is commonplace rather than a rarity. Consistent with the intuition that more competition in the mutual fund industry makes remaining a winner fund less likely but more probable that a loser fund will stay at the bottom of the performance ranks, we show that competitiveness explains cross-sectional variation in performance persistence.
JEL Classification: G15; G23
1 1. Introduction
Testing for fund manager persistence is important as it tells us if past performance information is helpful in predicting future fund performance, which is of value to investors, but it also tells us whether fund managers have skill. Several studies test for fund manager performance persistence using U.S. fund industry data. For example, Carhart (1997), Fama and French (2010), and Berk and van Binsbergen (2015) find evidence that there is limited performance persistence in actively managed equity mutual funds and that, what little persistence there is, is concentrated among poorly performing funds.
As the U.S. fund industry is the oldest and by far the largest fund industry (Ferreira, Keswani, Miguel, Ramos, 2013), it is not clear if the U.S.-based persistence evidence is only applicable to large and developed fund industries or can be applied universally.1 To address this, we test for
persistence using a global sample of mutual fund industries from 27 countries. This sample contains many fund industries with very different characteristics to those of the U.S. fund industry, which allows us to determine if the U.S.-based evidence on performance persistence is valid for other countries or not. The additional advantage of using a large cross-section of countries to measure persistence is that it permits us to analyze which fund industry characteristics influence industry level persistence. While there are several studies that test for performance persistence, there are few studies that try to explain what determines persistence.
We employ two methods to measure fund persistence. The first uses a regression-based
1 The literature has shown that there are economically significant differences in the conduct of mutual funds around
the world and that the stylized effects on the U.S. fund industry do not necessary translate to other countries. This includes differences in size and fees (Khorana, Servaes, and Tufano, 2005 and 2009), in the flow-performance sensitivity (Ferreira, Keswani, Miguel, and Ramos, 2012), and in performance (Ferreira, Keswani, Miguel, and Ramos, 2013).
2
approach and involves regressing fund performance in a given year on lagged performance (together with other controls that determine current fund performance) and using the coefficient on lagged performance to measure persistence. The second method measures persistence using the Spearman rank correlation between fund performance measures in adjacent years. When we run these tests we find that that there is statistically significant persistence in the majority of countries in our sample. We then investigate if persistence is the result of either persistence in the performance of the best managers or the worst managers. To ascertain this, we augment our regression-based approach by allowing the coefficient on lagged performance to vary depending on if fund performance is at the bottom or the top of the performance scale in the prior-year. We do likewise for our rank correlation measure conditioning on the level of performance in the prior-year. Our results show that persistence around the world is not solely due to persistence among poorly performing fund managers, as suggested by the existing U.S.-based evidence but is due to both the worst and best fund managers.
What factors might explain the differences in the level of persistence observed across fund industries? Two papers shed light on this. Wahal and Wang (2011) show that fund manager performance diminishes as the level of entry of new mutual funds into a sector increases.2 A
similar point is also made by Hoberg, Kumar and Prabhala (2018). They show that fund managers that face less competition within their style category are able to generate more persistent alpha. Competition is therefore a potential determinant of performance persistence as it affects how the current worst and best performing funds will do in the future.
We would expect persistence among poorly performing funds to increase in the presence of
2 According to the industrial organization literature (Cabral, 2017), the level of entry into a sector is a proxy for its
3
greater competition as these funds find it more difficult to escape from the bottom tier of performance. In contrast, greater competitive pressures make remaining a top performer more difficult. The fact that, in the U.S., the oldest and largest mutual fund industry in the world, the literature on mutual fund persistence documents that performance persistence is largely due to worst performers seems to corroborate our hypothesis (see, e.g., Carhart, 1997).3 Khorana and
Servaes (2007) and Khorana, Servaes and Tufano (2009) highlight the role of industry structure and development as determinants of the level of competition in the fund industry. They argue that older fund industries have had greater exposure to competitive forces and are therefore more competitive. In addition, Khorana and Servaes (2007) in particular show that in less concentrated industries, fund families have less market power and are therefore more competitive. Hence, we measure fund industry competitiveness using proxies for fund industry development and concentration. Our results show that persistence among losers is greater when fund industries are more competitive, while persistence among winners decreases with competition. We also show that the documented differences in persistence have an important economic effect for both poor-performing funds and top-poor-performing funds. Thus, what emerges is that fund industry competition is an important determinant of performance persistence.
Performance persistence has been studied over different horizons but the majority of studies focus on long-term persistence as this is more economically relevant for investors who are selecting mutual funds for saving purposes. The evidence on the predictability of fund performance over the long-term from past performance focuses on the U.S. fund industry.4 Brown
and Goetzmann (1995) find that abnormal performance persists but that this is mainly due to funds
4 Performance persistence has also been studied using other types of funds, including closed-end funds (Bers and
Madura, 2000), international funds (Tsai and Wu, 2015), and socially responsible investment funds (Abdelsalam, Duygun, Matallín-Sáez, and Tortosa-Ausina, 2014).
4
that underperform. Malkiel (1995) claims that survivorship bias invalidates the study by Brownand Goetzmann (1995) and, using a survivorship bias free U.S. dataset, he finds evidence of performance persistence. Hendricks, Patel, and Zeckhauser (1993) confirm the findings of Malkiel (1995) that there is persistence in U.S. funds and argue that there is a hot hands phenomenon among fund managers. Carhart (1997) overturns the findings of Hendricks, Patel, and Zeckhauser (1993) and Malkiel (1995) by showing that there is momentum in fund returns and that persistence among U.S. winner funds is due to their exposure to the momentum factor. After including momentum in his performance model, Carhart (1997) finds that persistence remains only among the worst-performing funds. Wermers (1997) also concurs with the findings of Carhart (1997) by arguing that persistence in performance is due to fund managers being exposed to the Jegadeesh and Titman (1993) momentum effect through their holdings. The findings of Carhart (1997) are confirmed by Fama and French (2010) and Berk and van Binsbergen (2015).5
Outside the U.S., the evidence on long term performance persistence is stronger. Blake and Timmermann (1998) and Otten and Bams (2002) find evidence of performance persistence in U.K. mutual funds that is due to the performance of winner funds. Keswani and Stolin (2006) also find evidence of persistence in U.K. mutual fund sectors, and show that measures of sector competitiveness can explain this persistence. Overall, the literature on fund persistence suggests that there is little persistence in the U.S., that this persistence originates from poor-performing funds, and that outside the U.S. there is evidence of persistence.
Our paper is the first to study performance persistence in an international context and
5 While all the existing studies reviewed look at longer term persistence, Bollen and Busse (2005) have also looked at
5
contributes to the mutual fund literature in a number of ways. First, we show that persistence is present in the majority of fund industries. This suggests that investors can use past performance information usefully in most fund industries to make their investment decisions, which is important in the current environment where households increasingly use mutual funds to meet long-term financial objectives such as saving for their retirement.6 Second, we show that persistence is not
solely due to poor performing funds, but is due to both top and bottom performing funds. This is relevant as existing work suggests that persistence among loser funds is the dominant form of persistence. Finally, we show that the level of competitiveness of fund industries explains the levels of persistence we observe in fund manager performance.
2. Sample and data description
Data on equity mutual funds from 27 countries in the 2001-2010 period come from the Lipper survivorship bias-free database. The Lipper database provides data on the returns of each share class after expenses and loads, and treats each fund class as if it were a separate fund. To prevent double-counting of funds, we use the share class that Lipper identifies as the primary share class to determine the returns of the fund.7 The total net assets (TNA) of each fund is the sum of TNA
across all share classes, and fees are calculated in a size-weighted way across share classes. Our sample period includes the stock market run-up observed across countries between 2003 and 2007 as well as the 2007-2009 global financial crisis, and therefore is a representative sample period as it includes both bull and bear market episodes.
6 In the U.S., 91% of mutual fund-owning households indicate that saving for retirement is one of their financial
goals, and 74% said it is their primary financial goal (Investment Company Institute, 2015). In the E.U., mutual funds represent 20% of households’ retirement savings (EFAMA, 2015). The use of mutual funds as a savings vehicle for retirement is, however, expected to increase due to the declining generosity of state pension plans (Plantier, 2014).
7 This database has been used by Cremers, Ferreira, Matos, and Starks (2016), Banegas, Gillen, Timmermann ,and
6
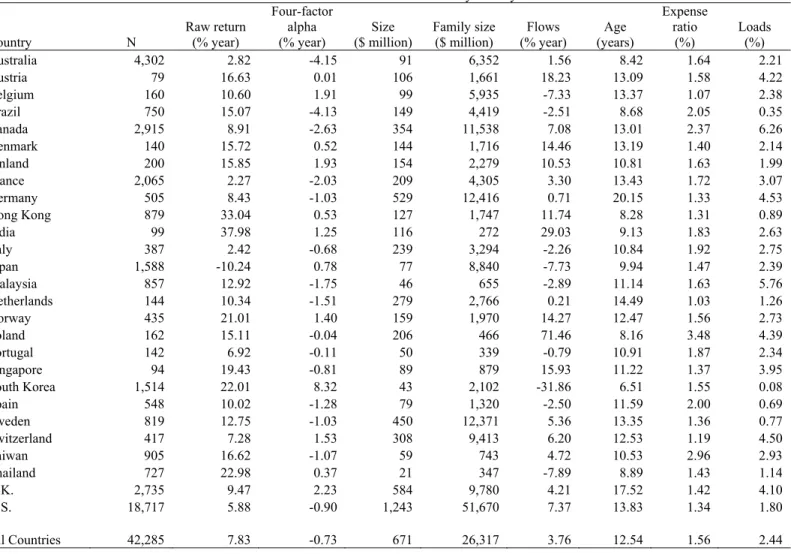
The comprehensive nature of the Lipper database is demonstrated by comparing it with Investment Company Institute (2011) (ICI) aggregate statistics. At the end of 2010, Lipper reported 26,861 equity funds, which represent 97% of the total of 27,754 funds included in the ICI statistics. At the same date, Lipper and ICI reported TNA of equity funds of $9 trillion and $10.2 trillion respectively. This means that our sample of equity funds covers 88% of the TNA of worldwide equity funds.
We impose a few filters to construct the final sample. First, the sample is restricted to actively managed domestic equity funds, and excludes closed-end and funds-of-funds. This means that we are using a sample of domestic open-end actively managed equity funds which facilitates comparison of our study with prior work on performance persistence. Second, to ensure that the investors in each of our fund countries are actually from the countries concerned, we exclude funds registered for sale in offshore centers such as Luxembourg, Dublin, and the Cayman Islands.8 This
matters because if the majority of investors in each of our countries are not from the country concerned then we might need to use global factors rather than local factors to risk adjust fund performance. Third, in order to ensure that we have sufficient time series observations to calculate risk-adjusted performance measures, we impose a minimum of 36 continuous monthly observations for each fund. Finally, to make our measures of persistence more meaningful, we also require a minimum of ten funds at the beginning of each year in each country. This leads to a sample of 6,384 equity funds.
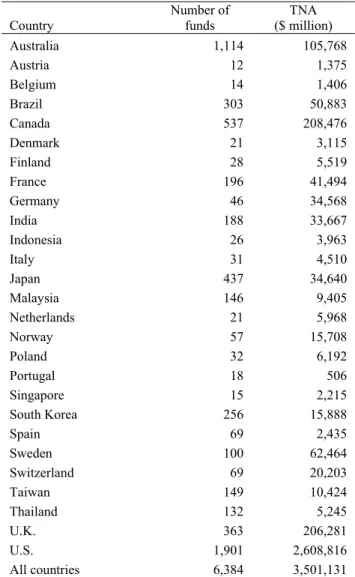
Table I presents the number of funds operating in each country as of December 2010 and their
8 Although we accept that there may be international investors that might choose to get exposure to a given country
by buying the mutual funds intended for sale to the citizens of that foreign country, we would expect those investors to more readily gain exposure to that country by buying mutual funds intended for those international investors. Illustrating this with an example, American investors wishing to get exposure to India are more likely to do so via mutual funds marketed to American investors that invest in India rather than through Indian mutual funds that invest in the Indian securities but that target Indian investors.
7
TNA. TNA (in $ million) is given by the sum of all share classes when there are multiple share classes. The U.S. accounts for 30% of the number of funds in our sample and 75% of the TNA. Australia and Canada represent 17% and 8% of the number of funds, but only 3% and 6% of the TNA, respectively, while the United Kingdom represents 6% of the TNA and the number of funds. There is considerable variation in the number of funds and the assets under management across mutual fund industries around the world. In particular, the U.S. is by far the country with most funds and the highest total assets under management, which means that it is in the extreme right tail of both the distributions of fund industry size and the number of funds across countries. What is clear is that the characteristics of the U.S. fund industry are very different to those of other fund industries around the world which suggests that existing findings on the persistence of the U.S. fund industry need not translate to other countries.
2.2. Measuring fund performance
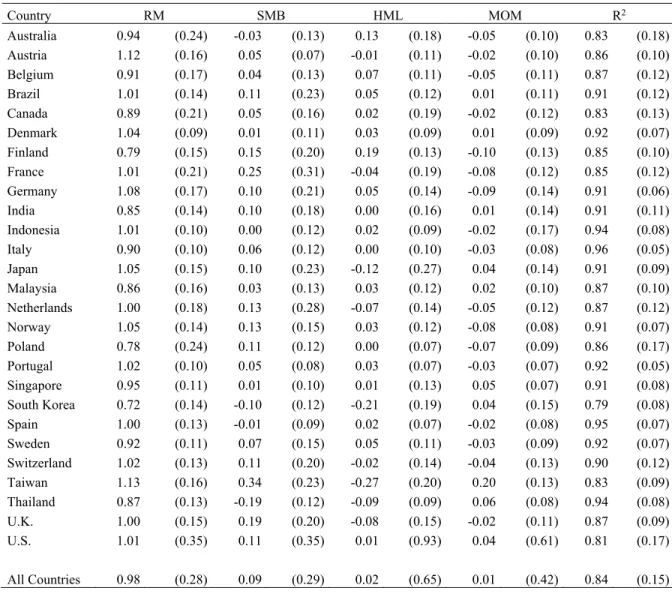
In order to study fund persistence, we need to estimate fund performance. Fund performance is measured using risk-adjusted returns in local currency. We use the same approach as Ferreira, Keswani, Miguel, and Ramos (2013) and Cremers, Ferreira, Matos, and Starks (2016) to calculate risk factors and alphas. Monthly fund returns are net of total expenses (annual fees and other expenses) and assume that dividends are immediately reinvested. Risk-adjusted performance is calculated using the Fama-French factors plus the momentum factor of Carhart (1997), the so called four-factor model. We construct monthly benchmark factors for each individual country using all stocks included in the Datastream/Worldscope database. The market return is computed using the value-weighted average return in local currency of all stocks in each country in each month. To form the size, the book-to-market, and the momentum portfolios and factors for each country in each month, we follow the procedure described in Fama and French (1992). In the
8
Appendix 1 we explain in detail how we calculate the risk factors for each country in our sample. Each quarter alpha (months t-3 to t-1) is calculated as follows. We first regress the previous 36 months of fund excess returns (t-39 to t-4) on the local (as given by the fund domicile) factors, and store the estimated betas.9 We then calculate the quarterly alpha, as the difference between
excess returns in months 3 through 1 and the predicted return based on factor realizations in t-3 through t-1 and factor loadings from the t-t-39 to t-4 regressions.
Table II presents the average factor loadings for domestic funds by country and the associated goodness of fit statistics from these regressions. It is well known that the four-factor model works well in explaining the variation in U.S. fund performance. The goodness of fit statistics outside the U.S. are even higher, which reassures us that the four-factor model is an appropriate way to capture fund performance in our worldwide sample.
Performance persistence can be examined at different frequencies. Most authors examine persistence at yearly frequency (e.g., Carhart, 1997 and Elton, Gruber, and Blake, 2012), because investors usually evaluate performance persistence at this frequency, and fund boards of directors also evaluate fund performance at this frequency. We therefore focus on annual performance persistence by aggregating the quarterly alphas within each year.
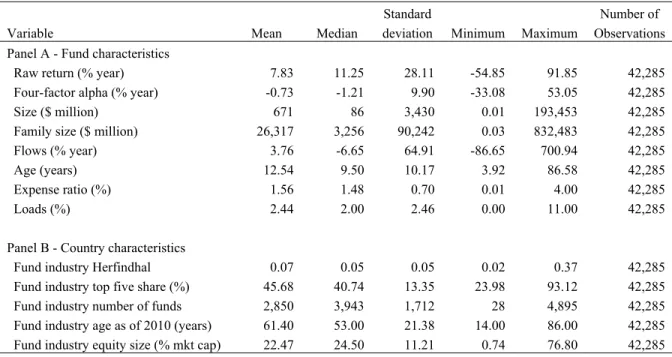
We control for several fund characteristics that are important determinants of fund performance. Panel A of Table III presents statistics on the distribution of fund characteristics across all the funds in our sample including fund size, age and different types of fund fees. Panel B of Table III presents statistics on the characteristics of fund industries across countries in our
9 To calculate excess returns we use as risk-free rates of return the interbank middle interest rates for each country,
with the exception of the United States, for which we use Treasury bill rates from the U.S. Federal Reserve. Data on interbank middle interest rates are drawn from Datastream.
9
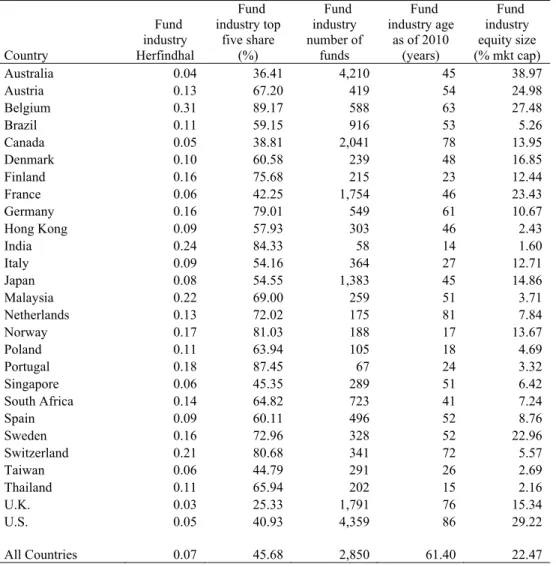
sample.10 If one examines the concentration of fund families across fund industries there are
clearly large differences across countries. For example, if we look at the share of the top five fund management companies in each country across our sample this share varies from 24% to 93%. In addition, fund industry development levels are clearly different across countries. If we use the age of the fund industry as a proxy for its development for example, this varies from 14 years to 86 years. We conclude that there are fundamental differences in the overall nature of fund industries across countries.
3. Evidence on performance persistence across countries
We use two methods to measure fund persistence. The first method is a regression-based approach calculated by regressing current fund performance on lagged fund performance and using the coefficient on lagged performance as our measure of persistence. The second method computes the Spearman rank correlation between funds’ performance ranks in the current year and the prior year.
Method one is based on Busse, Goyal, and Wahal (2010), which involves estimating the regression:
𝛼 𝜆 𝜅𝛼 𝜃𝑋 𝜀 (1)
where 𝛼 is fund performance measured using four-factor alpha in a given year, and 𝑋 is a set of lagged control variables that have a bearing on how funds perform in the future. If the coefficient κ is positive and significant, this indicates that fund performance persists. If κ is
10 Tables IA1, Panel A, and Table IA2 in the Internet Appendix present detailed means by country for fund
characteristics and country characteristics respectively. We winsorize raw returns, four-factor alphas, flows and fees at the bottom and top 1% level. Panel B of Table IA1 presents pairwise correlations among fund characteristics and shows that multicollinearity is not a concern as most correlation coefficients are low.
10
negative and significant, this indicates that performance tends to revert. We include the same control variables to explain future fund performance as Busse, Goyal, and Wahal (2010) use in their persistence study, namely fund size, fund family size, and fund percentage flow, all lagged by one year. We also include lagged fund age, annual fees, and loads. The regressions also include year fixed-effects. Standard errors are clustered at the fund or at the country level when we run the regressions separately for individual countries or when we pool the countries, respectively. Pooled regressions also include country fixed effects.
The second method that we take is a rank correlation approach based on Elton, Gruber, and Blake (2012). In order to conduct this approach, we first rank funds based on their four-factor alpha (𝛼 ) in their fund industry in a given year, and then rank funds on their prior year four-factor alpha (𝛼 ), in their fund industry. After doing this, we calculate the Spearman rank correlation between these two sets of fund ranks which is our second measure of persistence.11
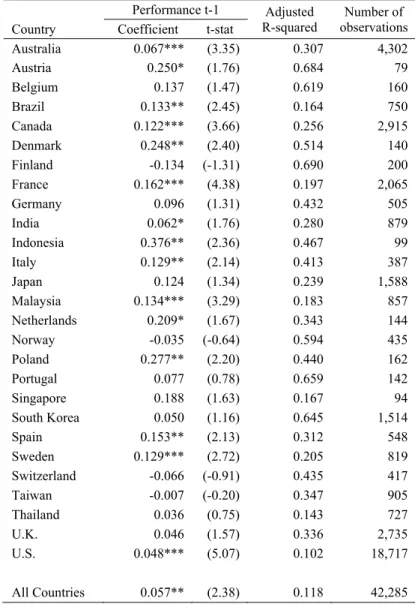
Table IV, Panel A, presents the results of our regression-based persistence tests. The first column shows that in 15 out of 27 countries there is statistically significant performance persistence. Table IV, Panel B, presents the results of our rank correlation based persistence tests. There are 18 countries with statistically significant performance persistence.
At the bottom of both panels we also calculate whether there is performance persistence when we pool funds from all countries together. When we do this, we find that there is statistically significant performance persistence across the sample of all countries as well, which is consistent with the persistence we find in the majority of individual countries in our sample.
11 The advantage of using the regression-based approach over the Spearman rank correlation approach is that it controls
for other variables that might influence the level of fund performance in the current period such as fund size. However, the regression-based approach is prey to fund performance outliers, which the ranking based approach is less affected by.
11
To validate our results, we compare the results of our persistence tests between the two persistence measures. Our results show that for 20 out of 27 countries there is consistency across the persistence measures regarding whether there is persistence or not.
The differences in the level of persistence across countries are not only statistically significant but also economically significant. For example, for the case of the regression-based approach, the country with the highest significant persistence is Indonesia with a coefficient on lagged four-factor alpha of 0.376 and the country with the lowest significant persistence is the U.S. with a coefficient on lagged four-factor alpha of 0.048. This means that more than one third of past performance in a given year carries over to the next year in Indonesia, while less than one 20th of past performance carries over to the next year in the U.S.
Having shown that performance persistence is pervasive in the majority of fund industries in our sample, it is now important to examine if the persistence we find is due to bottom or top performing funds. To this end, we redo our persistence tests. For our regression-based approach, this involves allowing the coefficients on lagged four-factor alpha to be different if a fund’s lagged alpha is in the bottom 20%, the mid-60% and the top 20% of funds in the prior year.12 To measure
the rank correlation at different points of the performance distribution, we calculate different rank correlations depending on if a fund’s lagged four-factor alpha places it in the bottom 20%, the mid-60% and the top 20% of funds in the prior year.
Table V, Panel A, presents the results of our regression-based approach. We find that of the 15 countries with statistically significant persistence, six countries have statistically significant persistence at the top of the performance distribution, six countries have significant persistence at the bottom of the distribution and two countries have persistence both at the top and the bottom of
12 The coefficients presented in Table V Panel A represent the total level of persistence present for bottom 20%, the
12 the distribution.
Table V, Panel B, presents the results of redoing our calculations of persistence using the rank correlation approach controlling for where funds are in the performance distribution in their prior year. We find that, of the 18 countries that have statistically significant persistence using this approach, four countries have persistence at the bottom of the distribution, five countries have persistence at the top and two countries have persistence both at the bottom and at the top. Thus, the results in Table V using both methodologies show that the number of countries with top and bottom persistence is well-balanced and, therefore, it is not possible to say whether top or bottom level persistence dominates in our sample of countries.13
Overall, we show that there is persistence in the majority of countries around the world. In addition, we find that persistence originates from both the bottom and the top of the performance distribution. This finding contrasts with the existing U.S. literature that shows that fund persistence is limited and is mainly due to bottom performers (e.g., Carhart, 1997).
4. Explaining performance persistence across countries
In this section we examine why there are differences in performance persistence across countries. We hypothesize that the competitiveness of a fund industry plays a role in determining its level of persistence. We would expect that if there is greater competition in a given fund industry, it would make it more difficult for a fund manager to escape the bottom of the performance distribution, and therefore increase the level of persistence we observe in poor performance. In contrast, if there is greater competition in a given fund industry, then we would expect that managers would find it more difficult to remain top performing managers in
13 In unreported results we show that this balance between performance persistence in top funds versus bottom funds
13
consecutive years, which should reduce persistence at the top of the performance distribution (e.g., Hoberg, Kumar, and Prabhala, 2018).
What variables might we expect to explain the competitiveness of fund industries? We proxy for fund industry competitiveness using two sets of variables. The first are based on measures of industry development. We would argue that in more developed fund industries, the easier ways to generate alpha have already been exploited, which makes generating persistent alpha more difficult. We measure fund industry development using the age of the fund industry and its size relative to the equity market concerned. The second set of measures of industry competitiveness we use are based on industry concentration: the Herfindahl index of fund family concentration, the top five share of fund families in an industry, and the number of funds in an industry.14
To implement these ideas using the regression approach, we regress fund performance in a given year on lagged performance in the prior-year and lagged fund performance interacted with our proxies for the level of competitiveness in the fund industry. As our prior is that competitiveness affects persistence differently at the bottom and the top of the performance distribution, we partition past year fund performance into bottom and top prior-year performance, like in Panel A of Table IV, and we interact our competition proxies with performance in these ranges. We also include the same fund level control variables as in Panel A of Table IV. In each regression we also separately include the country-level variables to ensure that our estimates of the role of these variables in determining performance persistence are not driven by their contribution to the level of performance in the country concerned. To address the concern that our
14 Our proxies for competition have been extensively used in the mutual fund literature (e.g., Cremers, Ferreira, Matos,
and Starks, 2016, Ferreira, Keswani, Miguel, and Ramos, 2012, and 2013, and Khorana, Servaes, and Tufano, 2005 and 2009).
14
findings may be influenced by measurement error in fund alphas, we include the average R-squared from the fund level four-factor alpha regressions in each country as a control variable.15
Fund industry competitiveness is positively related to our development measures including fund industry age and the size of the fund industry relative to the stock market size. Regarding our measures of fund industry concentration, the number of funds is also positively related to competitiveness, while both the Herfindahl index of fund family concentration and the top five share of fund families are negatively related to competitiveness. We therefore expect to find a positive (negative) coefficient on the interaction between bottom performance and the country-level variables that are positively (negatively) related to competitiveness. For the interactions at the top of the performance distribution, in turn, we expect to find a positive (negative) coefficient on the interaction between top performance and the country-level variables that are negatively (positively) related to competitiveness.
For the rank correlation method, we cannot use an interaction variable to determine whether competition affects fund persistence. Instead, we use a sorting-based approach, where we start by sorting fund industries into industries that have below or above median levels of competitiveness. We then calculate the rank correlation of funds from countries that have below median levels of competitiveness and separately calculate the rank correlation of funds that are from countries with above median levels of competitiveness. Lastly, we calculate the difference in persistence between the above median competitiveness group of countries and the below median competitiveness group of countries for both the top and the bottom of the performance distribution. Consistent with our
15 Because our sample includes many countries with financial markets with different dimensions and at different stages
of development, it could be argued that the quality of the factors we use to estimate four-factor alpha varies across countries and this might affect our results. Our robustness section includes further tests to deal with this concern.
15
regression-based approach, as fund industries become more competitive we would expect to see less persistence at the top of the performance distribution and more persistence at the bottom of the performance distribution. This means that the persistence in the above median competitiveness group of fund industries minus the persistence in the below median competitiveness group of fund industries should be negative at the top of the fund distribution and positive at the bottom of the fund distribution.
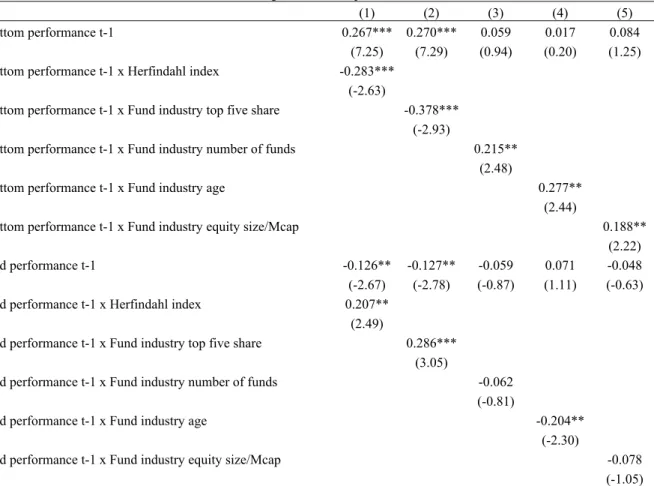
Table VI, Panel A, presents the results of our regression-based approach. They show that, as competitiveness goes up, the level of persistence in bottom performing funds goes up and the level of persistence in top performing funds goes down, which is consistent with our predictions. Table VI, Panel B, present the results of our sorting method for the rank correlation statistics. They show that as fund industries become more competitive persistence decreases at the top of the fund distribution and increases at the bottom of the fund distribution. The results are consistent with our predictions.16
While we have shown that competitiveness has a statistically significant effect on persistence, it is interesting to consider whether this effect is economically significant. Table VI sheds light on this. For simplicity we focus on the regression-based method although the results of the Spearman correlation-based method are qualitatively similar. Using the example of fund family concentration and its effect on persistence, Panel A of Table VI shows that, if we increase the Herfindahl index from the below the median country level to the above the median country level, the persistence at the bottom falls by 0.283. To put this in perspective, Panel A of Table V shows that the interquartile range for persistence at the bottom across countries is 0.174. For winners,
16 In unreported tests we show that our results remain when we cut the performance of funds in each country into
above the median and below the median funds for both the regression-based approach and the rank correlation based approach.
16
Panel A of Table VI shows that if we increase the Herfindahl index from the below the median country level to the above the median country level, the persistence at the top rises by 0.488. Panel A of Table V shows that the interquartile range of persistence at the top across countries is 0.224. These findings suggest that changes in fund family concentration have a substantial effect on persistence among loser and winner funds. We find comparable economic significance when we use our other competition proxies.
5. Robustness tests
The first concern we consider is the U.S. dominance of our sample. At the end of 2010, the U.S. has 1,901 of the 6,384 funds in our sample, which means that the U.S. is responsible for approximately 30% of the fund observations (see Table I). It might be argued that the U.S. dominance of the number of fund observations might be driving our results. We test this idea in two ways. First, we redo the analysis in Table VI, Panel A, except that we now use weighted least squares where we weight our observations by the inverse of the number of funds in each country-year. This gives less weight to the U.S. (and also to those countries with higher number of funds) in our results. The results are presented in Table IA3 and show that competition still drives persistence exactly as before.17 Second, we redo Table VI analysis excluding the U.S. from our
sample. Table IA4, Panels A and B, presents the results for both the regression-based approach and the rank correlation based approach, respectively. We find that our results are similar if we exclude the U.S. from our sample and competitiveness still affects persistence in the same way as observed in the prior section.
A second concern is that our sample contains a number of fund industries that have only a few
17 Because Table I also reports substantial differences in TNA across countries, in unreported results we also use
weighted least squares weighting by the inverse of the average TNA in each country-year and the results remain similar.
17
observations. We test whether our results are robust when we only include fund industries with 200 or more observations. Table IA5 shows that our results remain as before and competition still explains the cross-section of cross-country persistence results when we include only the fund industries that have larger fund populations.
It might be argued that the quality of factors across countries may differ because of the different number of stocks used to calculate factors as this could lead to cross-sectional variation in our ability to explain fund returns, which may explain our persistence results. We have already addressed this concern by including the average goodness of fit of our fund alphas regressions in each country as a control variable in our main cross-sectional tests of whether fund industry competition affects persistence (see Panel A of Table VI). To further address this concern and better equalize factor quality across countries, we first redo the regressions on Panel A of Table VI using weighted least squares. We weight our observations by the average R-squared from the fund level four-factor alpha regressions in each country. The purpose is to give more weight to those fund industries with better factor quality, i.e., with higher R-squared. The results are presented in Table IA6. Additionally, we also redo our persistence tests (Panels A of Tables IV and V) using factors for funds based on their investment region rather than a single country.18
Table IA7 presents our tests for persistence unconditionally, in Panel A, and conditionally allowing performance to vary depending on if fund performance is at the bottom or the top of the performance scale in the prior-year, in Panel B. Our tests for the determinants of persistence using fund alphas calculated using investment region factors are presented in Panel C. Our main results are robust. The results on performance persistence across countries are similar and we still find evidence of persistence in the majority of countries. In addition, we find that competition still
18
explains the persistence at the top and bottom of the performance distribution. Overall, all the robustness checks support our earlier findings on performance persistence and its determinants. 6. Conclusion
Mutual fund persistence has been tested primarily using the U.S. fund industry. However, the U.S. fund industry is much larger and older than other fund industries, characteristics that are important determinants of the level of competitiveness in fund industries. This suggests that the U.S.-based results may not translate to other fund industries at different stages of development. In this paper we study mutual fund persistence across a global sample of mutual funds from 27 countries. In contrast to the existing U.S.-based evidence, our results show that there is statistically significant persistence for the majority of countries in our sample.
We find considerable variation in persistence levels across countries. We conjecture that, in countries where fund industries are more competitive, it will be easier for bottom-performing funds to remain at the bottom but more difficult for top-performing funds to remain at the top. We therefore use various proxies for mutual fund industry competitiveness and test whether they affect persistence as predicted.
In short, we provide evidence supporting three main conclusions. First, there is persistence in the majority of countries in our global sample of funds. Second, contrary to what the U.S.-based evidence suggests, persistence is not exclusively due to poor performing fund managers and there is a balance between persistence in top-performing funds versus bottom-performing funds. Finally, we show that fund industry competitiveness explains cross-sectional variation in the level of persistence across countries.
19
References
Abdelsalam, O., M. Duygun, J. Matallín-Sáez, and E. Tortosa-Ausina, 2014, Do ethics imply persistence? The case of Islamic and socially responsible funds, Journal of Banking and Finance 40, 182-194.
Banegas, A., B. Gillen, A. Timmermann, and R. Wermers, 2013, The performance of European equity mutual funds, Journal of Financial Economics 108, 699-726.
Berk, J., and J. van Binsbergen, 2015, Measuring managerial skill in the mutual fund industry, Journal of Financial Economics 118, 1-20
Bers, M., and J. Madura, 2000, The performance persistence of closed-end funds, Financial Review 35, 33-52.
Blake, D., and A. Timmermann, 1998, Mutual fund performance: Evidence from the U.K., European Finance Review 2, 57-77.
Brown, S., and W. Goetzmann, 1995, Performance persistence, Journal of Finance 50, 679-698. Bollen, N., and J. Busse, 2005, Short-term persistence in mutual fund performance, Review of
Financial Studies 18, 569–597.
Busse, J., A. Goyal, and S. Wahal, 2010, Performance and persistence in institutional investment management, Journal of Finance 65, 765-790.
Cabral, L., 2017, Introduction to Industrial Organization, Massachusetts Institute of Technology Press, Cambridge, Massachusetts.
Carhart, M., 1997, On persistence in mutual fund performance, Journal of Finance 52, 57-82. Cremers, M., M. Ferreira, P. Matos, and L. Starks, 2016, Indexing and active fund management:
20
European Fund and Asset Management Association, 2015, Asset management in Europe- 8th
Annual review, facts and figures.
Elton, E., M. Gruber, and C. Blake, 2012, Does mutual fund size matter? The relationship between size and performance, Review of Asset Pricing Studies 2, 31-54.
Fama, E., and K. French, 1992, The cross-section of expected stock returns, Journal of Finance 47, 427-465.
Fama, E., and K. French, 2010, Luck versus skill in the cross-section of mutual fund returns, Journal of Finance 65, 1915-1947.
Ferreira M., A. Keswani, A. Miguel, and S. Ramos, 2012, The flow-performance relationship around the world, Journal of Banking and Finance, 36, 1759-1780.
Ferreira, M., A. Keswani, A. Miguel, and S. Ramos, 2013, The determinants of mutual fund performance, Review of Finance 17, 483-525.
Hendricks, D., J. Patel, and R. Zeckhauser, 1993, Hot hands in mutual funds: Short-run persistence of relative performance 1974-1988, Journal of Finance 48, 93-130.
Hoberg, G., N. Kumar, and N. Prabhala, 2018, Mutual fund competition, managerial skill, and alpha persistence, Review of Financial Studies 31, 1896-1929.
Investment Company Institute, 2011, Mutual Fund Factbook. Investment Company Institute, 2015, Mutual Fund Fact Book.
Jegadeesh, N. and S. Titman, 1993, Returns to buying winners and selling losers: Implications for stock market efficiency, Journal of Finance 48, 65-91.
Keswani, A., and D. Stolin, 2006, Mutual fund performance persistence and competition: A cross-sector analysis, Journal of Financial Research 29, 349-366.
Khorana, A., and H. Servaes, 2007, Conflicts of interest and competition in the mutual fund industry, Georgia Institute of Technology working paper.
21
Khorana, A., H. Servaes, and P. Tufano, 2005, Explaining the size of the mutual fund industry around the world, Journal of Financial Economics 78, 145-185.
Khorana, A., H. Servaes, and P. Tufano, 2009, Mutual fund fees around the world, Review of Financial Studies 22, 1279-1310.
Malkiel, B., 1995, Returns from investing in equity mutual funds 1971 to 1991, Journal of Finance 50, 549-572.
Otten, R. and D. Bams, 2002, European mutual fund performance, European Financial Management 8, 75-101.
Plantier, L., 2014, Globalisation and the global growth of long-term mutual funds.’ ICI Global Research Perspective 1, No.1.
Tsai, H.-J., and Y. Wu, 2015, Performance of foreign and global mutual funds: The role of security selection, region-shifting, and style-shifting abilities, Financial Review 50, 517-545. Wahal, S., and A. Wang, 2011, Competition among mutual funds, Journal of Financial
Economics 99, 40-59.
Wermers, R., 1997, Momentum investment strategies of mutual funds, performance persistence, and survivorship bias, University of Colorado working paper.
22
Table I – Number and size of mutual funds by country
This table presents the number of funds and total net assets (TNA) under management (sum of all share classes in U.S. dollars millions) of the sample of funds by country where the funds are legally domiciled at the end of 2010. The sample is restricted to open-end and actively managed domestic equity funds.
Country Number of funds TNA ($ million) Australia 1,114 105,768 Austria 12 1,375 Belgium 14 1,406 Brazil 303 50,883 Canada 537 208,476 Denmark 21 3,115 Finland 28 5,519 France 196 41,494 Germany 46 34,568 India 188 33,667 Indonesia 26 3,963 Italy 31 4,510 Japan 437 34,640 Malaysia 146 9,405 Netherlands 21 5,968 Norway 57 15,708 Poland 32 6,192 Portugal 18 506 Singapore 15 2,215 South Korea 256 15,888 Spain 69 2,435 Sweden 100 62,464 Switzerland 69 20,203 Taiwan 149 10,424 Thailand 132 5,245 U.K. 363 206,281 U.S. 1,901 2,608,816 All countries 6,384 3,501,131
23
Table II – Mutual fund factor loadings and goodness of fit
This table reports the average of annual factor loadings and goodness of fit statistics for domestic actively managed mutual funds in each country. Factor loadings are estimated using returns, measured in local currency with three years of monthly fund returns. RM is the excess return on the domestic market, SMB is the return difference between the small and large stock portfolio, HML is the return difference between the high and low book to market portfolio, and MOM is the difference in return between last year’s winner and loser portfolios all measured in the country concerned. R2 is the R-squared of fund four-factor alphas regressions.
Standard deviations across all funds are in parentheses.
Country RM SMB HML MOM R2 Australia 0.94 (0.24) -0.03 (0.13) 0.13 (0.18) -0.05 (0.10) 0.83 (0.18) Austria 1.12 (0.16) 0.05 (0.07) -0.01 (0.11) -0.02 (0.10) 0.86 (0.10) Belgium 0.91 (0.17) 0.04 (0.13) 0.07 (0.11) -0.05 (0.11) 0.87 (0.12) Brazil 1.01 (0.14) 0.11 (0.23) 0.05 (0.12) 0.01 (0.11) 0.91 (0.12) Canada 0.89 (0.21) 0.05 (0.16) 0.02 (0.19) -0.02 (0.12) 0.83 (0.13) Denmark 1.04 (0.09) 0.01 (0.11) 0.03 (0.09) 0.01 (0.09) 0.92 (0.07) Finland 0.79 (0.15) 0.15 (0.20) 0.19 (0.13) -0.10 (0.13) 0.85 (0.10) France 1.01 (0.21) 0.25 (0.31) -0.04 (0.19) -0.08 (0.12) 0.85 (0.12) Germany 1.08 (0.17) 0.10 (0.21) 0.05 (0.14) -0.09 (0.14) 0.91 (0.06) India 0.85 (0.14) 0.10 (0.18) 0.00 (0.16) 0.01 (0.14) 0.91 (0.11) Indonesia 1.01 (0.10) 0.00 (0.12) 0.02 (0.09) -0.02 (0.17) 0.94 (0.08) Italy 0.90 (0.10) 0.06 (0.12) 0.00 (0.10) -0.03 (0.08) 0.96 (0.05) Japan 1.05 (0.15) 0.10 (0.23) -0.12 (0.27) 0.04 (0.14) 0.91 (0.09) Malaysia 0.86 (0.16) 0.03 (0.13) 0.03 (0.12) 0.02 (0.10) 0.87 (0.10) Netherlands 1.00 (0.18) 0.13 (0.28) -0.07 (0.14) -0.05 (0.12) 0.87 (0.12) Norway 1.05 (0.14) 0.13 (0.15) 0.03 (0.12) -0.08 (0.08) 0.91 (0.07) Poland 0.78 (0.24) 0.11 (0.12) 0.00 (0.07) -0.07 (0.09) 0.86 (0.17) Portugal 1.02 (0.10) 0.05 (0.08) 0.03 (0.07) -0.03 (0.07) 0.92 (0.05) Singapore 0.95 (0.11) 0.01 (0.10) 0.01 (0.13) 0.05 (0.07) 0.91 (0.08) South Korea 0.72 (0.14) -0.10 (0.12) -0.21 (0.19) 0.04 (0.15) 0.79 (0.08) Spain 1.00 (0.13) -0.01 (0.09) 0.02 (0.07) -0.02 (0.08) 0.95 (0.07) Sweden 0.92 (0.11) 0.07 (0.15) 0.05 (0.11) -0.03 (0.09) 0.92 (0.07) Switzerland 1.02 (0.13) 0.11 (0.20) -0.02 (0.14) -0.04 (0.13) 0.90 (0.12) Taiwan 1.13 (0.16) 0.34 (0.23) -0.27 (0.20) 0.20 (0.13) 0.83 (0.09) Thailand 0.87 (0.13) -0.19 (0.12) -0.09 (0.09) 0.06 (0.08) 0.94 (0.08) U.K. 1.00 (0.15) 0.19 (0.20) -0.08 (0.15) -0.02 (0.11) 0.87 (0.09) U.S. 1.01 (0.35) 0.11 (0.35) 0.01 (0.93) 0.04 (0.61) 0.81 (0.17) All Countries 0.98 (0.28) 0.09 (0.29) 0.02 (0.65) 0.01 (0.42) 0.84 (0.15)
24
Table III – Mutual fund and additional country characteristics
This table reports mean, median, standard deviation, minimum, maximum, and number of observations of fund characteristics in Panel A and country characteristics in Panel B. Tables IA1 and IA2 in the Internet Appendix present detailed means by country for fund characteristics and country characteristics respectively. See Appendix 2 for variable definitions.
Standard Number of
Variable Mean Median deviation Minimum Maximum Observations
Panel A - Fund characteristics
Raw return (% year) 7.83 11.25 28.11 -54.85 91.85 42,285 Four-factor alpha (% year) -0.73 -1.21 9.90 -33.08 53.05 42,285 Size ($ million) 671 86 3,430 0.01 193,453 42,285 Family size ($ million) 26,317 3,256 90,242 0.03 832,483 42,285 Flows (% year) 3.76 -6.65 64.91 -86.65 700.94 42,285
Age (years) 12.54 9.50 10.17 3.92 86.58 42,285
Expense ratio (%) 1.56 1.48 0.70 0.01 4.00 42,285
Loads (%) 2.44 2.00 2.46 0.00 11.00 42,285
Panel B - Country characteristics
Fund industry Herfindhal 0.07 0.05 0.05 0.02 0.37 42,285 Fund industry top five share (%) 45.68 40.74 13.35 23.98 93.12 42,285 Fund industry number of funds 2,850 3,943 1,712 28 4,895 42,285 Fund industry age as of 2010 (years) 61.40 53.00 21.38 14.00 86.00 42,285 Fund industry equity size (% mkt cap) 22.47 24.50 11.21 0.74 76.80 42,285
25
Table IV – Fund performance persistence around the world
This table presents the results from regression-based persistence tests, in Panel A, and Spearman rank correlation persistence tests, in Panel B, measuring the persistence in each of the 27 worldwide countries in our sample. Results for all countries are also presented at the bottom of each panel. In Panel A, fund level four-factor alpha in a given year is regressed on prior year four-factor alpha and control variables (see equation 1). The lagged fund-level control variables (not reported) include fund size, fund family size, flows, age, expense ratio, loads, and fund style, measured as the loadings of the fund’s return on the country specific size (SMB) and value (HML) factors. Regressions also include time fixed effects, and country fixed effects when we pool the countries. Robust t-statistics clustered by fund (or by country, when we pool the data) are reported in parentheses. In Panel B, we first rank funds based on their given year four-factor alpha in their fund industry and then rank funds based on their prior year four-factor alpha in their fund industry. The Spearman rank correlation is calculated between these two sets of fund ranks. p-values are reported in parentheses. *, **, and *** indicate significance at the 10%, 5%, and 1% level, respectively. See Appendix 2 for variable definitions.
Panel A- Regression-based persistence tests Performance t-1 Adjusted
R-squared
Number of observations Country Coefficient t-stat
Australia 0.067*** (3.35) 0.307 4,302 Austria 0.250* (1.76) 0.684 79 Belgium 0.137 (1.47) 0.619 160 Brazil 0.133** (2.45) 0.164 750 Canada 0.122*** (3.66) 0.256 2,915 Denmark 0.248** (2.40) 0.514 140 Finland -0.134 (-1.31) 0.690 200 France 0.162*** (4.38) 0.197 2,065 Germany 0.096 (1.31) 0.432 505 India 0.062* (1.76) 0.280 879 Indonesia 0.376** (2.36) 0.467 99 Italy 0.129** (2.14) 0.413 387 Japan 0.124 (1.34) 0.239 1,588 Malaysia 0.134*** (3.29) 0.183 857 Netherlands 0.209* (1.67) 0.343 144 Norway -0.035 (-0.64) 0.594 435 Poland 0.277** (2.20) 0.440 162 Portugal 0.077 (0.78) 0.659 142 Singapore 0.188 (1.63) 0.167 94 South Korea 0.050 (1.16) 0.645 1,514 Spain 0.153** (2.13) 0.312 548 Sweden 0.129*** (2.72) 0.205 819 Switzerland -0.066 (-0.91) 0.435 417 Taiwan -0.007 (-0.20) 0.347 905 Thailand 0.036 (0.75) 0.143 727 U.K. 0.046 (1.57) 0.336 2,735 U.S. 0.048*** (5.07) 0.102 18,717 All Countries 0.057** (2.38) 0.118 42,285
26
Panel B - Spearman rank correlation persistence tests Performance t-1 Number of
observations Country Coefficient p-value
Australia 0.069*** (0.00) 4,302 Austria 0.439*** (0.00) 79 Belgium 0.097 (0.22) 160 Brazil 0.068* (0.06) 750 Canada 0.233*** (0.00) 2,915 Denmark 0.183** (0.03) 140 Finland -0.092 (0.20) 200 France 0.242*** (0.00) 2,065 Germany 0.315*** (0.00) 505 India 0.219*** (0.00) 879 Indonesia 0.307*** (0.00) 99 Italy 0.376*** (0.00) 387 Japan -0.003 (0.90) 1,588 Malaysia 0.206*** (0.00) 857 Netherlands 0.124 (0.14) 144 Norway 0.192*** (0.00) 435 Poland 0.174** (0.03) 162 Portugal 0.281*** (0.00) 142 Singapore 0.031 (0.77) 94 South Korea 0.032 (0.45) 1,514 Spain 0.065 (0.13) 548 Sweden 0.223*** (0.00) 819 Switzerland -0.067 (0.17) 417 Taiwan -0.023 (0.48) 905 Thailand 0.076** (0.04) 727 U.K. 0.075*** (0.00) 2,735 U.S. 0.153*** (0.00) 18,717 All countries 0.167*** (0.00) 42,285
27
Table V – Fund performance persistence around the world conditioning on past performance
This table presents the results from regression-based persistence tests, in Panel A, and Spearman rank correlation persistence tests, in Panel B, measuring the persistence in each of the 27 worldwide countries in our sample, for bottom, mid, and top levels of the performance scale. Results for all countries are also presented at the bottom of each panel. In Panel A, fund level four-factor alpha in a given year is regressed on prior year four-factor alpha and control variables. To allow past performance to influence future performance differently, depending on how well a fund has done in the past, we allow the coefficients on lagged four-factor alpha to be different for bottom 20%, mid 60%, and top 20% of funds in the prior year. The lagged fund-level control variables (not reported) include fund size, fund family size, flows, age, expense ratio, loads, and fund style, measured as the loadings of the fund’s return on the country specific size (SMB) and value (HML) factors. Regressions also include time fixed effects, and country fixed effects when we pool the countries. Robust t-statistics clustered by fund (or by country, when we pool the data) are reported in parentheses. In Panel B, we first rank funds based on their given year four-factor alpha in their fund industry, then we rank funds on their prior year four-factor alpha, in their fund industry. We finally calculate different rank correlations depending on whether a fund’s lagged four-factor alpha places it in the bottom 20%, mid 60%, or top 20% of funds in the prior year. p-values are reported in parentheses. *, **, and *** indicate significance at the 10%, 5%, and 1% level, respectively. See Appendix 2 for variable definitions.
Panel A- Regression-based persistence tests Bottom
f 1 f Mid 1 f Top 1 R-squared Adjusted observations Number of Country Coefficient t-stat Coefficient t-stat Coefficient t-stat
Australia 0.320*** (11.57) 0.12*** (3.19) -0.499*** (-9.68) 0.362 4,302 Austria 0.515*** (3.31) 0.059 (0.33) -0.001 (-0.01) 0.717 79 Belgium 0.197 (1.17) 0.231* (1.71) 0.182 (1.50) 0.595 160 Brazil 0.233*** (3.03) 0.013 (0.12) 0.05 (0.46) 0.171 750 Canada 0.240*** (5.30) 0.189*** (3.59) -0.048 (-0.95) 0.267 2,915 Denmark 0.255 (1.45) 0.318* (1.69) 0.234** (2.15) 0.511 140 Finland -0.196 (-0.97) -0.102 (-0.81) -0.113 (-1.40) 0.689 200 France 0.109* (1.83) 0.297*** (5.00) 0.202*** (3.20) 0.196 2,065 Germany 0.062 (0.56) 0.135 (1.12) 0.121 (1.06) 0.431 505 India 0.101* (1.80) 0.074 (0.88) 0.011 (0.21) 0.282 879 Indonesia 0.364 (1.11) 0.289 (1.13) 0.415*** (3.02) 0.463 99 Italy -0.093 (-1.04) -0.021 (-0.22) 0.259*** (3.77) 0.433 387 Japan 0.080 (0.63) 0.194 (1.51) 0.055 (0.60) 0.247 1,588 Malaysia 0.142** (2.42) 0.197** (2.43) 0.118* (1.75) 0.181 857 Netherlands 0.202 (0.86) 0.173 (0.72) 0.216 (1.64) 0.330 144 Norway 0.043 (0.48) -0.024 (-0.29) -0.085 (-1.16) 0.591 435 Poland 0.215 (1.20) 0.291* (1.67) 0.376*** (3.06) 0.431 162 Portugal 0.102 (0.64) 0.042 (0.37) -0.002 (-0.02) 0.664 142 Singapore -0.072 (-0.57) -0.044 (-0.20) 0.543** (2.13) 0.225 94 South Korea -0.019 (-0.17) -0.006 (-0.11) 0.058 (1.46) 0.646 1,514 Spain 0.119 (1.25) 0.065 (0.56) 0.221* (1.89) 0.311 548 Sweden 0.015 (0.18) 0.221** (2.30) 0.182*** (2.58) 0.216 819 Switzerland -0.133 (-1.10) -0.062 (-0.89) -0.182 (-0.71) 0.438 417 Taiwan 0.035 (0.61) -0.016 (-0.24) -0.028 (-0.66) 0.345 905 Thailand 0.044 (0.53) 0.096 (0.89) 0.027 (0.48) 0.136 727 U.K. 0.058 (0.95) 0.055 (1.03) 0.04 (1.13) 0.336 2,735 U.S. 0.211*** (13.52) 0.117*** (6.38) -0.06*** (-4.45) 0.119 18,717 All Countries 0.213*** (5.01) 0.03 (0.37) -0.054** (-2.20) 0.131 42,285
28
Panel B - Spearman rank correlation persistence tests
performance t-1 Bottom performance t-1 Mid performance t-1 Top Number of observations Country Coefficient p-value Coefficient p-value Coefficient p-value
Australia 0.346*** (0.00) 0.047** (0.02) -0.363*** (0.00) 4,302 Austria 0.795*** (0.00) 0.325** (0.03) 0.582** (0.04) 79 Belgium 0.001 (0.99) 0.071 (0.50) 0.288 (0.14) 160 Brazil 0.178** (0.03) 0.079 (0.13) 0.147* (0.07) 750 Canada 0.148*** (0.00) 0.127*** (0.00) 0.040 (0.34) 2,915 Denmark 0.169* (0.06) 0.062 (0.57) 0.139 (0.52) 140 Finland -0.059 (0.70) -0.035 (0.70) 0.148 (0.37) 200 France 0.044 (0.37) 0.245*** (0.00) 0.018 (0.71) 2,065 Germany -0.002 (0.98) 0.327*** (0.00) 0.069 (0.18) 505 India -0.042 (0.58) 0.252*** (0.00) 0.172** (0.02) 879 Indonesia -0.209 (0.35) 0.462*** (0.00) 0.505** (0.03) 99 Italy 0.062 (0.58) 0.426*** (0.00) 0.499*** (0.00) 387 Japan 0.128 (0.39) -0.047 (0.15) 0.012 (1.00) 1,588 Malaysia 0.091 (0.23) 0.156*** (0.00) 0.103 (0.18) 857 Netherlands 0.027 (0.89) 0.133 (0.11) 0.012 (0.95) 144 Norway 0.038 (0.72) 0.191*** (0.00) 0.125 (0.26) 435 Poland 0.016 (0.93) 0.046 (0.66) 0.295 (0.11) 162 Portugal 0.209 (0.25) 0.288*** (0.01) 0.260 (0.23) 142 Singapore -0.047 (0.85) -0.145 (0.28) 0.55** (0.03) 94 South Korea 0.042 (0.27) 0.035 (0.55) -0.120 (0.17) 1,514 Spain -0.089 (0.35) -0.079 (0.15) 0.066 (0.50) 548 Sweden 0.018 (0.81) 0.196*** (0.00) 0.287*** (0.00) 819 Switzerland -0.049 (0.20) -0.029 (0.24) 0.130 (0.14) 417 Taiwan 0.148** (0.05) -0.019 (0.66) -0.028 (0.71) 905 Thailand -0.090 (0.27) 0.065 (0.17) 0.077 (0.14) 727 U.K. 0.065 (0.12) 0.084* (0.06) -0.038 (0.37) 2,735 U.S. 0.278*** (0.00) 0.145*** (0.00) -0.089*** (0.00) 18,717 All countries 0.239*** (0.00) 0.152*** (0.00) -0.009 (0.42) 42,285
29
Table VI - Explaining performance persistence across countries
This table presents the results from panel regressions in Panel A, and Spearman rank correlation persistence tests in Panel B, examining the impact of a set of country-level variables that proxy for competitiveness in the mutual fund industry on persistence across the 27 worldwide countries in our sample. Proxies for competitiveness include measures of mutual fund industry concentration (the Herfindhal index of fund family concentration in the mutual fund industry, the top five share of fund families, and the number of funds in the mutual fund industry), and measures of mutual fund industry development (the age of the mutual fund industry and the size of the mutual fund equity industry as a percentage of the stock market capitalization). In Panel A, fund level four-factor alpha in a given year is regressed on prior year four-factor alpha, control variables, prior year four-factor alpha interacted with a dummy variable that takes the value of zero or one for countries with below or above median values of the level variable concerned, respectively, and the country-level variable itself. To allow past performance to influence future performance differently, depending on how well a fund has done in the past, we allow the coefficients on lagged four-factor alpha to be different for bottom 20%, mid 60%, and top 20% of funds in the prior year. Lagged fund-level control variables include fund size, fund family size, flows, age, expense ratio, loads, and fund style, measured as the loadings of the fund’s return on the country specific size (SMB) and value (HML) factors. We also include the average R-squared from the fund level four-factor alpha regressions in each country. Regressions include time fixed effects. Robust t-statistics clustered by country are reported in parentheses. In Panel B, we sort fund industries into industries that have below or above median levels of competitiveness and, based on their given year four-factor alpha, we separately calculate the rank correlation of funds from these countries. We then calculate the difference in persistence between the above median competitiveness group of countries and the below median competitiveness group of countries for both the top and the bottom of the performance distribution. p-values are reported in parentheses. See Appendix 2 for variable definitions. *, **, and *** indicate significance at the 10%, 5%, and 1% level, respectively.
Panel A - Regression-based persistence tests
(1) (2) (3) (4) (5) Bottom performance t-1 0.267*** 0.270*** 0.059 0.017 0.084
(7.25) (7.29) (0.94) (0.20) (1.25) Bottom performance t-1 x Herfindahl index -0.283***
(-2.63)
Bottom performance t-1 x Fund industry top five share -0.378*** (-2.93)
Bottom performance t-1 x Fund industry number of funds 0.215** (2.48)
Bottom performance t-1 x Fund industry age 0.277** (2.44)
Bottom performance t-1 x Fund industry equity size/Mcap 0.188** (2.22) Mid performance t-1 -0.126** -0.127** -0.059 0.071 -0.048 (-2.67) (-2.78) (-0.87) (1.11) (-0.63) Mid performance t-1 x Herfindahl index 0.207**
(2.49)
Mid performance t-1 x Fund industry top five share 0.286*** (3.05)
Mid performance t-1 x Fund industry number of funds -0.062 (-0.81)
Mid performance t-1 x Fund industry age -0.204**
(-2.30)
Mid performance t-1 x Fund industry equity size/Mcap -0.078 (-1.05) Continued on the next page
30
Panel A - Regression-based persistence tests (continued)
(1) (2) (3) (4) (5) Top performance t-1 -0.324*** -0.327*** 0.034 0.076 -0.013
(-5.91) (-6.13) (0.53) (0.80) (-0.15) Top performance t-1 x Herfindahl index 0.488***
(6.04)
Top performance t-1 x Fund industry top five share 0.598*** (5.79)
Top performance t-1 x Fund industry number of funds -0.362*** (-3.78)
Top performance t-1 x Fund industry age -0.421*** (-2.96)
Top performance t-1 x Fund industry equity size/Mcap -0.317*** (-3.24)
Herfindahl index 15.257
(1.09)
Fund industry top five share 5.913
(1.00)
Fund industry number of funds -1.302*
(-1.71)
Fund industry age -0.407
(-0.31)
Fund industry equity size/Mcap -8.320
(-1.31)
Adjusted R-squared 0.101 0.103 0.103 0.096 0.100
31
Panel B - Spearman rank correlation persistence tests
Herfindahl index Fund industry top five share Fund industry number of funds Fund industry age Fund industry equity size/Mcap
Below Above
Above -
Below Below Above
Above -
Below Below Above
Above -
Below Below Above
Above -
Below Below Above
Above - Below Bottom performance t-1 0.238*** 0.109*** -0.129*** 0.236*** 0.047 -0.189*** 0.118*** 0.251*** 0.133*** 0.11*** 0.255*** 0.145*** 0.115*** 0.258*** 0.143*** (0.00) (0.00) (0.00) (0.00) (0.15) (0.00) (0.00) (0.00) (0.00) (0.00) (0.00) (0.00) (0.00) (0.00) (0.00) Mid performance t-1 0.131*** 0.177*** 0.047** 0.13*** 0.176*** 0.046** 0.136*** 0.137*** 0.001 0.177*** 0.127*** -0.05*** 0.142*** 0.141*** -0.001 (0.00) (0.00) (0.01) (0.00) (0.00) (0.02) (0.00) (0.00) (0.96) (0.00) (0.00) (0.00) (0.00) (0.00) (0.94) Top performance t-1 -0.028** 0.113*** 0.14*** -0.029** 0.133*** 0.161*** 0.059** -0.026** -0.085*** 0.035 -0.024** -0.058** 0.066** -0.025* -0.091*** (0.03) (0.00) (0.00) (0.02) (0.00) (0.00) (0.03) (0.03) (0.01) (0.14) (0.03) (0.03) (0.01) (0.06) (0.00) Number of observations 35,437 6,848 - 36,025 6,260 - 5,603 36,682 - 13,405 28,880 - 7,238 35,047 -
32
Appendix 1: Calculation of factors for risk adjustment of fund performance We construct the monthly benchmark factors for each individual country except the United States, using all stocks included in the Datastream/Worldscope database. For the United States we use the factors constructed by Fama and French (1992).24 The local market
return is computed using the value-weighted average return in local currency of all stocks in each country in each month.
To form the size and book-to-market equity portfolios, we follow the procedure described in Fama and French (1992). For each country, we calculate the small-minus-big (SMB) and high-minus-low (HML) factors from July of year t through June of year t + 1 using six value-weighted portfolios formed at the end of June of year t on the intersection of two size portfolios (market equity capitalization, ME) and three book-to-market equity (BE/ME) portfolios. The size breakpoint is the median market capitalization of each country as of the end of June of year t. Half of the firms are classified as small market capitalization, and the other half as big market capitalization. For the BE/ME classification, the breakpoints are the 30th and 70th percentiles of BE/ME in each country for the fiscal year-end in t 1. The bottom 30% is designated as the value portfolio, the middle 40% as neutral, and the highest 30% as growth.
The SMB factor is the monthly average return of the three small portfolios minus the average return of the three big portfolios:
SMB = (Small Value + Small Neutral + Small Growth
24 The U.S. factors are drawn from French’s website:
33
Big Value Big Neutral Big Growth)/3
The HML factor is the monthly average return of the two value portfolios minus the monthly average return of the two growth portfolios:
HML = (Small Value + Big Value Small Growth Big Growth)/2
The momentum factor (MOM) for month t is calculated using six value-weighted portfolios formed at the end of month t 1, as a result of the intersections of two portfolios formed on size (ME) and three portfolios formed on prior (2-12) month returns. The ME breakpoint is the median market equity in each country as of the end of month t 1. For the return classification, the 30th and 70th percentiles of the prior returns (2-12) in each country are the breakpoints. The bottom 30% are designated as the down-month prior return portfolio, the middle 40% as medium, and the highest 30% as up. The MOM factor is the monthly average return in local currency on the two high-prior return portfolios minus the monthly average return on the two low-prior return portfolios: