Soil physico-hydrical properties resulting from the management in Integrated Production Systems
Texto
Imagem
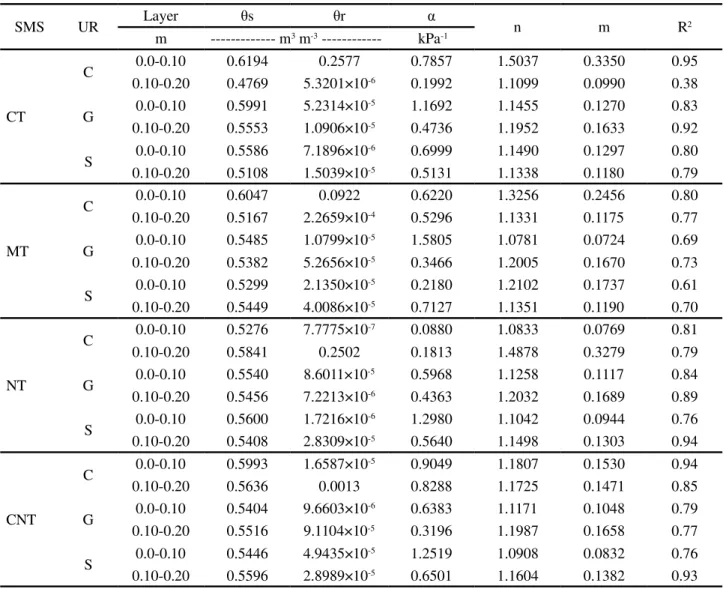
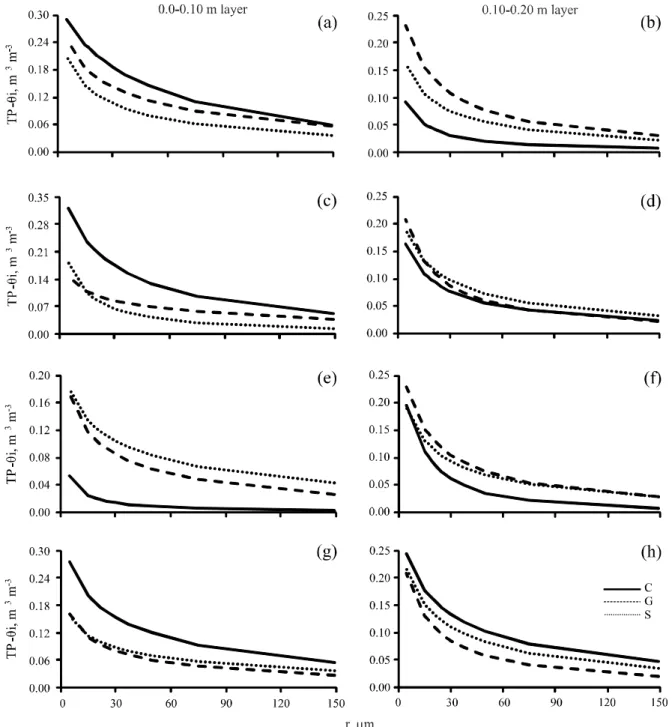
![Figure 4 - Water retention curves from the superficial (0.0-0.10 m) and sub-superficial (0.10-0.20 m) layers of a Haplohumox due to soil management system [conventional (a,b), minimum (c,d), no-tillage (e, f) and chiseled no-tillage (g,h)] and the winter c](https://thumb-eu.123doks.com/thumbv2/123dok_br/15866178.663879/8.892.105.771.337.1074/figure-retention-superficial-superficial-haplohumox-management-conventional-chiseled.webp)
Documentos relacionados
O Bolsa Escola continua, no entanto, não inserindo totalmente o seu público, tanto por problemas de organização que enfrenta como pela dupla estigmatização a qual esses indivíduos
reincidente em crime doloso; 1/3(um terço) da pena, se reincidente, ou se o crime for cometido com violência ou grave ameaça ou ainda de o crime tiver causado grave lesão à
Ao nascer do dia, vocês saem do mar e descobrem, ao longe, uma floresta, para onde vão se dirigir. De repente, uma surpresa: vocês saem da floresta e encontram uma
É importante destacar que as práticas de Gestão do Conhecimento (GC) precisam ser vistas pelos gestores como mecanismos para auxiliá-los a alcançar suas metas
O primeiro aspecto é que as diferenças sexuais não podem ser vistas apenas como biologicamente determinadas na acepção meramente genital, antes, são social e
Neste trabalho o objetivo central foi a ampliação e adequação do procedimento e programa computacional baseado no programa comercial MSC.PATRAN, para a geração automática de modelos
Assim, comecei a refletir sobre os seguintes pontos: as três festas, Festa do Comércio, Carnaval e Festa Junina, existiram, simultaneamente, entre as décadas de 1960 e 1990, porém,
Os dados registados pelo DL2 para cada ensaio permitiram analisar as variações sofridas nos valores da temperatura e da humidade relativa durante o percurso entre as duas câmaras
