Alterations in land uses based on amendments to the Brazilian Forest
Law and their influences on water quality of a watershed
Rodrigues-Filho, JL.
a*
, Degani, RM.
a, Soares, FS.
a, Periotto, NA.
a, Blanco, FP.
a,
Abe, DS.
a, Matsumura-Tundisi, T.
a, Tundisi, JE.
aand Tundisi, JG.
aaInternational Institute of Ecology and Environmental Management,
Rua Bento Carlos, 750, Centro, CEP 13560-660, São Carlos, SP, Brazil *e-mail:jorlrf@gmail.com
Received: May 27, 2013 – Accepted: January 28, 2014 – Distributed: March 31, 2015 (With 3 figures)
Abstract
The amendments to the Forest Law proposed by the Brazilian government that allow partial substitution of forested areas by agricultural activities raised deep concern about the integrity of aquatic ecosystems. To assess the impacts of this alteration in land uses on the watershed, diffuse loads of total nitrogen (Nt) and total phosphorus (Pt) were estimated in Lobo Stream watershed, southeastern Brazil, based on export coefficients of the Model of Correlation between Land Use and Water Quality (MQUAL). Three scenarios were generated: scenario 1 (present scenario), with 30-meter-wide permanent preservation areas along the shore of water bodies and 50-meter-radius in springs; scenario 2, conservative, with 100-meter-wide permanent preservation areas along water bodies; and scenario 3, with the substitution of 20% of natural forest by agricultural activities. Results indicate that a suppression of 20% of forest cover would cause an increase in nutrient loads as well as in the trophic state of aquatic ecosystems of the watershed. This could result in losses of ecosystem services and compromise the quality of water and its supply for the basin. This study underlines the importance of forest cover for the maintenance of water quality in Lobo Stream watershed.
Keywords: watershed, diffuse load, Forest Law.
Alterações na utilização dos solos com base proposições do novo Código
Florestal Brasileiro e suas influências na qualidade da água
de uma bacia hidrográfica
Resumo
As alterações no novo Código Florestal propostas pelo governo brasileiro (Lei número 4.771/65, de 15 de Setembro de 1965), o qual permite a substituição parcial de áreas de florestas para atividades agrícolas, levantou profunda preocupação com a integridade dos ecossistemas aquáticos. Para avaliar tais alterações no uso da terra propostas pelo novo código, as cargas difusas de nitrogênio total (Nt) e fósforo total (Pt) foram estimadas na bacia hidrográfica do Ribeirão do Lobo, sudeste do Brasil, com base em coeficientes de exportação do Modelo de Correlação entre Uso do Solo e Qualidade da Água (MQUAL). Três cenários foram simulados com o modelo: cenário 1 (cenário atual), com 30 metros de áreas de proteção permanente ao longo da margem dos corpos d’água e 50 metros de raio a partir do curso de água; cenário 2, conservador, com áreas de preservação permanente de 100 metros de largura ao longo a margem de corpos d’água; e cenário 3, a substituição de 20% da floresta natural por terras agrícolas. Os resultados indicam que a supressão de 20% da cobertura vegetal na bacia hidrográfica aumentaria as cargas de nutrientes e consequentemente a trofia dos ambientes aquáticos da bacia, podendo resultar em perdas de serviços ambientais e comprometer a qualidade e o abastecimento de água na bacia hidrográfica. O presente estudo evidencia a importância da vegetação para a manutenção da qualidade da água na bacia hidrográfica do ribeirão do Lobo.
Palavras-chave: bacia hidrográfica, cargas difusas, Código Florestal.
1. Introduction
In our biosphere, natural environments are interconnected by processes, such as the movement of phosphorous and nitrogen from terrestrial to aquatic ecosystems, which are considered downhill receivers (Likens and Bormann,
basin is defined as a terrestrial superficial area that drains water, sediment and dissolved matter to a common outlet at some point of the fluvial channel (Araújo, 2006).
Relief and the multiple uses of land influence the transport of nutrients to water bodies and their quality (Allan, 2004; Sheldon et al., 2012). To assess this influence, it is necessary to use methodologies that embrace the interactions between ecological, hydrological and anthropogenic processes in a hydrographic basin (Vollenweider, 1968; Likens, 1984; Wiens, 1989; Zalewski, 2000; Turner et al., 2001; Tundisi et al., 2008).
Large rural areas are usually sources of diffuse loads of nutrients. During precipitation events, these diffuse loads are drained and exported by run-off to superficial waters (Mansor et al., 2006). An export coefficient indicates the quantity of a nutrient generated per unit area per unit time (kg/km2.day or equivalent) and is specific for each
land use. It has been extensively used in many studies to estimate loads of diffuse nutrients originated in delimited areas (Vollenweider, 1968; Loehr, 1974; Sonzogni and Lee, 1974; Dillon and Kirchner, 1975; Omernik, 1977; Duncan and Rzoska, 1978; Pluarg, 1978; Rast and Lee, 1978; Reckhow et al., 1980; São Paulo, 2003).
Natural vegetation of forests plays an important role in the regulation of the hydrobiological cycle (Tundisi and Matsumura-Tundisi, 2008). Deforestation causes topsoil loss, modifies phosphorous and nitrogen cycles and increases the concentration of these nutrients in water bodies (Likens et al., 1970). In contrast to areas with natural vegetation, agricultural lands account for high exportations of nutrients into water bodies. Carpenter et al. (1998) found that 82% of nitrogen and 83% of phosphorous discharges into superficial water bodies in the United States come from diffuse sources of rural areas.
In Brazil, an increase of 33% in agricultural production in the last decade has brought concern on the quality of water resources (Steinke and Saito, 2008). Recent discussions on the amendments proposed to the Forest Law (Brasil, 1965) that allow the substitution of forested areas by agricultural activities also raised profound concern over the integrity of aquatic ecosystems. As a consequence, many studies have been focusing on the impacts of the removal of natural vegetation on downhill aquatic ecosystems and the losses of ecosystem services (Casatti, 2010; Metzger, 2010; Tundisi and Matsumura-Tundisi, 2010).
Changes in land uses and their influences on the generation of nutrient loads in a hydrographic basin may be simulated by mathematical models, which represent the relations between natural factors of the ecosystems and the state variables to be modeled (Jorgensen et al., 2005). Mathematical models are widely used in water resources management (Straškraba and Tundisi, 2008).
In this context, the aim of this paper is to describe land uses of Lobo Stream watershed and show how alterations in scales of landscape ecology may influence the exportation of phosphorus and nitrogen loads into downhill water bodies.
2. Material and Methods
2.1. Area of study
The watershed of Lobo Stream is inserted in Itaqueri River sub-basin, Tietê-Jacaré hydrographic basin. It is located in the central region of São Paulo State (Brazil) between coordinates 195648 m E / 7541823 m S and 204279 m E / 7527067 m S at system UTM (Universal Transversa de Mercator) and Zone 23. Itirapina and Brotas Municipalities are adjacent to this watershed (see Figure 1). Predominant climate in the region is Cwa, tropical humid, with dry winter and wet summer (Köppen, 1948). In conformity to the pedologic chart of São Paulo State (Brazil) (1:250,000 scale map) the region is composed by latosoils, podzolic soils and organic soils.
2.2. Spatial delimitation of Lobo Stream watershed The spatial delimitation of hydrographic basins has become more accurate over the past years owing to the arising and improvement of the Geographic Information System (GIS) and of consistent digital graphic representations of relief (Araújo et al., 2009).
The studied watershed was spatially delimited with ArcMap and ArcCatalog (GIS ArcGis 9,3 version software) combined with a methodology of manual extraction of water dividers from topographic data (Mendes et al., 2009).
Topographic data (1: 10,000 scale maps) of Lobo Stream watershed was acquired at the Geographic and Cartographic Institute (IGC) of Brazil. These maps were scanned, digitized and then georeferenced with Arc Map, using the Universal Transverse Mercator (UTM) geographic coordinate system and Datum South America Datum 69 (SAD 69) geodetic reference system.
Shapefiles were created in ArcCatalog to vectorize contour lines, hydrography aspects, point elevations and boundaries. These shapefiles were vectorized with ArcMap, based on the georeferenced topographic maps. Elevation values were assigned to each contour and point elevation, and hydrography was vectorized following the flow of the water bodies to the mouth point.
Mass points (TIN – Triangulated Irregular Network) were acquired from altimetry, contour line and point elevation values, by the interpolation option “create TIN from features”. The drainage system was incorporated as a break line to create a Digital Elevation Model (DEM) in ArcMap, using the routine option “3D Analyst – create tin from features”.
The shapefiles of countour lines, point elevations, DEM, hydrography aspects and a “limit” shapefile were superimposed using ArcMap. The “limit” shapefile was utilized to trace a dividing line from the mouth fluvial section to the highest elevation points. This dividing line was guided by elevation-crest lines that surround the studied water body section. These topographic features demarcate and characterize each hydrographic basin (Porto, 2003).
2.3. Land uses
or purchased owing to the development of technology and are important sources of information for studies on hydrographic basins (Araújo et al., 2009). This study was based on images of land uses from the RapidEye satellite, which have five meters of spatial resolution.
A false color composition of bands 3, 2 and 1 was made with the method of visual interpretation of images to identify patterns of land use. This interpretation shows the water bodies in tones of blue, forests and other vegetation in tones of green and exposed soil in tones of red. The shapefile of the limits of Tietê-Jacaré hydrographic basin was superposed upon the satellite images to extract the image of Lobo Stream watershed. After the extraction of the image of the watershed area, polygons were generated on areas correspondent to each class. Information about each polygon was added to a database and a map of land uses of Lobo Stream watershed was generated. This map was validated in many field trips.
2.4. Scenarios
Permanent Preservation Areas (PPA) with different surface areas were created with the distance delimiter “buffer”, according to scenarios proposed in this study: scenario 1 (present scenario), with 30-meter-wide permanent preservation areas along the shore of water bodies and 50-meter-radius in springs; scenario 2, conservative, with
100-meter-wide permanent preservation areas along water bodies; and scenario 3, with the substitution of 20% of natural forest by agricultural activities.
Scenario 1 considered current land uses in the study area. To create scenario 1, it was assumed that all PPA areas along water bodies corresponded to measures stated in the New Forest Law (Brasil, 2012). Although rivers of this basin are smaller than 10 meters in width, PPAs of 30 meter-wide along the shore of water bodies and of 50 meter-radius in springs were accounted.
Scenario 2 was conservative, with PPAs of 50 meters surrounding springs and along both margins of water bodies. This scenario was based on results described by Metzger (2010), who recommends that riparian forests (PPAs) have a minimum width of 100 meters, that is, 50 meter of width in each river margin, independently of biome, taxonomic group, soil or topography. This would maintain ecosystem functions and services foreseen by Section 1, Subsection 1 of the New Forest Law: “… preservation of forests and other native vegetation, as well as biodiversity, soil, water resources and integrity of climate system for the well-being of present and future generations.” (Brasil, 2012).
properties smaller than 4 fiscal modules) as a premise to this analysis. One fiscal module corresponds to 14 hectares in the studied area (INCRA, 1980) and thus, in rural properties with nearly 48 hectares, areas with natural vegetation (legal reserve) were substituted by areas with agricultural activities. This kind of land use with nearly 48 hecatres is predominant in this basin. Therefore, 20% of the total basin area that corresponds to the area stated by the Forest Law as Legal Reserve, was subtracted and substituted by areas with agricultural activities. As the amendment to the Forest Law did not foresee alterations in PPA areas along rivers, no alterations were done in these areas.
2.5. Estimation of diffuse loads
The method described by Dillon and Kirchner (1975) was the first to estimate coefficients of generation and exportation of nutrient loads according to geological characteristics and land cover and use. The methodology described by Moruzzi et al. (2012) considers that these coefficients can be obtained by observations of means of hydrological parameters of an annual period in addition to observations of the quantities of nutrients that a land use export to rivers, lakes and reservoirs of the hydrographic basin.
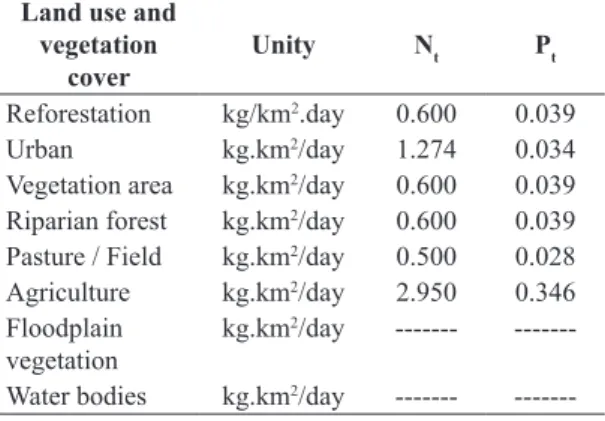
In this study, we estimated the diffuse loads of total nitrogen (Nt) and total phosphorus (Pt) based on export coefficients of the Model of Correlation between Land Use and Water Quality (MQUAL), version 2.0 (São Paulo, 1998). Values of export coefficients are showed in Table 1.
The MQUAL model correlates land uses with coefficients of production and exportation of diffuse loads to water bodies of São Paulo State, Brazil (São Paulo, 1998). These results may support land-use planning in order to protect water bodies (São Paulo, 2003).
The MQUAL model was chosen because it was developed for watersheds in the same state of the present study (Sao Paulo) and also not be suitable use export coefficients molded with the characteristics of other locations, such as in temperate ecosystems, which are distinguished on the aspects that characterize the watershed, such as geology, slope, vegetation and use and occupation of soil Ryding and Rast, 1989).
The basic equation (Equation 1) of the model of generation rate of diffuse load is:
(
i i)
DiffuseLoad= ∑ K xA (1)
Where:
Diffuse Load: diffuse loads of Nt and Pt generated in Lobo Stream watershed (kg/day).
Ki: export coefficients of diffuse loads of each environmental parameter for different classes of land uses (kg/km2/day).
Ai: area of a particular land use in Lobo Stream watershed (km2).
The estimation of generation and exportation of diffuse loads made it possible to assess the present panorama of the watershed in relation to Nt and Pt nutrients. Based on
this information, suggestions were made for alterations in ecosystems, according to distinct land uses.
2.6. Validation of results
The validation of results was carried out by comparing actual loads of the studied area with the loads estimated by MQUAL. A field trip was taken to quantify nitrogen and phosphorus concentrations at 7 sampling points of Lobo Stream watershed in July of 2010. Mean values and standard deviation were calculated and considered as the actual concentrations in the study area.
The calculation of loads in the watershed was made based on total loads of nitrogen and phosphorus according to current land cover and uses (present scenario). The water flow of the watershed was estimated with the methodology of Hydrological Regionalization of São Paulo State, developed by the Department of Waters and Electric Power (DAEE, 2013). This methodology is a parametric model that makes possible the assessment of water availability in any water body of São Paulo State (DAEE, 2013). Daily water flow was calculated by the multiplication of the mean flow by the daily amount of seconds (86,400). The values of nutrient loads and water flow per day made possible to estimate concentrations in different scenarios with MQUAL 2.0 and compare these results with mean values and standard deviation values observed in the watershed.
2.7. Estimation of trophic states in different scenarios The phosphorus concentrations estimated in the proposed scenarios made possible to determine the Trophic State Index (TSI) for each situation and to make a comparison between them in order to classify water bodies of the watershed in distinct trophic states and assess the quality of water in relation to nutrient concentrations. Results correspondent to phosphorous in this index must be understood as a measure of potential eutrophication as this nutrient originates this process (Tundisi and Matsumura-Tundisi, 2010).
The mathematical formula of the Trophic State Index is (Lamparelli, 2004; Equation 2):
Table 1. Values of export coefficients (MQUAL, version
2.0) to estimate diffuse loads according to land use.
Land use and vegetation
cover Unity Nt Pt
Reforestation kg/km2.day 0.600 0.039
Urban kg.km2/day 1.274 0.034
Vegetation area kg.km2/day 0.600 0.039
Riparian forest kg.km2/day 0.600 0.039
Pasture / Field kg.km2/day 0.500 0.028
Agriculture kg.km2/day 2.950 0.346
Floodplain vegetation
kg.km2/day ---
---Water bodies kg.km2/day ---
( )
10 6 0, 42 0,36 ln(
)
20 ln.2PT
TSI PT = − − −
(2)
Where:
PT: phosphorus concentration (µg.L-1) measured in water surface
ln: natural logarithm
The classification used for the trophic state is from Lamparelli (2004):
Ultraoligotrophic (TSI ≤ 47), Oligotrophic (47 < TSI ≤ 52), Mesotrophic (52 < TSI ≤ 59), Eutrophic (59 < TSI ≤ 63), Supereutrophic (63 < TSI ≤ 67) and Hipereutrophic: TSI > 67.
3. RESULTS
3.1. Land uses
The identification of land uses made possible the production of a map of land cover composed by eight classes: reforestation, urban areas, native vegetation, riparian forests (PPA), pasture / fields, agricultural areas,
floodplain vegetation and water bodies. The northern region of the watershed is characterized by a wide area with native vegetation and a considerable floodplain area. In the western region, land uses are characterized by agricultural activities, with predominance of sugar cane and orange plantation and few water bodies. In the central region, there is a mosaic of land uses and the eastern region is predominantly destined to reforestation. The southern region is composed of pasture, agricultural areas (sugar cane) and few areas of remnant native vegetation. PPA areas of the watershed are preserved, with the exception of the south region (see Figure 2).
There was an increase of PPA areas in scenario 1 and especially in scenario 2, which can be observed if comparing them to the map of the present scenario. The shores of some water bodies, mainly of southern areas, now have riparian forests (areas of permanent preservation) (see Figure 2). In scenario 3, the replacement of native vegetation by agricultural areas reduced the mosaics of vegetation and consequently resulted in a more uniform land cover and use (see Figure 2).
3.2. Validation of the estimated results
The total estimated loads of nitrogen and phosphorus produced in the watershed as a result of the present land uses were 8.03 and 1.57 kg/km2 per day, respectively. The
multiannual mean value of water flow estimated with the methodology of Hydrological Regionalization of São Paulo State was 0.577 m3/s. The estimated daily water flow was
49,852,800 m3 per day. These results made possible to
calculate nitrogen and phosphorus concentrations in the watershed (0, 16 mg/L and 31,6 µg/L, respectively). These concentrations were similar to mean values and standard deviation ranges obtained in measurements of the field trip: 0.42 ± 0.17 mg/L of nitrogen e 45.60 ± 20.88 µg/L of total phosphorous. This fact validates all results obtained and indicates that the mathematical modeling used (MQUAL) has satisfactorily characterized the water quality of the watershed.
3.3. Estimation of Nt and Pt loads
Values of Nt and Pt loads varied considerably among scenarios. In the present scenario, the estimation of production and exportation of diffuse loads of Nt and Pt were 8.03 and 1.57 kg/km2 per day, respectively, which
were originated mainly in agricultural areas (see Table 2).
In scenarios 1 and 2 (with enlarged PPA areas along water bodies), there was a decrease in nutrients loads produced in the watershed. Comparing these two scenarios to the present scenario, scenario 1 showed low production of nutrient loads, with values of 7.96 kg/km2 per day for
Nt and 1.54 kg/km2 per day for P
t (see Table 3). Conservative
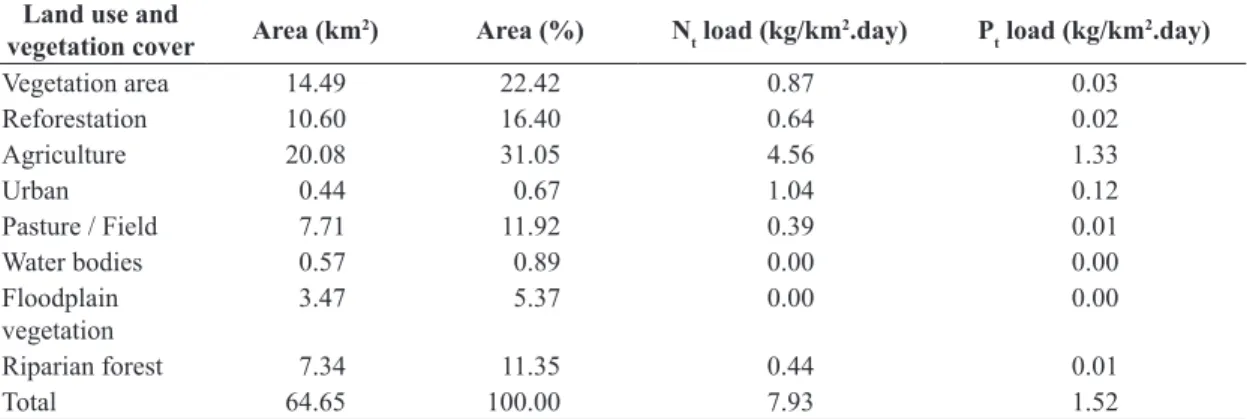
scenario 2 showed the lowest production of nutrients, with values of 7.93 kg/km2 per day for N
t and 1.52 kg/km 2 per
day for Pt (see Table 4).
Scenario 3, in which the most significant alterations were made in vegetation cover (substitution of native vegetation by agricultural land), registered the highest values of nutrient loads, with 10.19 kg/km2 per day for
Nt and 2.40 kg/km2 per day for P
t (see Table 5).
3.4. Estimation of trophic states in different scenarios The Trophic State Index (TSI) calculated for different concentrations of phosphorus in the three scenarios was low in the conservative one (TSI=51. 67). The TSI for scenario 2 was similar to scenario 1 (TSI=51.76) and the present scenario (TSI=51.87). These scenarios were classified as oligotrophic. Nutrient concentrations increased in scenario 3 (substitution of natural vegetation for agricultural land), with trophic state index of 54.06. This scenario was classified as mesotrophic (see Figure 3).
Table 2. Land uses, areas and respective values of loads of nutrients generated in the present scenario of Lobo Stream watershed.
Land use and
vegetation cover Area (km2) Area (%) Nt load (kg/km
2.day) P
t load (kg/km 2.day)
Vegetation area 15.33 23.71 0.92 0.03
Reforestation 11.09 17.16 0.67 0.02
Agriculture 21.01 32.49 4.77 1.39
Urban 0.44 0.67 1.04 0.12
Pasture / Field 9.48 14.66 0.47 0.01
Water bodies 0.57 0.89 0.00 0.00
Floodplain vegetation
3.97 6.13 0.00 0.00
Riparian forest 2.77 4.29 0.16 0.01
Total 64.65 100.00 8.03 1.57
Table 3. Land uses, areas and respective values of loads of nutrients generated in scenario 1 of Lobo Stream watershed. Land use and
vegetation cover Area (km2) Area (%) Nt load (kg/km
2.day) P
t load (kg/km 2.day)
Vegetation area 15.33 23.71 0.92 0.03
Reforestation 10.79 16.69 0.65 0.02
Agriculture 20.49 31.69 4.65 1.35
Urban 0.44 0.67 1.04 0.12
Pasture / Field 8.39 12.98 0.42 0.01
Water bodies 0.57 0.89 0.00 0.00
Floodplain vegetation
3.97 6.13 0.00 0.00
Riparian forest 4.70 7.27 0.28 0.18
4. Discussion
The quantification of loads produced and exported in a watershed is complex. Assessments on results of landscape ecology studies in this context show that errors of 25% in final values of nutrient loads frequently occur (Ryding and Rast, 1989). This would be caused by the several uncertainties during the process of estimation of nutrient loads, which can be minimized by measurements of loads in field trips (Macleod and Haygarth, 2003).
Export coefficients of a watershed can be obtained by observations of its mean hydrological conditions during an annual period and the quantity of nutrient loads that are produced by a particular area with a particular land use (São Paulo, 2009). In MQUAL, export coefficients were obtained with an intensive program of field investigations of hydrological variables and water quality in seven pilot basins. A total of 2,300 samples of water and 11,300 laboratory analyses were made in addition to a continuous monitoring of atmospheric precipitation and water levels of the water bodies studied. This made possible to detail seasonal variations of water quality and thus to assess nutrient loads in the basin with confidence (São Paulo, 1998).
According to Eiger et al. (1999), MQUAL coefficients can be applied to other hydrographic basins beyond the boundaries of the basin (Guarapiranga hydrographic basin) studied to develop this mathematical model. As the coefficients result from typical patterns of land uses and infrastructure of Brazilian municipalities, they can be applied to basins with similar characteristics of Guarapiranga and support the planning of other field studies.
The similarity of the results estimated with MQUAL and the results measured in field trip confirms the applicability of the model and supports the results of concentration of nutrients and alterations in scenarios obtained in this study. Table 4. Land uses, areas and respective values of loads of nutrients generated in scenario 2 of Lobo Stream watershed.
Land use and
vegetation cover Area (km2) Area (%) Nt load (kg/km
2.day) P
t load (kg/km 2.day)
Vegetation area 14.49 22.42 0.87 0.03
Reforestation 10.60 16.40 0.64 0.02
Agriculture 20.08 31.05 4.56 1.33
Urban 0.44 0.67 1.04 0.12
Pasture / Field 7.71 11.92 0.39 0.01
Water bodies 0.57 0.89 0.00 0.00
Floodplain vegetation
3.47 5.37 0.00 0.00
Riparian forest 7.34 11.35 0.44 0.01
Total 64.65 100.00 7.93 1.52
Table 5. Land uses, areas and respective values of loads of nutrients generated in scenario 3 of Lobo Stream watershed. Land use and
vegetation cover Area (km2) Area (%) Nt load (kg/km
2.day) P
t load (kg/km 2.day)
Vegetation area 2.40 3.71 0.15 0.005
Reforestation 11.09 17.16 0.67 0.02
Agriculture 33.94 52.49 7.70 2.24
Urban 0.44 0.67 1.04 0.12
Pasture / Field 9.48 14.66 0.47 0.01
Water bodies 0.57 0.89 0.00 0.00
Floodplain vegetation
3.97 6.13 0.00 0.00
Riparian forest 2.77 4.29 0.16 0.01
Total 64.65 100.00 10.19 2.40
Figure 3. Values o Trophic State Index (TSI) estimated by
Results indicated that Lobo Stream watershed is influenced by anthropogenic activities (lands uses), corroborating the study of Vitousek et al. (1997), who stated that the use of land to produce goods and services is the most substantial alteration on the ecosystem, in its structure, functioning and in how ecosystems interact with the aquatic systems.
Sparovek et al. (2010) estimated that about 68% of the natural vegetation of the Brazilian territory is situated in areas with agricultural activities and under the Forest Code regulation. Accordly with the authors, despite the importance of vegetated areas to conserve and maintain natural resources, assessments of whether agricultural activities are in compliance with the law reveal that there is a large deficit of vegetated areas in private lands).
In our study, areas with native vegetation, floodplain and riparian forest are predominant and consequently low concentrations of diffuse loads of nutrients are generated. With respect to riparian forests (PPAs) along water bodies, it was registered that their sizes were below the values foreseen by law. This was evidenced by the need to enlarge PPA areas significantly to build scenario 1 and fill law requirements.
In scenario 2, it was necessary to enlarge almost three times the original area of PPAs along water bodies, according to Metzger (2010) methodology. On the other hand, areas correspondent to other land uses, especially agricultural ones, were little modified. Thus, conservationist actions on the maintenance and expansion of PPAs should be introduced in agricultural activities of the basin without economic losses for land owners, as riparian forests contribute to water quality of the basin water bodies.
Small differences in values of loads of nutrients among the present scenario and scenarios 1 and 2 are due to the small area of PPA in relation to the total area of the watershed. If areas of PPA were enlarged, values of total loads generated could have been low. Nonetheless, this evidence does not diminish the importance of riparian forest to water quality, as confirmed by studies of Tundisi and Matsumura-Tundisi (2010), in which twenty eight physical and chemical parameters of water quality were assessed in this watershed, at sites with presence and absence of riparian forest. Results confirmed the importance of vegetation to manage hydrographic basins and to sustain agricultural activities.
Despite the importance of its riparian forests, the water quality of Lobo Stream watershed is directly related to land uses and vegetation cover as evidenced in this study. Mosaics of vegetation retain high concentrations of phosphorus and nitrogen and make possible a fast biogeochemical recycling that prevents their transportation to downhill aquatic systems. Increases in concentration of phosphorus and nitrogen in water bodies owing to potential deforestation of these areas may become a serious problem in Lobo Stream watershed as showed in scenario 3. These increases are caused by topsoil loss (Likens et al., 1970) and are positively related to anthropogenic disturbances in terrestrial environments of the hydrographic basin (Boyer et al., 2006).
Our results showed that the present scenario and scenarios in which vegetation areas were enlarged (scenarios 1 and 2), showed low phosphorus concentrations and were classified as oligotrophic. The reduction of native vegetation and substitution by agricultural areas caused increases in nutrient loads in the watershed and in its trophic state. The water bodies inserted in these areas were classified according to the phosphorus concentration as mesotrophic (Lamparelli, 2004). If agricultural activities are not properly managed (for example, grow of cover crops, establishment of protection strips along the shore of water bodies, construction of settling tanks or decantation ponds, etc.) there will be an increase in risk of nutrient loss owing to erosion processes and consequently an increase in nutrients carried into water bodies by runoff (Ekholm and Lehtoranta, 2012). This situation is of global concern as it accelerates the degradation of water bodies and results in the proliferation of cyanobacteria, aquatic macrophytes, bacteria and other organisms (Esteves, 2011). Recent analyses have provided evidence that reduced nutrient inputs often fail to fully reverse the trajectories of ecosystems after eutrophication (Duarte et al., 2009).
In addition to the increase of trophic state of water bodies, deforestation of native vegetation to enlarge agricultural areas would compromise groundwater recharge and water springs. Very complex water treatment systems would be needed in the absence of the role of forest and floodplains in the regulation of natural cycles. Economic costs of artificial water treatment and losses of environmental services due to degradation of water quality are discussed by Tundisi and Matsumura-Tundisi (2010). According to Casatti (2010), in order to protect aquatic biodiversity and insure the continuity of ecological processes in these environments, it is essential to protect the majority of watersheds, since the restoration of riparian forests itself is insufficient to enhance the integrity of the whole system.
Another important factor that was not estimated in this study is the use of pesticides in rural areas. According to the Brazilian Institute of Geography and Statistics (IBGE, 2009), more than half of rural properties of the country (1.4 million of properties) do not follow correct procedures for the manipulation of pesticides. In view of this, the substitution of native vegetation for agricultural areas in watersheds with native vegetation areas preserved, such as in Lobo Stream watershed, would eventually influence on loss of water quality by bad practices of use of these chemical compounds, as occurred in Brazil (Tundisi, 2003) and worldwide (Li and Zhang, 1999; Panda and Behera, 2003).
As highlighted by Martinelli and Filoso (2009), unlike developed countries, Brazil has the possibility to develop agricultural activities by practices that are compatible with environmental sustainability. There is enough space to preserve our biological patrimony and increase food production, in opposition to the dichotomous idea of nature preservation versus food production (Martinelli et al., 2010).
quality. This evidence confirms that the suppression of 20% of vegetation cover in the watershed, according to the area destined to Legal Reserve foreseen by The New Forest Law is not compatible with sustainable practices and would result in losses of important ecosystem services and increase of loading nutrients in watersheds.
Acknowledgements
The authors wish to express their thanks to CNPq LTER (PELD) program for support and funding of the project.
References
ALLAN, JD., 2004. Landscapes and riverscapes: the influence of land use on stream ecosystems. Annual Review of Ecology and Systematics, vol. 35, no. 1, p. 257-284. http://dx.doi.org/10.1146/ annurev.ecolsys.35.120202.110122.
ANDRADE, I.F., ARAúJO, N.C., PINESE JúNIOR, J.F., LEAL, P.C., SILVA, J.F., and RODRIGUES, SC., 2008. Avaliação de
cenários ambientais na região do médio curso do Rio Araguari. In
Anais da V Semana Acadêmica e IV Semana do Servidor da UFU;
VIII Encontro Interno e XII Seminário de Iniciação Científica da UFU, 2008, Uberlândia. p. 1-7.
ARAúJO, EP., 2006. Aplicação de dados SRTM à modelagem da erosão em microbacias por geoprocessamento. São José dos Campos: Programa de Pós-Graduação em Sensoriamento Remoto, Instituto Nacional de Pesquisas Espaciais. 88 p. Dissertação de Mestrado.
ARAúJO, EP., TELES, MG. and LAGO, WJS., 2009. Delimitação
das bacias hidrográficas da Ilha do Maranhão a partir de dados
SRTM. In Anais do XIV Simpósio Brasileiro de Sensoriamento Remoto, 2009, Natal. São José dos Campos: Instituto Nacional de Pesquisas Espac iais. p. 4631-4638. vol. XIV.
BOyER, EW., HOWARTH, RW., GALLOWAy, JN., DENTENER, FJ., GREEN, PA. and VÖRÖSMARTy, CJ., 2006. Riverine nitrogen export from the continents to the coasts. Global Biogeochemical Cycles, vol. 20, no. 1. GB1S91. http://dx.doi. org/10.1029/2005GB002537.
Brasil, 1965. Lei nº 4.771, de 15 de setembro de 1965. Diário Oficial da União, Brasília, 16 set. Available from: <http://www. planalto.gov.br/ccivil_03/leis/l4771.htm>. Access in: 10 Aug. 2013.
Brasil, 2012. Lei nº 12.651, de 25 de maio de 2012. Diário Oficial da União, Brasília, 28 maio.
CARPENTER, SR., CARACO, NF., CORRELL, DL., HOWARTH, RW., SHARPLEy, AN. and SMITH, VH., 1998. Nonpoint pollution of surface waters with phosphorus and nitrogen. Ecological Applications, vol. 8, no. 3, p. 559-568. http://dx.doi.
org/10.1890/1051-0761(1998)008[0559:NPOSWW]2.0.CO;2.
CASATTI, L., 2010. Alterações no Código Florestal Brasileiro: impactos potenciais sobre a ictiofauna. Biota Neotropica, vol. 10, no. 4, p. 31-34. http://dx.doi.org/10.1590/S1676-06032010000400002.
Departamento de Águas e Energia Elétrica do Estado de São Paulo – DAEE. Regionalização hidrológica do Estado de São
Paulo. São Paulo. Available from: <http://www.sigrh.sp.gov.br/
cgi-bin/regnet.exe?lig=podfp>. Access in: 10 Aug. 2013.
DILLON, PJ. and KIRCHNER, WB., 1975. The effects of geology and land use on the export of phosphorus from watersheds. Water
Research, vol. 9, no. 2, p. 135-148.
http://dx.doi.org/10.1016/0043-1354(75)90002-0.
DUARTE, CM., CONLEy, DJ., CARSTENSEN, J. and SÁNCHEZ-CAMACHO, M., 2009. Return to Nederland: shifting baselines affect eutrophication restoration targets. Estuaries and Coasts, vol. 32, no. 1, p. 29-36. http://dx.doi.org/10.1007/s12237-008-9111-2.
DUNCAN, N. and RZóSKA, J., 1978. Land use impacts on lake and reservoir ecosystems: Programme on Man and the Biosphere.
In Proceedings of the Workshop Activity 5 (MAB-5), 1978,
Warsaw, Poland. Paris: Unesco. 294 p.
EIGER, S., ARANHA, C.H., GOMES, M.C.A., PEREZ, L. and BUENO NETO, AS., 1999. Modelagem Matemática de Cargas Difusas na Bacia do Guarapiranga, São Paulo. In XIII Simpósio
Brasileiro de Recursos Hídricos, Belo Horizonte.
EKHOLM, P. and LEHTORANTA, J., 2012. Does control of soil erosion inhibit aquatic eutrophication? Journal of Environmental Management, vol. 93, no. 1, p. 140-146. http://dx.doi.org/10.1016/j. jenvman.2011.09.010. PMid:22054580
ESTEVES, FA., 2011. Fundamentos de limnologia. 3. ed. Rio de Janeiro: Interciência. 790 p.
Instituto Brasileiro de Geografia e Estatística – IBGE, 2009. Available from: <http//www.ibge.br>. Access in: 24 Mar. 2011. Instituto Nacional de Colonização e Reforma Agrária – INCRA,
1980. Instrução Especial/INCRA/nº 20, de 28 de maio de 1980. 148 p.
International Reference Group on Great Lakes Pollution from Land Use Activities – PLUARG, 1978. Reports of the Canadian Public Consultation Panels to the Pollution from Land Use Activities Reference Group. Windsor: International Joint Commission, Great Lakes Regional Office. 86 p.
JORGENSEN, SE., LOFLER, H., RAST, W. and STRASKRABA, M., 2005. Lake and reservoir management. London: Elsevier. 25 p. KÖPPEN, W., 1948. Climatologia: con un estudio de los climas
de la tierra. México: Fondo de Cultura Econômica. 479 p. LAMPARELLI, MC., 2004. Grau de trofia em corpos d’água do estado de São Paulo: avaliação dos métodos de monitoramento. São Paulo: Instituto de Biociências, USP. 238 p. Doctoral Thesis.
LI, y. and ZHANG, J., 1999. Agricultural diffuse pollution from fertilizers and pesticides in China. Water Science and Technology, vol. 39, no. 3, p. 25-32. http://dx.doi.org/10.1016/
S0273-1223(99)00029-3.
LIKENS, GE., 1984. Beyond the shore line: a watershed ecosystem approach. Internationale Vereinigung fur Theoretische und Angewandte Limnology, vol. 22, p. 1-22.
LIKENS, GE. and BORMANN, FH., 1974. Linkages between terrestrial and aquatic ecosystems. Bioscience, vol. 24, no. 8, p. 447-456. http://dx.doi.org/10.2307/1296852.
LIKENS, GE., BORMANN, FH., JOHNSON, NM., FISHER, DW. and PIERCE, RS., 1970. Effects of Forest cut and herbicide treatment on nutrient budgets in the Hubbard-Brook watershed ecosystems. Ecological Monographs, vol. 40, no. 1, p. 23-77. http://dx.doi.org/10.2307/1942440.
MACLEOD, C. and HAyGARTH, P., 2003. A review of the significance of non-point source agricultural phosphorus to surface water. Scope Newsletter, no. 51, p. 1-10.
MANSOR, MTC., TEIXEIRA FILHO, J. and ROSTON, DM., 2006. Avaliação preliminar das cargas difusas de origem rural, em uma sub-bacia do Rio Jaguari, SP. Revista Brasileira de Engenharia Agrícola e Ambiental, vol. 10, no. 3, p. 715-723. http://dx.doi.org/10.1590/S1415-43662006000300026.
MARTINELLI, LA. and FILOSO, S., 2009. Balance between food production, biodiversity and ecosystem services in Brazil: a challenge and an opportunity. Biota Neotropica, vol. 9, no. 4, p. 21-25. http://dx.doi.org/10.1590/S1676-06032009000400001.
MARTINELLI, LA., JOLy, CA., NOBRE, CA. and SPAROVEK, G., 2010. A falsa dicotomia entre preservação da vegetação natural
e a produção agropecuária. Biota Neotropica, vol. 10, no. 4, p. 0. http://dx.doi.org/10.1590/S1676-06032010000400036.
MENDES, V. and CATELLA, AC. and PARANHOS FILHO, AC., 2009. Uso de geotecnologias na extração manual de divisores de
águas: delimitação da bacia hidrográfica do rio Miranda. In Anais do 2º Simpósio de Geotecnologias no Pantanal, 2009, Corumbá, MS. São José dos Campos: Embrapa Informática Agropecuária.
p. 211-219. CD-ROM.
METZGER, JP., 2010. O Código Florestal tem base científica? Conservação e Natureza, vol. 8, no. 1, p. 1-5.
MORUZZI, RB., CONCEIçãO, FT., SARDINHA, DS., HONDA, FP., and NAVARRO, GRB., 2012. Avaliação de cargas difusas e simulação de autodepuração no Córrego da Água Branca, Itirapina
(SP). Geociências, vol. 31, p. 447-458.
OMERNIK, JM., 1977. Nonpoint sources-stream nutrient level relationships. Corvallis: US Environmental Protection Agency, Environmental Research Laboratory. 151 p. Ecological Research Series, no. EPA-600/3-76-014.
PANDA, RK. and BEHERA, S., 2003. Non-point source pollution of water resources: problems and perspectives. Food, Agriculture and Environment, vol. 1, no. 34, p. 308-311.
PORTO, RM., 2003. Hidráulica básica. 2. ed. São Carlos: Editora EESC/USP. 519 p.
RAST, W. and LEE, GF., 1978. Summary analysis of the North American (US portion) OECD Eutrophication Project: nutrient loading-lake response relationships and trophic state indices. Corvallis: US Environmental Protection Agency, Environmental Research Laboratory. 454 p. Ecological Research Series, no. EPA-600/3-78-008.
RECKHOW, KH., BEAULAC, MN. and SIMPSON, JT., 1980. Modeling phosphorus loading and lake response under uncertainty: a manual and compilation of export coefficients. Washington: US Environmental Protection Agency, Office of Water Regulations, Criteria and Standards Division. 214 p. Report no. EPA-400/5-80-011.
RyDING, SO. and RAST, W., 1989. The control of eutrophication of lakes and reservoirs. New Jersey: The Parthnon. 314 p.
São Paulo. Secretária do Meio Ambiente – SMA, 1998. Avaliação da Poluição por Fontes Difusas Afluentes ao Reservatório Guarapiranga. São Paulo: PRIME Engenharia.
São Paulo. Secretária do Meio Ambiente – SMA, 2003. Aplicação do MQUAL 1.5 na gestão de bacias hidrográficas e avaliação de cargas difusas. Versão 1.5 do Modelo de Correlação Uso do Solo/Qualidade de Água- MQUAL. São Paulo.
São Paulo. Secretaria Municipal do Verde e Meio Ambiente de São Paulo – SVMA. Instituto Internacional de Ecologia e Gerenciamento Ambiental – IIEGA, 2009. Manual de gerenciamento de bacias hidrográficas. São Carlos: Cubo Multimídia. 134 p.
SHELDON, F., PETERSON, EE., BOONE, EL., SIPPEL, S., BUNN, SE. and HARCH, BD., 2012. Identifying the spatial scale of land use that most strongly influences overall river ecosystem health score. Ecological Applications, vol. 22, no. 8, p. 2188-2203. http://dx.doi.org/10.1890/11-1792.1. PMid:23387119
SONZOGNI, WC. and LEE, GF., 1974. Nutrient sources for lake Mendota-1972. Transactions of the Wisconsin Academy of Sciences, Arts and Letters, vol. 62, p. 133-164.
SPAROVEK, G., BERNDES, G., KLUG, ILF. and BARRETTO, AGOP., 2010. Brazilian agriculture and environmental legislation: status and future challenges. Environmental Science & Technology, vol. 44, no. 16, p. 6046-6053. http://dx.doi.org/10.1021/es1007824. PMid:20704198
STEINKE, VA. and SAITO, CH., 2008. Exportação de carga
poluidora para identificação de áreas úmidas sob risco ambiental na bacia hidrográfica da Lagoa Mirim. Sociedade e Natureza, vol. 20, no. 2, p. 43-67. http://dx.doi.org/10.1590/S1982-45132008000200003.
STRAŠKRABA, M. and TUNDISI, JG., 2008. Diretrizes para o gerenciamento de lagos: gerenciamento de qualidade de água de represas. 2. ed. São Carlos: ILEC/IIE. 300 p. vol. 9.
TUNDISI, JG., 2003. Água no século XXI: enfrentando a escassez. São Carlos: Rima Artes e Textos. 248 p. vol. 1.
TUNDISI, JG. and MATSUMURA-TUNDISI, T., 2008. Limnologia. São Paulo: Oficina de Textos. 632 p.
TUNDISI, JG. and MATSUMURA-TUNDISI, T., 2010. Impactos potenciais das alterações do Código Florestal nos recursos
hídricos. Biota Neotropica, vol. 10, no. 4, p. 67-76. http://dx.doi. org/10.1590/S1676-06032010000400010.
TUNDISI, JG., MATSUMURA-TUNDISI, T., PARESCHI, DC., LUZIA, AP., VON HAELING, PH. and FROLLINI, EH., 2008.
A bacia hidrográfica do Tietê/Jacaré: estudo de caso em pesquisa
e gerenciamento. Estudos Avançados, vol. 22, no. 63, p. 159-172. http://dx.doi.org/10.1590/S0103-40142008000200010.
TURNER, MG., GARDNER, RH. and O’NEILL, RV., 2001. Landscape ecology in theory and practice: pattern and process. New york: Springer.
VITOUSEK, PM., MOONEy, HA., LUBCHENCO, J. and MELILLO, JM., 1997. Human domination of Earth’s ecosystems. Science, vol. 277, no. 5325, p. 494-499. http://dx.doi.org/10.1126/ science.277.5325.494.
VOLLENWEIDER, RA., 1968. Scientific fundamentals of eutrophication of lakes and flowing waters, with particular reference to nitrogen and phosphorus as factors in eutrophication technical report. Paris: Environmental Directorate, Organization for Economic Cooperation and Development. DAS/CSI/68.27.
WIENS, JA., 1989. Spatial scaling in ecology. Functional Ecology, vol. 3, no. 4, p. 385-397. http://dx.doi.org/10.2307/2389612.
ZALEWSKI, M., 2000. Ecohydrology: the scientific background to use ecosystem properties as management tools toward sustainability of water resources. Ecological Engineering, vol. 16, no. 1, p. 1-8.