Tim e se que nce o f change s in the
re spo nsive ne ss o f glyco ge n bre akdo wn
to adre ne rgic ago nists in pe rfuse d live r
o f rats with insulin-induce d
hypo glyce m ia
1Departamento de Farmácia e Farmacologia, Universidade Estadual de Maringá,
Maringá, PR, Brasil
2Departamento de Fisiologia e Biofísica, Instituto de Ciências Biomédicas,
Universidade de São Paulo, São Paulo, SP, Brasil
3Departamento de Farmácia, Universidade Paranaense, Umuarama, PR, Brasil
M. Vardanega-Peicher1,
G. Lopes1, F.B. Lima2,
R. Curi2, L.C. Nakano3
and R.B. Bazotte1
Abstract
The time-course changes of the responsiveness of glycogen break-down to a- and ß-adrenergic agonists during insulin-induced hypogly-cemia (IIH) were investigated. Blood glucose levels were decreased prior to the alteration in the hepatic responsiveness to adrenergic agonists. The activation of hepatic glucose production and glyco-genolysis by phenylephrine (2 µM) and isoproterenol (20 µM) was decreased in IIH. The changes in the responsiveness of glycogen catabolism were first observed for isoproterenol and later for phenyl-ephrine. Hepatic ß-adrenergic receptors showed a higher degree of adrenergic desensitization than did a-receptors. Liver glycogen syn-thase activity, glycogen content and the catabolic effect of dibutyryl cyclic AMP (the ß-receptor second messenger) were not affected by IIH.
Co rre spo nde nce
R.B. Bazotte
Departamento de Farmácia e Farmacologia
Universidade Estadual de Maringá 87020-900 Maringá, PR Brasil
Fax: + 55-044-263-6231 E-mail: rbbazotte@ uem.br
Research supported by PRO NEX (No. 168/97). Publication supported by FAPESP.
Received June 8, 1999 Accepted March 10, 2000
Ke y wo rds
·Hypoglycemia
·Adrenergic responsiveness
·Insulin-induced hypoglycemia
·Hepatic glucose production
·Glycogenolysis
Intro ductio n
The effect of epinephrine is known to be mediated by either a- or ß-adrenergic recep-tors. The response of liver glycogen break-down to epinephrine has been reported to vary with animal species (1), being influ-enced by a period of fasting (2), training for a starvation schedule (3), steroid hormones (4), sex (5), adrenalectomy (6), hypothyroid-ism (7), and aging (8). It should be men-tioned that the effects on adrenergic recep-tors observed in vivo could not be fully
re-produced in hepatocyte culture (9).
Recently, we developed a rat model to investigate hypoglycemia induced by in-sulin (10,11). Using this model, we have shown decreased hepatic responsiveness to phenylephrine (an a-adrenergic ago-nist) and isoproterenol (a ß-adrenergic agonist), but not to glucagon or cyanide (12). However, all of these experiments were performed at a fixed time, i.e., 60 min after insulin injection.
glycogen breakdown to a- and ß-adrenergic agonists in perfused liver of rats with insu-lin-induced hypoglycemia (IIH). The hepatic responsiveness to phenylephrine and isopro-terenol was examined 15, 30, 60 and 120 min after insulin administration. For this purpose, isolated liver perfused with non-recirculating medium was employed. This technique is suitable since metabolites do not accumulate, and metabolite rates can be determined directly from the metabolic con-centrations in the perfusate effluent. There-fore, the release of pyruvate, L-lactate and glucose reflects almost quantitatively the gly-cogen breakdown. Moreover, additional ex-periments were performed to elucidate the mechanism by which IIH decreases hepatic responsiveness of liver glycogen breakdown to adrenergic agonists using dibutyryl cyclic AMP.
Mate rial and Me tho ds
Albino male Wistar fed rats weighing about 200 g were used. Hypoglycemia was induced by an intraperitoneal injection of 1 U/kg of regular insulin (IN group). Control rats were injected with the same volume of saline (CN group). Liver perfusion was per-formed 15, 30, 60 and 120 min after insulin or saline administration. The rats were anes-thetized by intraperitoneal injection of pen-tobarbital sodium (40 mg/kg). After lapa-rotomy, blood was collected from the vena cava for determination of glucose (13) and insulin (14). Livers were perfused in situ
using an open system with no recirculation of the perfusion fluid as previously described (15). After 10 min of perfusion (10-min time) phenylephrine (2 µM), isoproterenol (20 µM) or dibutyryl cyclic AMP (30 µM) was dissolved in the perfusion fluid and infused between the 10th and 30th min of the perfusion period.
Glucose (13), L-lactate (16) and pyru-vate (17) were measured at 2-min intervals in the perfusate effluent. Assuming that
L-lactate, pyruvate and glucose released into the perfusate are the main products of carbo-hydrate degradation, glycogenolysis can be calculated as the sum of glucose plus the half-sum of L-lactate and pyruvate [glucose + 1/2 (L-lactate + pyruvate)]. The release of these metabolites provides a good approxi-mation of the rate of glycogenolysis because pyruvate oxidation, pentose-monophosphate shunt and recycling of pyruvate to glucose are minimal (18).
All metabolic measurements are reported as µmol min-1 g tissue-1 fresh weight. In part
of the experiments, liver samples were col-lected 10 min before infusion (time 0 min) of phenylephrine or isoproterenol to measure hepatic glycogen concentration (19) and gly-cogen synthase activity (20). A similar pro-cedure has been used in our previous studies (10-12).
Data were analyzed statistically by the unpaired Student t-test or ANOVA using the
Primer Biostatistics software. A 95% confi-dence level was accepted for all compari-sons. The GraphPad Prism computer pro-gram was used to calculate the areas under the curves (AUCs) reported as µmol/g. Data are reported as means ± SEM.
Re sults
Insulin administration caused a sustained decrease of glycemia from the 15th to the 120th min (Table 1). Since at this time glyce-mia had returned to normal in half the ani-mals, we divided them into recovered and not recovered groups, respectively represent-ing rats with normoglycemia and hypoglyce-mia 120 min after insulin administration. In contrast, insulin injection caused a slight not significant decrease of hepatic glycogen con-tent (Table 2).
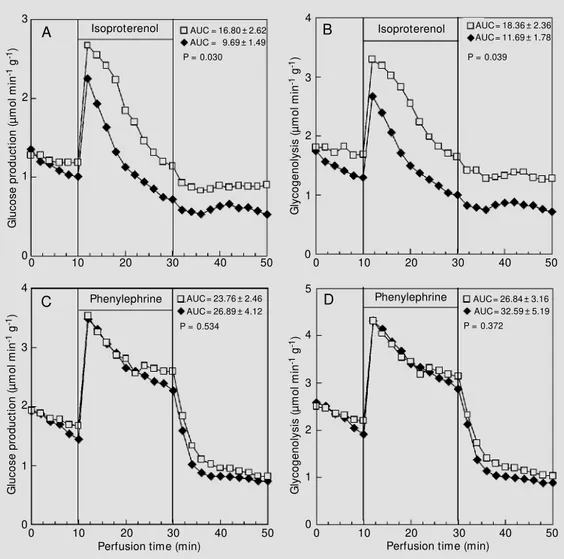
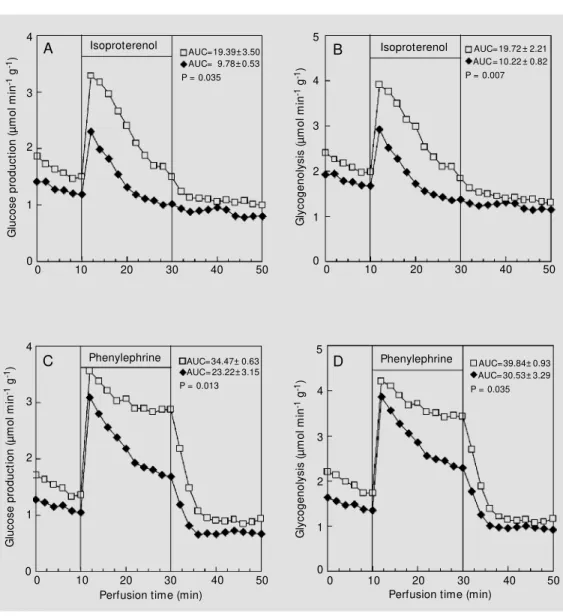
phenyl-ephrine or isoproterenol promoted a rapid and transient increase of hepatic glucose production and glycogenolysis in normogly-cemic (CN group) and hypoglynormogly-cemic rats (IN group). Peak values were obtained 2 min after the beginning of the infusion of both adrenergic agonists. The values of AUC cal-culated by subtracting the basal rates indi-cate that the activation of hepatic glucose production (Figure 1A) and glycogenolysis (Figure 1B) by isoproterenol was clearly decreased by hypoglycemia (IN group). On the other hand, the increment of hepatic glucose production (Figure 1C) and glyco-genolysis (Figure 1D) promoted by phenyl-ephrine did not differ between the CN and IN groups.
Since decreased responsiveness to iso-proterenol was observed as early as after 30 min of insulin administration, we decided to verify if this change could be observed ear-lier, i.e., 15 min after insulin administration. Our results demonstrated that the increment
of hepatic glucose production and glyco-genolysis promoted by isoproterenol did not differ between the CN and IN groups (data not shown).
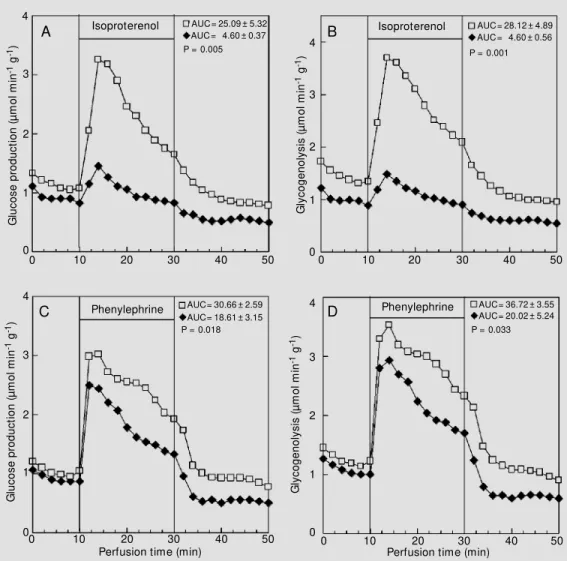
The maximal difference between the CN and IN groups was found at 60 min after insulin administration (Figure 2). At this time, the stimulation of hepatic glucose pro-duction (Figure 2A,C) and glycogenolysis (Figure 2B,D) by a- and ß-adrenergic ago-nists was clearly lower (P<0.05).
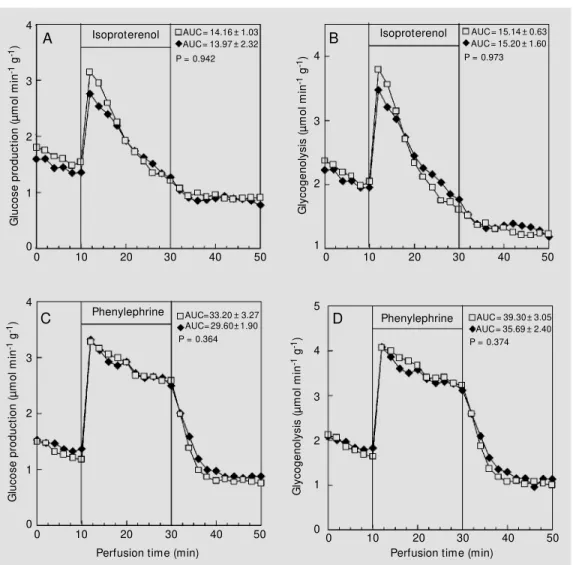
The responsiveness of liver glycogen breakdown was investigated 120 min after insulin administration. The recovered group showed similar hepatic glucose production (Figure 3A,C) and rates of glycogenolysis (Figure 3B,D) during the infusion of either isoproterenol or phenylephrine. In contrast, the non-recovered group displayed lower adrenergic responsiveness as reflected by the decreased glucose production (Figure 4A,C) and rate of glycogenolysis (Figure 4B,D) during the infusion of isoproterenol
Table 1 - Values of glycemia (mg/dl) determined 15, 30, 60, and 120 min after saline (CN group) or insulin (IN group) administration.
The results are reported as mean ± SEM for at least 5 rats. * P<0.05, significant difference from CN group (unpaired Student t-test).
Groups Periods of time (min)
15 30 60 120 recovered 120 not recovered
CN 146 ± 5.21 135 ± 2.23 135 ± 3.61 142 ± 4.80 141 ± 3.92
IN 114 ± 11.87 58 ± 8.84* 40 ± 4.2* 132 ± 6.19 38 ± 2.27*
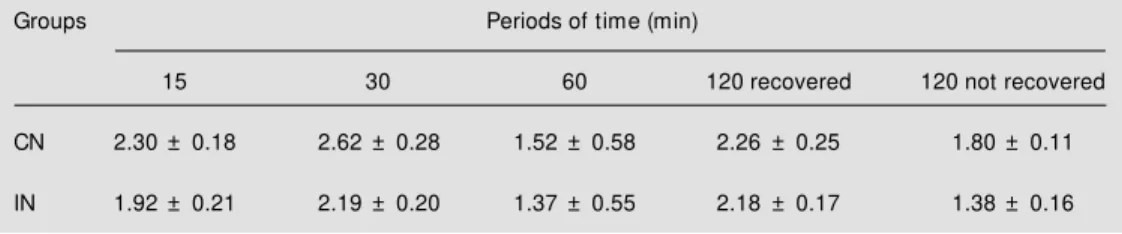
Table 2 - Liver glycogen content (mg% ) determined 15, 30, 60, and 120 min after injection of insulin (IN group) or saline (CN group).
Data are reported as the mean ± SEM for at least 5 experiments.
Groups Periods of time (min)
15 30 60 120 recovered 120 not recovered
CN 2.30 ± 0.18 2.62 ± 0.28 1.52 ± 0.58 2.26 ± 0.25 1.80 ± 0.11
and phenylephrine.
To better understand why hepatic gly-cogen content was not affected by hy-poglycemia (Table 2), we measured gly-cogen synthase activity. As shown in Table 3, total synthase activity and the propor-tion of the active form were not influ-enced by IIH.
Finally, in the last set of experiments the effect of dibutyryl cyclic AMP on hepatic glucose production and glycogenolysis was investigated. The kinetics of the activation of glycogen catabolism was similar in the two groups (Figure 5). However, the re-sponses of the liver from hypoglycemic rats were slightly less pronounced, as indicated by their glycogen content (Table 2).
D iscussio n
When liver is perfused in a non-recircu-lating system with medium containing no L-lactate, pyruvate or glucose, these products are washed out due to the large concentra-tion gradients between cytosol and extracel-lular fluid. This artificial condition provides the rates of carbohydrate degradation (18). Using this technique, we demonstrated that hepatic responsiveness of glycogen catabo-lism to phenylephrine and isoproterenol de-creased significantly 60 min after insulin administration (12). In the present study, this period of time was expanded in both direc-tions and the time course of the changes in the responsiveness of glycogen catabolism
Figure 1 - Effect of isoproterenol (20 µM ; panels A and B) and phenylephrine (2 µM ; panels C and D) on glucose production and glycogenolysis. The data re-ported are the mean of 5-8 indi-vidual liver perfusion experi-ments performed 30 min after injection of saline (CN group, squares) or insulin (IN group, dia-monds). The livers w ere per-fused as described in M aterial and M ethods. AUC = Area un-der the curve. The statistical test used w as the unpaired Student
t-test. G
lu
co
se
p
ro
du
ct
io
n
(µ
m
ol
m
in
-1 g -1)
3
2
1
00 10 20 30 40 50 Isoproterenol AUC = 16.80 ± 2.62
AUC = 9.69 ± 1.49 P = 0.030
Isoproterenol AUC = 18.36 ± 2.36 AUC = 11.69 ± 1.78
P = 0.039
G
ly
co
ge
no
ly
si
s
(µ
m
ol
m
in
-1 g -1)
4
3
1
0 2
0 10 20 30 40 50
G
lu
co
se
p
ro
du
ct
io
n
(µ
m
ol
m
in
-1 g -1)
3
2
1
0
0 10 20 30 40 50 Phenylephrine AUC = 23.76 ± 2.46
AUC = 26.89 ± 4.12 P = 0.534
Phenylephrine AUC = 26.84 ± 3.16 AUC = 32.59 ± 5.19 P = 0.372
G
ly
co
ge
no
ly
si
s
(µ
m
ol
m
in
-1 g -1)
5
4
2
0 3
0 10 20 30 40 50 4
1
Perfusion time (min) Perfusion time (min)
A B
during hypoglycemia to a- and ß-adrenergic agonists was investigated.
Glycemia decreased before the alteration of hepatic responsiveness. However, the re-sponsiveness of glycogenolysis to phenyl-ephrine and isoproterenol varied extensively along the experiment. Decreased responsive-ness to phenylephrine occurred between 30 (Figure 1) and 60 min (Figure 2) after insulin administration. On the other hand, the de-crease in hepatic responsiveness to isopro-terenol occurred earlier, i.e., between 15 (data not shown) and 30 min (Figure 1) after insulin injection. Furthermore, during the infusion of adrenergic agonists, the IN group presented lower glycogen breakdown in re-sponse to isoproterenol (Figure 1A,B) than
during the infusion of phenylephrine (Figure 1C,D), suggesting desensitization of ß-adre-nergic receptors during hypoglycemia. This finding is particularly relevant due to the fact that hepatic ß-adrenoreceptors play an im-portant role in the effect of epinephrine in a large number of experimental conditions (6-9).
In spite of the findings discussed above, the kinetics of activation of glycogen break-down promoted by both adrenergic agonists was similar, with peak values obtained 2 min after initiating the infusion of both adrener-gic agonists (Figures 1-4). Stümpel et al. (21) reported similar observations, i.e., de-creased hepatic glucose production within 1-2 min of continuous exposure to
norepi-G
lu
co
se
p
ro
du
ct
io
n
(µ
m
ol
m
in
-1 g -1)
4
3
2
0
0 10 20 30 40 50 Isoproterenol AUC = 25.09 ± 5.32
AUC = 4.60 ± 0.37 P = 0.005
Isoproterenol AUC = 28.12 ± 4.89 AUC = 4.60 ± 0.56 P = 0.001
G
ly
co
ge
no
ly
si
s
(µ
m
ol
m
in
-1 g -1)
4
3
1
0 2
0 10 20 30 40 50
G
lu
co
se
p
ro
du
ct
io
n
(µ
m
ol
m
in
-1 g -1)
3
2
1
00 10 20 30 40 50 Phenylephrine AUC = 30.66 ± 2.59
AUC = 18.61 ± 3.15 P = 0.018
Phenylephrine AUC = 36.72 ± 3.55 AUC = 20.02 ± 5.24 P = 0.033
G
ly
co
ge
no
ly
si
s
(µ
m
ol
m
in
-1 g -1)
4
2
0 3
0 10 20 30 40 50 4
1
Perfusion time (min) Perfusion time (min)
A B
C D
Figure 2 - Effect of isoproterenol (20 µM ; panels A and B) and phenylephrine (2 µM ; panels C and D) on glucose production and glycogenolysis. The data re-ported are the mean of at least 5 individual liver perfusion ex-periments performed 60 min
after injection of saline (CN group, squares) or insulin (IN group, diamonds). The livers w ere perfused as described in M aterial and M ethods. AUC = Area under the curve. The sta-tistical test used w as the un-paired Student t-test.
Figure 3 - Effect of isoproterenol (20 µM ; panels A and B) and phenylephrine (2 µM ; panels C and D) on glucose production and glycogenolysis. The data re-ported are the mean of 5 indi-vidual liver perfusion experi-ments performed 120 min after injection of saline (CN group, squares) or insulin (IN group, dia-monds). The livers w ere per-fused as described in M aterial and M ethods. The IN group rep-resents recovered animals, i.e., rats that show ed normoglyce-mia after 120 min of insulin ad-ministration. AUC = Area under the curve. The statistical test used w as the unpaired Student t-test.
G
lu
co
se
p
ro
du
ct
io
n
(µ
m
ol
m
in
-1 g -1)
3
2
1
0
0 10 20 30 40 50
Isoproterenol Isoproterenol AUC = 15.14 ± 0.63 AUC = 15.20 ± 1.60 P = 0.973
G
ly
co
ge
no
ly
si
s
(µ
m
ol
m
in
-1 g -1) 4
3
1 2
0 10 20 30 40 50
G
lu
co
se
p
ro
du
ct
io
n
(µ
m
ol
m
in
-1 g -1)
3
2
1
0
0 10 20 30 40 50 Phenylephrine AUC = 33.20 ± 3.27
AUC = 29.60 ± 1.90 P = 0.364
Phenylephrine AUC = 39.30 ± 3.05 AUC = 35.69 ± 2.40 P = 0.374
G
ly
co
ge
no
ly
si
s
(µ
m
ol
m
in
-1 g -1)
5
3
0 4
0 10 20 30 40 50 4
1
Perfusion time (min) Perfusion time (min)
A B
C D
AUC = 14.16 ± 1.03 AUC = 13.97 ± 2.32 P = 0.942
4
nephrine.
Since the most pronounced changes in the hepatic responsiveness to adrenergic ago-nists occurred 60 min after insulin adminis-tration (Figure 2), we decided to obtain more information about the factors that control adrenergic responsiveness by carrying out the experiments at this time. For this pur-pose, two additional sets of experiments were performed.
First, we determined the activity of total glycogen synthase and the proportion of the active form of this enzyme. None of these parameters was affected by IIH (Table 3). As previously shown (12), glycogen phos-phorylase activity was also not influenced by hypoglycemia. Taken together, these
results led us to suggest that hyperinsuline-mia promoted by insulin administration (436.0 ± 13.2 µU/l of the IN group vs 47.6 ±
3.8 µU/l of the CN group - results obtained 60 min after insulin injection) may prevent the effect of an increased endogenous re-lease of counterregulatory hormones pro-moted by hypoglycemia (22).
Cyclic AMP is known to be the second messenger of ß-adrenergic receptors (23). Thus, due to the fact that the most pro-nounced changes in glycogen breakdown were observed for isoproterenol, in the sec-ond set of experiments the effect of dibutyryl cyclic AMP was tested. As shown in Figure 5, the kinetics of the activation of glycogen breakdown promoted by dibutyryl cyclic
G lu co se p ro du ct io n (µ m ol m in
-1 g -1)
3
2
1
0
0 10 20 30 40 50
Isoproterenol Isoproterenol AUC=19.72 ± 2.21 AUC =10.22 ± 0.82 P = 0.007
G ly co ge no ly si s (µ m ol m in
-1 g -1)
5
3
1 2
0 10 20 30 40 50
A AUC= 19.39 ± 3.50 B
AUC= 9.78 ± 0.53 P = 0.035
4
Figure 4 - Effect of isoproterenol (20 µM ; panels A and B) and phenylephrine (2 µM ; panels C and D) on glucose production and glycogenolysis. The data re-ported are the mean of 4 indi-vidual liver perfusion experi-ments performed 120 min after injection of saline (CN group, squares) or insulin (IN group, dia-monds). The livers w ere per-fused as described in M aterial and M ethods. The IN group rep-resents non-recovered animals, i.e., rats that show ed hypoglyce-mia 120 min after insulin admin-istration. AUC = Area under the curve. The statistical test used w as the unpaired Student t-test. 4 0 5 4 3 1 6
2 Glyco
ge no ly si s (µ m ol m in
-1 g -1) 5
4 3 0 6 2 1 G lu co se p ro du ct io n (µ m ol m in
-1 g -1)
A Dibutyryl cAM P B Dibutyryl cAM P
AUC = 58.83 ± 5.94 AUC = 49.93 ± 3.75 P = 0.252 AUC = 59.05 ± 8.46
P = 0.0278 AUC = 47.96 ± 3.84
0 10 20 30 40 50
Perfusion time (min) 0 10 Perfusion time (min)20 30 40 50
Figure 5 - Effect of dibutyryl cy-clic AM P (cAM P; 30 µM ) on glu-cose production (panel A) and glycogenolysis (panel B). The data reported are the mean of 4 individual liver perfusion experi-ments performed 60 min after injection of saline (CN group, squares) or insulin (IN group, dia-monds). The livers w ere per-fused as described in M aterial and M ethods. AUC = Area un-der the curve. The statistical test used w as the unpaired Student t-test. G lu co se p ro du ct io n (µ m ol m in
-1 g -1)
3
2
1
0
0 10 20 30 40 50 Phenylephrine AUC =34.47± 0.63
AUC = 23.22 ± 3.15 P = 0.013
Phenylephrine AUC = 39.84 ± 0.93
AUC = 30.53 ± 3.29 P = 0.035
G ly co ge no ly si s (µ m ol m in
-1 g -1)
5
3
0 4
0 10 20 30 40 50 4
1
Perfusion time (min) Perfusion time (min)
C D
AMP was similar in both groups. Thus, we conclude that the mechanism of decreased responsiveness to isoproterenol occurred at some step preceding cyclic AMP formation. This effect can occur on receptor, G-protein or adenylate cyclase activity. Current ideas indi-cate that the initial event in ß-adrenergic de-sensitization is a rapid uncoupling of the re-ceptor from Gs-protein due to receptor
phos-phorylation (24). However, if this mechanism operates during IIH remains to be elucidated.
Ackno wle dgm e nts
The authors are grateful to Mr. Carlos Eduardo de Oliveira for skillful technical assistance.
Table 3 - Activities of the total and active forms of glycogen synthase and proportion of the active form (% AS) in rats w hich received saline (CN group, glycemia: 144.7 ± 2.4 mg/dl) or insulin (IN group, glycemia: 42.4 ± 3.6 mg/dl) 1 h before hepatic perfusion.
Glycogen synthase activity w as assayed in liver samples collected 10 min before the infusion of phenylephrine or isoproterenol (time 0). Data are reported as the mean ± SEM for 6 rats of glyco-gen synthase activity (nmol mg-1 min-1).
Glycogen IN CN synthase
activity
Total 16.2 ± 0.55 14.6 ± 0.55 Active 0.7 ± 0.15 0.65 ± 0.15 % AS 4.52 ± 1.16 4.10 ± 0.57
Re fe re nce s
1. García-Sáinz JA, Rom ero-Avila M T, Hernandés RA, M acías-Silva M , Olivares-Reyes A & Gonzáles-Espinosa A (1992). Species heterogeneity of hepatic adreno-ceptors: a1A-, a1B- and a1C-subtypes. Bio-chemical and Biophysical Research Com-munications, 186: 760-767.
2. El-Refai M F & Chan TM (1982). Effects of fasting on hepatic catecholamine recep-tors. FEBS Letters, 146: 397-402. 3. Bazot t e RB, Const ant in J, Curi R,
Kemmelmeier FS, Hell NS & Bracht A (1989). The sensitivity of glycogenolysis to glucagon, epinephrine and cyanide in livers from rats in different metabolic con-ditions. Research Com m unications in Chemical Pathology and Pharmacology, 64: 193-205.
4. Davies AO & Lefkow itz RJ (1984). Regu-lation of ß-adrenergic receptors by steroid hormones. Annual Review of Physiology, 46: 119-130.
5. Studer RK & Borle AB (1982). Differences betw een male and female rats in the regu-lation of hepatic glycogenolysis. Journal of Biological Chemistry, 257: 7987-7993. 6. García-Sáinz JA, Huerta-Bahena M E & M albon CC (1989). Hepatocyte ß-adrener-gic responsiveness and guanine nucle-otide-binding regulatory proteins. Ameri-can Journal of Physiology, 256: C384-C389.
7. Hernández-Sotomayor SM T, M acías-Silva M , Plebanski M & García-Sáinz JÁ (1988). Homologous and heterologous ß-adrener-gic desensitization in hepatocytes. Addi-tivity and effect of pertussis toxin. Bio-chimica et Biophysica Acta, 972: 311-319. 8. Katz M S, M cNair CL, Hymer TK & Boland SR (1987). Emergence of beta-adrener-gic-responsive hepatic glycogenolysis in male rats during post-maturational aging. Biochemical and Biophysical Research Communications, 147: 724-730. 9. Itoh H, Okajima F & Ui M (1984).
Conver-sion of adrenergic mechanism from an a -to a ß-type during primary culture of rat hepatocytes. Journal of Biological Chem-istry, 259: 15464-15473.
10. Souza HM , Hell NS, Lopes G, Batista M R & Bazotte RB (1994). Effect of combined administration of counterregulatory hor-mones during insulin-induced hypoglyce-mia in rats: lipolysis mediated by ß-adre-nergic mechanism contributes to hyper-glycemia. Brazilian Journal of M edical and Biological Research, 27: 2883-2887. 11. Souza HM , Hell NS, Lopes G, Batista M R
& Bazotte RB (1996). Synergistic effect of combined administration of counterregu-latory hormones during insulin-induced hypoglycemia (IIH) in rats: The participa-tion of lipolysis and gluconeogenesis to the hyperglycemia. Acta Pharmacologica
Sinica, 17: 455-459.
12. Lopes G, Lima FB, Hell NS, Vardanega M & Bazotte RB (1998). The responsiveness of glycogen catabolism to adrenergic ago-nists during insulin-induced hypoglycemia (IIH) in rat livers. General Pharmacology, 30: 593-599.
13. Bergmeyer HU & Bernt E (1974). Deter-mination of glucose w ith glucose-oxidase and peroxidase. In: Bergmeyer HU (Edi-tor), M ethods of Enzymatic Analysis. Vol. 2. Academic Press, New York, 1205-1215. 14. Desbuquois B & Aurbach GD (1971). Use of polyethyleneglycol to separate free and antibody-bound peptide hormones in ra-dioimmunoassays. Journal of Clinical En-docrinology, 33: 732-738.
15. Ferraz M , Brunaldi K, Oliveira CE & Bazotte RB (1997). Hepatic glucose pro-duction from L-alanine is absent in per-fused liver of diabetic rats. Research Com-munications in M olecular Pathology and Pharmacology, 95: 147-155.
16. Gutmann I & Wahlefeld W (1974). L-(+)-Lactate. Determination w ith lactate dehy-drogenase and NAD. In: Bergmeyer HU (Editor), M ethods of Enzymatic Analysis. Vol. 2. Academic Press, New York, 1464-1472.
M ethods of Enzymatic Analysis. Vol. 2. Academic Press, New York, 1446-1448. 18. Kimmig R, M auch TJ, Kerzl W, Schw abe
U & Scholz R (1983). Actions of glucagon on flux rates in perfused rat liver. 1. Kinet-ics of the inhibitory effect on glycolysis and the stimulatory effect on glycogenoly-sis. European Journal of Biochemistry, 136: 609-616.
19. Hassid WZ & Abraham S (1957). Chemi-cal procedures for analysis of polysaccha-rides. In: Colow ick SP & Kaplam NO (Edi-tors), Enzym ology. Vol. 3. Academic Press, New York, 34-51.
20. Thomas JÁ, Schlender KK & Larner J (1968). A rapid filter paper assay for UDPglucose-glycogen glucosyltransfer-ase, including an improved biosynthesis of UDP-14C-glucose. Analytical Biochem-istry, 25: 486-499.
21. Stümpel F, Kucera T, Bazotte RB & Püschel GP (1996). Loss of regulation by sympathetic hepatic nerves of liver me-tabolism and hemodynamics in chronically streptozotocin diabetic rats. Diabetologia, 39: 161-165.
22. Cryer P (1993). Glucose counterregula-tion: prevention and correction of
hypogly-cemia in humans. American Journal of Physiology, 264: E149-E155.
23. Garcia C, Pithon-Curi TC, De Lourdes-Firmano M , Pires-de-M elo M , New sholme P & Curi R (1999). Effects of adrenaline on glucose and glutamine metabolism and superoxide production by rat neutrophils. Clinical Science, 96: 549-555.