Re sidual ß-ce ll functio n and
m icro vascular co m plicatio ns in
type 1 diabe tic patie nts
Disciplinas de 1Diabetes e Metabologia, 2O ftalmologia and 3Cardiologia, Universidade do Estado do Rio de Janeiro,
Rio de Janeiro, RJ, Brasil M.B. Gomes1,
M.F.R. Gonçalves1,
R. Neves2, C. Cohen3
and F.M. Albanesi3
Abstract
To determine the influence of residual ß-cell function on retinopathy and microalbuminuria we measured basal C-peptide in 50 type 1 diabetic outpatients aged 24.96 ± 7.14 years, with a duration of diabetes of 9.1 ± 6.2 years. Forty-three patients (86%) with low C-peptide (<0.74 ng/ml) had longer duration of diabetes than 7 patients (14%) with high C-peptide (³0.74 ng/ml) (9 (2-34) vs 3 (1-10) years,
P = 0.01) and a tendency to high glycated hemoglobin (HBA1) (8.8 (6-17.9) vs 7.7 (6.9-8.7)%, P = 0.08). Nine patients (18%) had
microalbu-minuria (two out of three overnight urine samples with an albumin excretion rate (AER) ³20 and <200 µg/min) and 13 (26%) had background retinopathy. No association was found between low C-peptide, microalbuminuria and retinopathy and no difference in basal C-peptide was observed between microalbuminuric and normoalbu-minuric patients (0.4 ± 0.5 vs 0.19 ± 0.22 ng/ml, P = 0.61) and between
patients with or without retinopathy (0.4 ± 0.6 vs 0.2 ± 0.3 ng/ml, P =
0.43). Multiple regression analysis showed that duration of diabetes (r = 0.30, r2 = 0.09, P = 0.031) followed by HBA
1 (r = 0.41, r2 = 0.17, P
= 0.01) influenced basal C-peptide, and this duration of diabetes was the only variable affecting AER (r = 0.40, r2 = 0.16, P = 0.004). In our
sample of type 1 diabetic patients residual ß-cell function was not associated with microalbuminuria or retinopathy.
Co rre spo nde nce M.B. Gomes
Estrada Barra, 1006, Bl. 3/502
22648-900Rio de Janeiro, RJ Brasil
Fax: + 55-21-204-2343
Research supported by CNPq (No. 520.118/94). C. Cohen is the recipient of a CAPES fellowship.
Received September 9, 1998 Accepted January 3, 2000
Ke y wo rds ·C-peptide ·Microalbuminuria ·Retinopathy ·Diabetes type 1
Intro ductio n
The measurement of C-peptide in type 1 diabetic patients is an important method for estimating residual ß-cell function (1). Al-though the majority of type 1 diabetic pa-tients have only traces of C-peptide after 6-8 years of diabetes, in some patients a detect-able level of C-peptide could be observed
after many years of disease (2). Even though interpretation of these studies could be hin-dered by the inclusion of heterogeneous pa-tient populations we must argue about the impact of detectable but subnormal C-pep-tide values on glycemic control and evolu-tion to microvascular complicaevolu-tions of dia-betes (3,4).
yielded conflicting results probably because the relationship of C-peptide secretion to diabetic complications independent of gly-cemic control is difficult to establish (5). However, recent studies have demonstrated that C-peptide administration to type 1 dia-betic patients could improve glomerular fil-tration rate (6), microalbuminuria (7) and
autonomicnerve function (8), with no
sig-nificant influence on glycemic control (8). These actions indicate that C-peptide could be biologically active.
The purpose of the present study was to determine the association of basal C-peptide levels with the frequency of microalbuminu-ria and retinopathy among a subset of type 1 diabetic patients and also to analyze the possible factors associated with basal C-peptide levels.
Subje cts and Me tho ds
Subje cts
We studied 50 type 1 diabetic outpatients (22 males, 28 females) regularly attending the diabetes clinic at the State University of Rio de Janeiro, aged 24.96 ± 7.14 years, with a disease duration of 9.1 ± 6.2 years (11 patients <5 years, 18 ³5 and <10 years, and
21 ³10 years). The patients were asked to
provide three accurately timed overnight urine samples over a period of six months. All patients studied were insulin dependent since diagnosis but none of them had symp-toms of diabetes decompensation or were taking antihypertensive medication. All patients were instructed to collect urine un-der their usual conditions, avoiding inten-sive physical activity. Normal serum creati-nine and normal urinary sediments were used to exclude overt renal disease. All patients took their usual dose of insulin after blood collection. The experimental protocol was approved by the local Ethics Committee and informed consent was obtained from all par-ticipants.
Me tho ds
The albumin excretion rate (AER) was determined in timed overnight urine samples. All urine samples were collected into con-tainers without a preservative. Urine volume was recorded and urine aliquots were stored in glass tubes at -20o
C until analysis (within one month). Fasting blood samples were also obtained for C-peptide, glucose, and
glycated hemoglobin (HBA1) determinations.
C-peptide concentrations were measured by
radioimmunoassays in sera stored at -20o
C for up to 3 months (Diagnostic Product Cor-poration, Los Angeles, CA, USA), after re-moval of insulin antibodies by precipitation with polyethylene glycol (PEG). The lower limit of detection of this assay is 0.05 ng/ml. The inter- and intra-assay coefficients of variation were 10 and 7%, respectively. Urine albumin concentration was estimated by double antibody radioimmunoassay (Diag-nostic). This method has a sensitivity of 0.3 µg/ml, and in our laboratory interassay and intra-assay coefficients of variation were 3.5 and 2.7%, respectively. Microalbuminuria was defined as an AER >20 µg/min and <200 µg/min in at least two out of three overnight urine specimens. Each urine speci-men was tested for bacteriuria and if this was
more than 100,000/mm3 the urine was
dis-carded. HBA1 was determined by cation
ex-change chromatography (Boehringer-Mann-heim, Mann(Boehringer-Mann-heim, Germany; reference range 4.5-8%), and fasting blood glucose (FBG) was measured by the glucose oxidase method (Cobas - Mira Roche, Reutkroz, Switzer-land). Retinopathy was assessed by fundos-copy through a dilated pupil by ophthalmos-copy performed by the same ophthalmolo-gist and patients were classified into groups according to degree of retinopathy (normal, background, proliferative). The most seri-ously affected eye was used for evaluation.
Weight and height were measured to the nearest 0.1 kg and 0.1 cm, respectively. Body
mass index (BMI, kg/m2
from these measurements. The daily insulin dose was also recorded.
Statistical analysis
The Mann-Whitney U-test was used for comparisons between groups and the Fisher exact test was used for other comparisons. For stepwise multiple and univariate regres-sion analysis, AER and all the variables not normally distributed were log trans-formed. For statistical analysis, C-peptide levels below the detection limit of the assay were assigned a value of 0.05 ng/ml. Patients were divided into three groups according to basal C-peptide level: undetectable (<0.05
ng/ml), low (³0.05 and <0.74 ng/ml) and
high (³0.74 ng/ml). This classification was based on our previous observation that 100% of a nondiabetic comparison group had basal
C-peptide level ³0.74 ng/ml which was the
mean minus two standard deviations for this group (9). The mean intraindividual coeffi-cient of variation for AER was also calcu-lated. Stepwise multiple regression analysis was performed on the pooled diabetic group using two models: one with AER and the other with basal C-peptide as the dependent variable. The independent variables selected were age, age at diagnosis, duration of dia-betes, daily insulin dose, BMI, FBG and
HBA1. Basal C-peptide was also entered as
an independent variable in the model with AER as the dependent variable. Stepwise multiple logistic regression analyses were performed to investigate the risk factors for retinopathy with duration of diabetes,
C-peptide level, AER, HBA1 as independent
variables. The odds ratio was given with
95% confidence limits (CL).These analyses
were performed using SPSS (version 6.0) and EPI INFO (version 6.0). Values are re-ported as means ± SD for normally distrib-uted data and as medians (minimum/maxi-mum) for skewed data. The significance level to be considered was 95% and the statistical power 80%.
Re sults
Type 1 diabetic patients showed a me-dian C-peptide level of 0.2 ng/ml (0.05-2.6). Nineteen (38%), 24 (48%) and 7 patients (14%), respectively, showed undetectable, low and high C-peptide levels. Since we did not find differences between the patients with undetectable and low C-peptide in any variable analyzed, the two groups were com-bined into one (low C-peptide level). The group of low C-peptide levels had a higher duration of diabetes than the group with high C-peptide levels (9 (2-34) vs 3 (1-10) years, P = 0.01). We observed a tendency to high
HBA1 levels in the low C-peptide group
compared with the high C-peptide group (8.8 (6-17.9) vs 7.7 (6.9-8.7)%, P = 0.08). No
difference was found between groups con-cerning gender, age, age at diagnosis, daily insulin dose or BMI.
No association was noted between low C-peptide level and the frequency of micro-albuminuria or retinopathy. The clinical char-acteristics of type 1 diabetic patients defined by C-peptide level are shown in Table 1. A total of 9 patients (18%) (4 females and 5
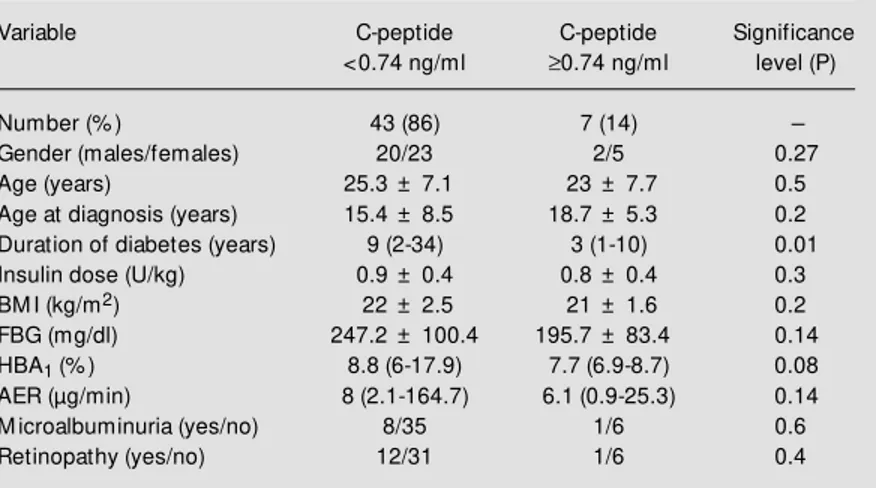
Table 1 - Clinical characteristics of 50 type 1 diabetic patients classified by C-peptide level.
Data for duration of diabetes, AER and HBA1 are reported as medians (minimum/
maximum). The other data are reported as means ± SD. M ann-Whitney U-test w as used for comparison betw een groups (tw o-sided P<0.05). Fisher’s exact test w as used for comparison betw een categorical data. BM I, Body mass index; FBG, fasting blood glucose; AER, albumin excretion rate; HBA1, glycated hemoglobin.
Variable C-peptide C-peptide Significance
<0.74 ng/ml ³0.74 ng/ml level (P)
Number (% ) 43 (86) 7 (14)
-Gender (males/females) 20/23 2/5 0.27
Age (years) 25.3 ± 7.1 23 ± 7.7 0.5
Age at diagnosis (years) 15.4 ± 8.5 18.7 ± 5.3 0.2
Duration of diabetes (years) 9 (2-34) 3 (1-10) 0.01
Insulin dose (U/kg) 0.9 ± 0.4 0.8 ± 0.4 0.3
BM I (kg/m2) 22 ± 2.5 21 ± 1.6 0.2
FBG (mg/dl) 247.2 ± 100.4 195.7 ± 83.4 0.14
HBA1 (% ) 8.8 (6-17.9) 7.7 (6.9-8.7) 0.08
AER (µg/min) 8 (2.1-164.7) 6.1 (0.9-25.3) 0.14
M icroalbuminuria (yes/no) 8/35 1/6 0.6
males) were considered microalbuminuric. Mean intraindividual coefficient of varia-tion in AER was 55.4%. No difference in basal C-peptide level was observed between microalbuminuric and normoalbuminuric patients (0.4 ± 0.5 vs 0.19 ± 0.22 ng/ml, P =
0.61).
A total of 13 patients (26%) (7 females and 6 males) had background retinopathy. No proliferative retinopathy was observed. No difference in basal C-peptide level was observed between patients with or without retinopathy (0.4 ± 0.6 vs 0.2 ± 0.3 ng/ml, P =
0.43).
The results of univariate analysis are shown in Table 2. In the stepwise multiple regression analysis with basal C-peptide level as the dependent variable, duration of diabe-tes (step 1 (r = 0.30, r2
= 0.09, P = 0.031; ß coefficient (95% CL) = -0.47 (-0.90/-0.04)) and HBA1 (step 2 (r = 0.41, r
2
= 0.17, P = 0.01; ß coefficient (95% CL) -1.69 (-3.18/ -0.20)) were the only significant variables. Duration of diabetes was the only significant independent variable (r = 0.40, r2
= 0.16, P = 0.004; ß coefficient (95% CL) 0.53 (0.18/ 0.89)) in the stepwise multiple regression analysis performed with AER as a depend-ent variable. In multiple logistic regression analysis with retinopathy as a dependent variable, AER yielded a marginally signifi-cant odds ratio of 1.03 (95% CL), 0.99-1.06; ß coefficient = 0.0286; Wald 3.10.
D iscussio n
Most type 1 diabetic patients (86%) had a
low level of basal C-peptide. However, in 7 patients (14%) a high level of basal C-pep-tide was observed. This suggests that some type 1 diabetic patients may retain some insulin secretory capacity (3). Total or par-tial diabetes remission in these patients seems improbable because no discontinuation or a 50% decrease of total daily insulin dose since diagnosis of diabetes was noted in any of them (10). Although we did not perform a stimulation test to assess residual ß-cell func-tion, the cut-off value of 0.74 ng/ml was similar to others reported thus far, i.e., 0.6 (5), and 0.79 (11) which were used to dis-criminate patients concerning the presence or absence of residual ß-cell function. Previ-ous studies have observed a close correla-tion between fasting and stimulated C-pep-tide levels in type 1 diabetic patients but there is no agreement about which is the best stimulus and criterion to be used in the stim-ulation test to characterize residual ß-cell function (4,5,9). In agreement with other studies, these seven patients had a short duration of diabetes and a tendency to better metabolic control (1,5). Since our sample mostly comprised pubertal and young adults we did not find the correlation between basal C-peptide and age described in many other reports (1,3,12).
Although we noteda tendency to a
nega-tive correlation between basal C-peptide and daily insulin dose in univariate analysis, stepwise multiple regression analysis showed
that duration of diabetes wasthe most
im-portant variable influencing C-peptide
lev-els, followed by HBA1, as also reported by
others with respect to basal (5) and stimulat-ed C-peptide (1,5).
Although we observed a negative corre-lation between basal C-peptide and AER in univariate analysis, duration of diabetes was the only significant independent variable in stepwise multiple regression. In multiple lo-gistic regression with retinopathy as a de-pendent variable, only AER appeared to be a risk factor but yielded a marginally signifi-Table 2 - Univariate regression analysis of C-peptide level against clinical and laboratory
data.
AER, Albumin excretion rate.
Variable r r2 ß coefficient P value
Duration of diabetes (years) -0.30 0.09 -0.5 0.01
Insulin dose (U/kg) -0.27 0.07 -1.5 0.06
cant odds ratio.
Although our data also suggest that en-dogenous insulin secretion estimated by ba-sal C-peptide had no association with micro-albuminuria or retinopathy, two points con-cerning our patients should be discussed. First, our sample comprised mostly young patients with a relatively short duration of diabetes (58% with <10 years) and conse-quently we had only 7 and 13 patients with microalbuminuria and retinopathy, respec-tively. The second point was the small num-ber of patients (N = 7) with high basal C-peptide levels. For an 80% statistical power a sample comprising 92 patients would be necessary to avoid a type 2 statistical error which may have occurred with our sample. Even though these facts could have influ-enced our results, a prospective study with different types of diabetes has not demon-strated an effect of higher levels of basal C-peptide on 6-year progression of retinopathy in younger onset insulin-dependent patients (4). The level of glycemic control was the most important predictor of the incidence of retinopathy (4). Another 2-year prospective study with type 1 diabetics also did not find an influence of stimulated C-peptide on the evolution of retinopathy and/or microalbu-minuria (13). Since we found a negative correlation between basal C-peptide and HBA1, it is possible that low basal C-peptide
levels could be associated with difficulty in achieving a good metabolic control and may
influence the development of diabetic
com-plications. However, since HBA1 was not a
significant independent variable in stepwise multiple regression analysis with AER as a dependent variable probably because of the study design (cross-sectional one), this fact seems improbable. On the other hand, some studies have suggested a protective effect of residual ß-cell function against the onset of nephropathy and/or retinopathy (14-16), in-cluding the breakdown of the blood retinal barriers (17). It is important to emphasize that two of these studies (15,16) were done mostly in patients with noninsulin-depend-ent diabetes.
Homogeneity in the pattern of decline of ß-cell function was observed in a recent prospective study of type 1 diabetic patients followed for up to 7.4 years (12). It was also observed that the type of insulin treatment had no influence on the overall decline of basal and stimulated C-peptide (5). These data suggest that the underlying destructive process affecting ß-cells develops faster than the beginning of the pathogenic process of microvascular complications of diabetes.
In conclusion, we found no association between basal C-peptide level, microalbu-minuria and retinopathy. A larger sample
and also aprospective study on type 1
dia-betic patients should confirm if high levels of basal C-peptide have any influence on the development of microvascular complications of diabetes independent of glycemic control.
Re fe re nce s
1. Clarson C, Daneman D, Drash AL, Becker DJ & Eherlich RM (1987). Residual ß-cell function in children w ith IDDM : reproduc-ibility of testing and factors influencing insulin secretory reserve. Diabetes Care, 10: 33-38.
2. Ludvigsson J & Heding LG (1976). C-pep-tide in children w ith juvenile diabetes. Di-abetologia, 12: 627-630.
3. M adsbad S (1983). Prevalence of residual ß-cell function and its metabolic conse-quences in type 1 (insulin-dependent)
dia-betes. Diabetologia, 24: 141-147. 4. Klein R, Klein BEK & M oss SE (1995). The
Wisconsin Epidemiologic Study of Dia-betic Retinopathy. The relationship of C-peptide to the incidence and progression of diabetic retinopathy. Diabetes, 44: 796-801.
5. The DCCT Research Group (1987). Effects of age, duration and treatment of insulin-dependent diabetes mellitus on residual ß-cell function: observations during eligi-bility testing for the diabetes control and
complications trial. Journal of Clinical En-docrinology and M etabolism, 65: 30-35. 6. Johansson B-L, Sjoberg S & Wahren J
(1992). The influence of C-peptide on re-nal function and glucose utilization in type 1 (insulin-dependent) diabetic patients. Di-abetologia, 35: 121-128.
8. Johansson B-L, Linde B & Wahren J (1992). Effects of C-peptide on blood flow , capillary diffusion capacity and glucose uti-lization in the exercising forearm in type 1 (insulin-dependent) diabetic patients. Dia-betologia, 35: 1151-1158.
9. Pozzan R, Dim et z T, Gazzola HM & Gomes M B (1997). Discriminative capac-ity of fasting C-peptide levels in a func-tional test according to different criteria of response to a stimulus. Acta Diabetolo-gica, 34: 42-45.
10. Agner T, Damm P & Binder C (1987). Remission in IDDM : prospective study of basal C-peptide and insulin dose in 268 consecutive patients. Diabetes Care, 10: 164-169.
11. M aislos M , Bonder-Fishm an B &
Weitzman S (1994). Prevalence and clini-cal characteristics of type I and II insulin-treated diabetes in the community. Dia-betes Care, 17: 1230-1231.
12. Snorgaard O, Lassen LH & Binder C (1992). Homogeneity in pattern of decline of ß-cell function in IDDM . Diabetes Care, 15: 1009-1013.
13. Winocour PH, Jeacock J, Kalsi P, Gordon C & Anderson DC (1990). The relevance of persistent C-peptide secretion in type 1 (insulin-dependent) diabetes mellitus to glycaemic control and diabetic complica-tions. Diabetes Research and Clinical Practice, 9: 23-35.
14. Sjoberg S, Gjotterberg M , Lefvert AK, Gunnarsson R & Ostman J (1986). Signifi-cance of residual insulin production in
long-term type I diabetes mellitus. Trans-plantation Proceedings, 18: 1498-1499. 15. M oster M A (1984). Circulating C-peptide
and diabetic retinopathy. Diabetes Re-search, 1: 151-154.
16. Suzuki K, W at anabe K, M ot egi T & Kajinuma H (1989). High prevalence of proliferative retinopathy in diabetic pa-tients w ith low pancreatic ß-cell capacity. Diabetes Research and Clinical Practice, 6: 45-52.