Utilization of medicines by the Brazilian
population, 2003
Características da utilização de medicamentos
na população brasileira, 2003
1 Gerência de Medicamentos, Agência Nacional de Vigilância Sanitária, Brasília, Brasil. 2 Programa Nacional de DST e AIDS, Ministério da Saúde, Brasília, Brasil.
3 Centro de Informação Científica e Tecnológica, Fundação Oswaldo Cruz, Rio de Janeiro, Brasil.
Correspondence M. F. Carvalho
Gerência de Medicamentos, Agência Nacional de Vigilância Sanitária. SQN 411, Bloco F, apto. 107, Asa Norte, Brasília, DF 70866-060, Brasil. [email protected]
Marcelo Felga de Carvalho 1 Ana Roberta Pati Pascom 2
Paulo Roberto Borges de Souza-Júnior 3 Giseli Nogueira Damacena 3
Célia Landmann Szwarcwald 3
Abstract
The aim of the present study was to characterize the utilization of medicines by the Brazilian population, using data from the Brazilian World Health Survey. Medicines were grouped accord-ing to the active pharmaceutical accord-ingredient based on an adaptation of the World Health Or-ganization standard list of essential medicines. The analysis included the characteristics of in-dividuals who keep medicines at home and who had used them within the reference period (with-in two weeks prior to the (with-interview), accord(with-ing to presence of medical prescription. Nearly half of the participants (49.0%) reported use of med-icines during the reference period. Older and wealthier individuals and those with chronic diseases or disabilities and with poor self-rated health keep and use medicines more frequently. For 25.0% of the individuals that had used med-icines during the reference period, none of the drugs had been prescribed by a health profes-sional. Among the individuals who had medi-cines prescribed in the last appointment, 13.0% were unable to obtain the prescribed medica-tion (of these, 55.0% could not afford it). The most widely utilized group was that of the anal-gesics (22.0%), and only 51.0% of the individu-als using this type of medicine had received a medical prescription for it.
Drugs; Drug Utilization; Drug Prescriptions
Introduction
According to the World Health Organization ( WHO), the rational use of medicines occurs when patients receive adequate medication for their clinical needs, at doses corresponding to individual requirements, and at the lowest pos-sible cost for the patient and society 1.
One of the most serious problems in con-temporary society is the non-rational use of medicines. Currently, more than 50.0% of all medicines prescribed, dispensed, or sold are used improperly. Meanwhile, a third of the world population lacks essential drugs 1. Ac-cording to Wannmacher 2, one of the main problems associated with irrational use is the diversity of available pharmaceutical products which, together with the high frequency of new discoveries in the field, facilitates over-con-sumption by some, while failing to reach those who most need medication.
Viewing access to medicines both in terms of their affordability and their availability in health and pharmaceutical services 4, the ex-planations for difficulties in access to essential drugs in the poor countries relate not only to the population precarious socioeconomic con-ditions, but also to lack of organization health services, inadequate supply system manage-ment, and irrational prescription 2. As to medi-cine utilization, although intrinsically related to access, it also depends on individual need, and can occur simultaneously with or subse-quent to access.
In the Brazilian pharmaceutical policy con-text, the guidelines adopted by the Ministry of Health for the industry are based on Ruling 3.916 of October 1998, namely “to guarantee the necessary safety, efficacy, and quality of medicines and to promote of rational use and universal access by the population to what are considered essential drugs”. These measures have been implemented in both the public and private sectors and at different levels of health system management, and medicines are con-sidered an essential input for full care practices of the Unified National Health System (SUS) 5.
The right to essential drugs has been a fre-quent issue in the debate both on the agendas of international agencies 6and that of the Brazil-ian government, which has adopted various strategies to reduce the cost of medicines, in-cluding local production of generics 7.
Difficulty in acquiring the medicines need-ed to treat health problems has also been the object of discussion in society, since medicines are part of citizens’ daily lives and part of the family budget 8. According to data from the
Na-tional Sample Household Survey(PNAD) in 1998, among the poorest tenth of Brazilian house-holds, the majority of health expenses go to purchasing medicines 9.
Studies in Brazil have demonstrated that use of medicines varies with age, sex, health conditions, and other social, economic, and demographic factors. Consumption is higher among the elderly, with two to five products used simultaneously and over-consumption of superfluous (unnecessary) medicines, but also under-utilization of essential drugs for disease control 10.
In 2003, a national household survey was conducted in Brazil, the World Health Survey
(WHS), as part of a WHO project to assess health systems performance in member countries. The current study aims to characterize the
utiliza-tion of medicines by the Brazilian populautiliza-tion, using WHS data.
Methodology
The WHS was conducted in Brazil in 2003. A to-tal of 5,000 adults (18 years and older) were in-terviewed. Sampling was done in three stages. In the first, 250 census tracts with probability proportional to size, explicitly stratified accord-ing to situation (urban or rural) and municipal-ity size (< 50,000 inhabitants; 50,000-399,999; and over 400,000). Socioeconomic level, de-fined by the mean income of heads-of-house-holds in the tract, was used for implicit stratifi-cation.
Twenty households were randomly selected by inverse sampling in each tract and in the-household, one adult was selected with equi-probability among the household residents to answer the individual questionnaire.
The current analysis was done using the WHS “Medicine Inventory” module. The first question was whether some medicine was kept at home. If the answer was affirmative, the in-terviewer asked whether the individual had tak-en some medicine in the two weeks prior to the interview. If this answer was positive, the inter-viewer asked to see the packaging and medical prescription(s) for this medicine used in the previous two weeks. The interviewer then record-ed the product’s brand and/or generic name and whether the medication had been pre-scribed by a health professional.
In the data consolidation, the medicines were grouped according to the active pharma-ceutical ingredient. The basis for the grouping was an adaptation of the WHO model list 11. The names of all the Brazilian medicines cited by interviewees were listed and subsequently categorized by specific groups, according to the brand and/or generic name, after consult-ing the pharmaceutical reference catalogues
Dicionário de Especialidades Farmacêuticas12 and/or Dicionário Terapêutico Guanabara13.
In the analysis of grouping by active ingre-dient, only the groups of medicines with a fre-quency greater than 1.0% were considered. Those with a frequency less than 1.0% were grouped in the category “others”.
The groups of medicines analyzed were dis-tributed as follows:
antihypertensive, anti-arrhythmic and anti-hy-potensive medicines, diuretics, statins);
3. Medicines acting on the respiratory tract (anti-asthmatics, anti-flu, nasal decongestants); 4. Psychoactive medicines (depressive orders, obsessive disorders, panic attack, bipolar disor-der, generalized anxiety, and sleep disorders);
5. Hormones, other endocrine medicines, and contraceptives (hormone, thyroid disor-ders, diabetes, contraceptives);
6. Anti-infectious medicines (antibiotics, antiparasitics, antivirals, antimalarials);
7. Vitamins, minerals, and nutritional sup-plements;
8. Herbal medicines;
9. Anticonvulsants and anti-epileptics; 10. Gastrointestinal medicines (antispas-modics, antacids, anti-ulcers, anti-emetics);
11. Other medicines (all those not classified in the groups specified above).
Since this set of data was obtained by a com-plex sample, combining first-stage stratifica-tion, clustering, and unequal selection proba-bilities, the information on selection stratum and sampling weight were incorporated into the statistical data analysis, using the SUDAAN software.
The analysis included the characteristics of persons who kept medicines at home, who had used medicines in the two weeks prior to the interview, and who had used medicines pre-scribed by health professionals during this ref-erence period. The socio-demographic variables considered in the study were: age group (18-39, 40-59, 60+); sex; schooling (incomplete primary, complete primary or greater); population size of the municipality of residence (50,000 or fewer, 50,000 to 399,999, 400,000 and more); and num-ber of household assets (0-3, 4-7, 8 and more), measured in an interval from 0 to 11, ascribing one point each to the presence of a refrigera-tor, television set, sound system, clothes wash-er, dishwashwash-er, microwave oven, wire-line tele-phone, cell tele-phone, computer, one automobile, and two or more automobiles in the household.
Differences in the use of medicines were al-so analyzed by two measures of self-rated mor-bidity: self-evaluation of health status (very good or good, moderate, bad or very bad) and presence of a chronic disease or disability.
The mean numbers of medicines used in the two weeks prior to the interview were cal-culated for individuals who had or had not tak-en medicines, analyzed by all the socio-demo-graphic variables considered in the study.
The χ2heterogeneity test was used to test the differences in proportions, while the tand
in means.
Access to the prescribed medicines was de-fined by the following questions: “At your last appointment, did the health professional pre-scribe some medicine?”. “If so, how many of these medicines were you able to obtain?” The options in this latter question were: all, the ma-jority, very few, none. For those who were un-able to obtain all the prescribed medicines, the interviewer asked the reason, among the fol-lowing: cannot afford, cannot find all, did not believe they were all necessary, began to feel better, already had some of the medicines at home, others.
Results
Among the 5,000 interviewees, 71.1% reported keeping some type of medicine at home (n = 3,554). This proportion was 76.6% and 64.6% for women and men, respectively. Among indi-viduals 60 years and older, the percentage was 83.5%, while among younger individuals (18-39 years) it was 66.2%. There was also an asso-ciation with socioeconomic level: individuals with more schooling tended to keep medicines at home more frequently, as did those with more household assets. In municipalities with 400,000 inhabitants or more, the proportion was also significantly higher (Table 1).
In the group of individuals who rated their own state of health as good or very good, the proportion who kept some medicine at home was lower than among those who perceived their own health as bad or very bad (67.6% and 81.4%, respectively). In addition, 86.0% of individuals with some chronic disease or dis-ability kept some type of medicine at home (Table 1).
previ-ous two weeks, while in the group that rated their health as good this figure was only 38.0%. In addition, 77.0% of persons with a chronic disease or disability with limitation of daily ac-tivities had used some type of medicine in the previous two weeks (Table 1).
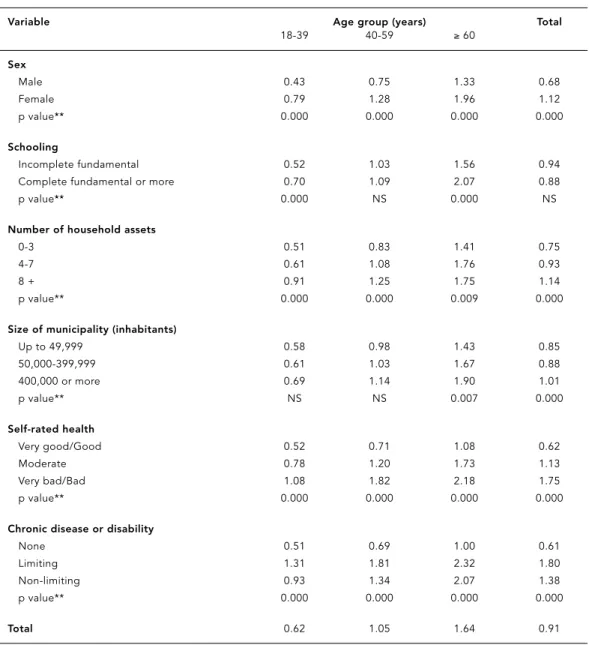
Data in Table 2 show that elderly Brazilians (60 years or older) use an average of 1.6 types of medicine in a two-week period, varying from 1.4 among small-town residents to 1.9 among those in large municipalities. Among the elder-ly with no chronic disease or disability, the mean is 1.0 medicine, but this figure reaches
2.3 among those with a disease that limits daily activities. In general, women use more medica-tion than men, whatever the age group ana-lyzed, as do individuals with more schooling and greater wealth, defined here as the num-ber of household assets.
Table 3 shows the distribution of use of med-icines according to the existence of a medical prescription. Among persons who had used medicines during the two previous weeks, all the drugs had been prescribed by a physician for 68.0%, as compared to none prescribed by a physician for 25.0%. The presence of a medical
Table 1
Proportion (%) of individuals who kept some medicine at home and that had used some medicine in the two weeks prior to the interview, according to socio-demographic variables and self-rated health. Brazil, 2003.
Variable Sample size (n) Kept some medicine Used some medicine in the at home previous two weeks
% p value* % p value*
Sex
Male 2,291 64.6 0.000 39.0 0.000
Female 2,709 76.6 57.2
Age group (years)
18-39 2,633 66.1 0.000 38.9 0.000
40-59 1,620 73.4 54.0
60 and over 747 83.5 73.0
Schooling
Incomplete fundamental 2,772 67.9 0.000 48.7 NS
Complete fundamental or greater 2,227 75.1 48.9
Number of household assets
0-3 1,433 56.9 0.000 42.0 0.000
4-7 2,738 74.0 48.9
8 + 775 87.4 61.4
Size of municipality (inhabitants)
Up to 49,999 1,709 67.6 0.031 46.8 NS
50,000-399,999 1,649 69.7 48.5
400,000 or more 1,642 76.1 51.3
Self-rated health
Very good/Good 2,662 67.6 0.000 38.9 0.000
Moderate 1,872 73.7 57.0
Very bad/Bad 462 81.4 73.8
Chronic disease or disability
None 3,539 64.9 0.000 38.1 0.000
Limiting 965 86.7 76.8
Non-limiting 455 85.6 72.5
Total 5,000 71.1 – 48.8 –
prescription was significantly more frequent among the elderly, women, those with bad self-rated health, and those with chronic disease or disability. For 87.0% of persons over 60 who had used medicines in the two weeks, all the medicines had been prescribed by a health professional. There was no significant differ-ence in the proportions by number of house-hold assets or size of the municipality.
Table 4 shows the proportion of individuals who had used some medicine in the previous two weeks, grouped by type. The highest
pro-portion of utilization was in the group of anal-gesics, anti-inflammatory drugs, antipyretics, and muscle relaxants, with 22.1%, and only about one-half (51.0%) of the individuals using these medicines had done so under a medical prescription. The second largest proportion was assigned to the cardiovascular medicine group, with 14.0%, nearly all of which (99.0%) under a medical prescription. The third and fourth most widely used groups of medicines were “Hor-mones, other endocrine medicines, and con-traceptives” and psychoactive drugs,
respec-Mean* number of medicines used in the two weeks prior to the interview, according to socio-demographic variables and self-rated health. Brazil, 2003.
Variable Age group (years) Total
18-39 40-59 ≥60
Sex
Male 0.43 0.75 1.33 0.68
Female 0.79 1.28 1.96 1.12
p value** 0.000 0.000 0.000 0.000
Schooling
Incomplete fundamental 0.52 1.03 1.56 0.94
Complete fundamental or more 0.70 1.09 2.07 0.88
p value** 0.000 NS 0.000 NS
Number of household assets
0-3 0.51 0.83 1.41 0.75
4-7 0.61 1.08 1.76 0.93
8 + 0.91 1.25 1.75 1.14
p value** 0.000 0.000 0.009 0.000
Size of municipality (inhabitants)
Up to 49,999 0.58 0.98 1.43 0.85
50,000-399,999 0.61 1.03 1.67 0.88
400,000 or more 0.69 1.14 1.90 1.01
p value** NS NS 0.007 0.000
Self-rated health
Very good/Good 0.52 0.71 1.08 0.62
Moderate 0.78 1.20 1.73 1.13
Very bad/Bad 1.08 1.82 2.18 1.75
p value** 0.000 0.000 0.000 0.000
Chronic disease or disability
None 0.51 0.69 1.00 0.61
Limiting 1.31 1.81 2.32 1.80
Non-limiting 0.93 1.34 2.07 1.38
p value** 0.000 0.000 0.000 0.000
Total 0.62 1.05 1.64 0.91
tively, both with high prescription rates. Among the groups used by fewer than 5.0%, gastroin-testinal medicines and herbal medicines showed low prescription rates (64.0%) as compared to the other groups.
The results in Table 5 indicate that of the 3,192 individuals who had medicines prescribed by a health professional at the last appointment, 87.0% had succeeded in obtaining all their med-ication. Among the 417 (13.0%) who had medi-cines prescribed at the last appointment but who had not succeeded in obtaining all the
medicines, 55.0% claimed that they could not pay and 13.0% that they had not found the med-icines.
Discussion
According to the Brazilian WHS data, women use more medicines than men, as do the elder-ly. Among persons 60 years or older, the ones showing the highest use of medicines belong to the higher socioeconomic groups. This pattern
Table 3
Distribution (%) of individuals who had used medicines in the two week prior to the interview, by presence of medical prescription, according to socio-demographic variables and self-rated health. Brazil, 2003.
Variable Medical prescription Total p value
All prescribed At least one None by physician medicine prescribed
prescribed
% % % N %
Sex
Male 65.0 5.8 29.2 887 100.0 0.001
Female 69.9 8.2 21.9 1.542 100.0
Age group (years)
18-39 53.9 8.6 37.5 1.020 100.0 0.000
40-59 73.4 7.2 19.5 867 100.0
60 and over 86.6 5.1 8.3 541 100.0
Schooling
Incomplete fundamental 73.5 5.8 20.7 1.343 100.0 0.000
Complete fundamental or more 61.5 9.1 29.4 1.086 100.0
Number of household assets
0-3 66.6 7.6 25.8 597 100.0 NS
4-7 69.8 6.8 23.4 1.333 100.0
8 + 65.1 8.4 26.5 474 100.0
Size of municipality (inhabitants)
Up to 49,999 71.0 6.8 22.2 796 100.0 NS
50,000-399,999 69.6 5.9 24.4 795 100.0
400,000 or more 63.9 9.1 27.0 837 100.0
Self-rated health
Very good/Good 56.7 8.2 35.2 1.033 100.0 0.000
Moderate 74.5 6.6 18.9 1.060 100.0
Very bad/Bad 83.2 7.0 9.8 334 100.0
Chronic disease or disability
None 57.2 7.7 35.2 1.343 100.0 0.000
Limiting 82.5 7.3 10.2 735 100.0
Non-limiting 81.1 6.1 12.9 328 100.0
Total 68.1 7.3 24.6 2.429 100.0 –
coincides with the use of health services, as widely described in the literature 4,14.
In association with advancing age, as ex-pected, persons with chronic disease or dis-ability use the most medicines. These are the same individuals who spend more on treat-ment. Brazilian WHS data show that 16.0% of persons with a disease and resulting limitation had to borrow money from a financial institu-tion or sell objects to pay their medical care ex-penses 15. Likewise, a nationwide study in 1998 showed that mean monthly expenditure on
medicines represented 23.0% of income for half of the Brazilian elderly population 16.
The results of the current analysis on the mean number of medicines used during the reference period by persons 60 years or older show the existence of a socioeconomic gradi-ent in the use of medicines, regardless of which social status indicator is used. Use by the elder-ly is also greater in larger municipalities. In municipalities with more than 400 thousand inhabitants, the mean number of medicines used is close to two, consistent with the results of previous studies 17. Meanwhile, in small towns the mean number of medicines used was lower than the standard in other countries.
However, it is important to note that the analysis of use of medicines was limited to par-ticipants who kept some medicine at home. The fact that the individual may have used some medicine in the previous two weeks and not kept the package afterwards was an impor-tant limitation to the study.
Excessive use of medicines without a med-ical prescription in the wealthier classes has been attributed to the consumption of super-fluous products, apparently increasing due to over-the-counter sales of certain pharmaceuti-cals in Brazil 10. Corroborating these findings, the survey showed that 22.0% had used medi-cines from the group of analgesics, anti-in-flammatory drugs, antipyretics, and muscle re-laxants in the previous two weeks, but that
on-Table 5
Proportion (%) of individuals who were not able to obtain all the medicines prescribed by the health professional in the last appointment, according to reported reason. Brazil, 2003.
Reason %
Could not pay 55.0 (229/417)*
Did not find 13.2 (55/417)
Did not believe it was necessary 5.6 (23/417)
Improved without medication 7.0 (29/417)
Other 19.2 (80/417)
Total 13.1 (417/3,192)**
* Percentage of individuals who were not able to obtain all the medicines prescribed;
** Percentage of individuals who had medicines prescribed in their last medical appointment.
Proportion (%) of individuals who had used some medicine in the two weeks prior to the interview, grouped by type of medicine, and proportion (%) of individuals who had used medicines with a medical prescription. Brazil, 2003.
Group of medicines Individuals who had Individuals who had used used medicines (%) medicines with medical
prescription, among all those who had used medicines (%)
N % N %
Analgesics, antipyretics, anti-inflammatory drugs, 1,103 22.1 567 51.4
and muscle relaxants
Cardiovascular medicines 673 13.5 667 99.0
Medicines acting on the respiratory tract 159 3.2 116 73.0
Psychoactive drugs 250 5.0 245 98.0
Hormones and other endocrine drugs and contraceptives 301 6.0 292 97.0
Anti-infectious medicines 145 2.9 122 84.1
Vitamins, minerals, and nutritional supplements 121 2.4 95 77.9
Herbal medicines 100 2.0 64 64.0
Anti-convulsive and anti-epileptic medicines 48 1.0 48 100.0
Gastrointestinal medicines 215 4.3 137 64.0
ly 51.0% of these products had been prescribed by a physician.
Interestingly, the percentage of use of med-icines, categorized by their active ingredients, was similar to that found in a study on self-medication in Brazil 18. Although the two stud-ies have different methodologstud-ies, one with da-ta collected in households (WHS) and the oth-er with information collected in pharmacies, both showed that analgesics and anti-inflam-matory drugs are the medicines most widely used without medical prescriptions.
In developed countries, although over-the-counter drug sales have expanded, thereby fa-voring self-medication, the rigid control estab-lished by regulatory agencies makes this prac-tice less problematic than in Brazil. According to the Brazilian Association of the Pharmaceu-tical Industry (ABIFARMA), some 80 million Brazilians self-medicate. The inadequate supply of medicines and non-enforcement of
manda-tory presentation of medical prescriptions, along with low overall schooling, are the most widely cited reasons for the high frequency of self-medication in Brazil 18. In an opinion article on the rational use of medicines, Bermudez 19 comments that the adequacy of prescription and utilization of drugs using scientifically-based criteria are the main current challenges for the SUS.
A positive finding of the Brazilian WHS was the large percentage of individuals (around 87.0%) who succeeded in obtaining the majori-ty of the medicines prescribed by a health pro-fessional at their last appointment. However, among those who failed to obtain their med-ication, lack of money was claimed as the most common reason, cited by more than half of the interviewees, indicating that difficulty in ob-taining the necessary medicines for treatment is a problem that has still not been completely solved by the public health system.
Contributors
M. F. Carvalho was responsible for designing the con-tent and drafting the text. A. R. P. Pascom was respon-sible for the data analysis. P. R. B. Souza Júnior partic-ipated in the data analysis and preparation of the ta-bles. G. N. Damacena participated in the coding of information on medicines and classification of the active ingredients. C. L. Szwarcwald participated in the final draft of the article and the statistical data analysis, and coordinated the survey.
Resumo
O presente estudo tem como objetivo caracterizar a utilização de medicamentos na população brasileira, por meio dos dados da Pesquisa Mundial de Saúde. Os medicamentos foram agrupados de acordo com o princípio ativo baseando-se em uma adaptação da lista padrão da Organização Mundial da Saúde. A análise contemplou as características das pessoas que guardam medicamentos em casa e que utilizaram medicamentos nas duas semanas anteriores à data da pesquisa segundo a presença de prescrição médica. Quase a metade dos participantes relatou uso no pe-ríodo de referência (49,0%). Os indivíduos mais idosos, com maior riqueza, com doença de longa duração ou incapacidade e com auto-avaliação ruim da saúde guardam e utilizam medicamentos com maior fre-qüência. Entre os indivíduos que utilizaram medica-mentos no período de referência, para 25,0%, nenhum foi prescrito por médico. Dentre os indivíduos que tiveram prescrição de medicamentos no último aten-dimento, 13,0% não conseguiram adquirir todos os medicamentos, sendo que 55,0% alegaram que não puderam pagar. A maior proporção de utilização foi encontrada para o grupo dos analgésicos (22,0%), sen-do que somente 51,0% sen-dos indivíduos que utilizaram esses medicamentos o fizeram com prescrição médica.
1. Organización Mundial de la Salud. Perspectivas políticas sobre medicamentos de la OMS. Promo-ción del uso racional de medicamentos: compo-nentes centrales. Geneva: Organización Mundial de la Salud; 2002.
2. Wannmacher L. Uso racional de medicamentos:
medida facilitadora do acesso. In: Bermudez JAZ, Oliveira MA, Eshe A, organizadores. Acceso a me-dicamentos: derecho fundamental, papel del es-tado. Rio de Janeiro: Escola Nacional de Saúde Pública, Fundação Oswaldo Cruz; 2004. p. 91-101.
3. Smith D, Binet L, Bonnevie L, Hakokongas L,
Meybaum, J. Desequilíbrio fatal: a crise de pes-quisa e desenvolvimento de drogas para doenças negligenciadas. Genebra: Médicos Sem Frontei-ras; 2001.
4. Miralles MA, Kimberlin CL. Perceived access to care and medication use among ambulatory el-derly in Rio de Janeiro, Brazil. Soc Sci Med 1998; 46:345-55.
5. Secretaria de Políticas de Saúde, Ministério da Saúde. Política nacional de medicamentos 2001. Brasília: Ministério da Saúde; 2001. (Série C. Pro-jetos, Programas e Relatórios 25).
6. D’Alessio R. Programa de medicamentos essenci-ais OPAS/ OMS. In: Bermudez JAZ, Oliveira MA, Eshe A, organizadores. Acceso a medicamentos: derecho fundamental, papel del estado. Rio de Ja-neiro: Escola Nacional de Saúde Pública, Fun-dação Oswaldo Cruz; 2004. p. 41-4.
7. Conselho Nacional de Saúde. Diretrizes para uma política de medicamentos genéricos. http://www. datasus.gov.br/conselho/DOCUMENTOS/gen2. htm (accessed on Jan/2004).
8. Castro CGSO. Estudos de utilização de medica-mentos: noções básicas. Rio de Janeiro: Editora Fiocruz; 2000.
9. Silveira GS, Osório RG, Piola SF. Os gastos das famílias com saúde. Ciênc Saúde Coletiva 2002; 7:719-13.
10. Rozenfeld S. Prevalência, fatores associados e mau uso de medicamentos entre idosos: uma re-visão. Cad Saúde Pública 2003; 19:717-24. 11. World Health Organization. WHO model list of
es-sential medicines. 2002. http://whqlibdoc.who.int/ hq/2002/a76618.pdf (accessed on 21/Oct/2005). 12. Dicionário de Especialidades Farmacêuticas.
2002-2003. http://www.epuc.com.br/def/ (accessed on Jan/2004).
13. Korolkovas A. Dicionário terapêutico Guanabara. Edição 2001/2002. São Paulo: Editora Guanabara Koogan; 2001.
14. Coelho Filho JM, Marcopito LF, Castelo A. Med-ication use patterns among elderly people in ur-ban area in Northeastern Brazil. Rev Saúde Públi-ca 2004; 38:557-64.
15. Szwarcwald CL, Viacava F, Vasconcellos MTL, Leal MC, Azevedo LO, Queiroz RSB, et al. O Brasil em números. Radis 2004; 23:14-33.
16. Lima-Costa MF, Barreto SM, Giatti L. Condições de saúde, capacidade funcional, uso de serviços de saúde e gastos com medicamentos da popu-lação idosa brasileira: um estudo descritivo ba-seado na Pesquisa Nacional por Amostra de Do-micílios. Cad Saúde Pública 2003; 19:735-43. 17. Laukkanen P, Heikkinen E, Kauppinen M,
Kalli-nen M. Use of drugs by non-institutionalized ur-ban Finns born in 1904-1923 and the association of drug use with mood and self-rated health. Age Ageing 1992; 21:343-52.
18. Arrais PS, Coelho HL, Batista MC, Carvalho ML, Righi RE, Arnau JM. Profile of self-medication in Brazil. Rev Saúde Pública 1997; 31:71-7.
20. Bermudez J. Medicamentos: uma questão polê-mica. Ciênc Hoje 2000; 27:60-2.
Submitted on 04/May/2005