Journal of Chromatography A, 1189 (2008) 435–443
Simultaneous analysis of free amino acids and biogenic amines in
honey and wine samples using in loop orthophthalaldeyde
derivatization procedure
V. Pereira, M. Pontes, J.S. Cˆamara, J.C. Marques
∗Centro de Qu´ımica da Madeira, Departamento de Qu´ımica da Universidade da Madeira, Campus Universit´ario da Penteada, 9000-390 Funchal, Portugal
Available online 15 December 2007
Abstract
This work presents a RP-HPLC method for the simultaneous quantification of free amino acids and biogenic amines in liquid food matrices and the results of the application to honey and wine samples obtained from different production processes and geographic origins. The developed methodology is based on a pre-column derivatization witho-phthaldialdehyde carried out in the sample injection loop. The compounds were separated in a Nova-Pack RP-C18column (150 mm×3.9 mm, 4m) at 35◦C. The mobile phase used was a mixture of phase A: 10 mM sodium
phosphate buffer (pH 7.3), methanol and tetrahydrofuran (91:8:1); and phase B: methanol and phosphate buffer (80:20), with a flow rate of 1.0 ml/min. Fluorescence detection was used at an excitation wavelength of 335 nm and an emission wavelength of 440 nm. The separation and quantification of 19 amino acids and 6 amines was carried out in a single run as their OPA/MCE derivatives elute within 80 min, ensuring a reproducible quantification. The method showed to be adequate for the purpose, with an average RSD of 2% for the different amino acids; detection limits varying between 0.71 mg/l (Asn) and 8.26 mg/l (Lys) and recovery rates between 63.0% (Cad) and 98.0% (Asp). The amino acids present at the highest concentration in honey and wine samples were phenylalanine and arginine, respectively. Only residual levels of biogenic amines were detected in the analysed samples.
© 2007 Elsevier B.V. All rights reserved.
Keywords: Amino acids; Biogenic amines; Honey; Wine; OPA; RP-HPLC
1. Introduction
Amino acids and biogenic amines co-exist in biological and food matrices and participate in several transformation processes [1]. Amino acids play a central role as building blocks of pro-teins and as intermediates in the metabolism. They represent an important part of the human body as proteins are found in muscles, tendons, organs, glands, nails and hair, and pro-mote growth, repair and maintenance of the cells. Amino acids microbial catabolism produces key flavour compounds in foods such as cheese, wine, honey and other fermented foodstuff[2]. From their enzymatic decarboxylation results the formation of biogenic amines [3], undesirable compounds when in higher levels due to the physiological effects in the human organism, consequence of their toxicology. Biogenic amines are a group of organic bases, namely aliphatic (putrescine and cadaverine),
∗Corresponding author. Tel.: +351 291705103; fax: +351 291705149.
E-mail address:[email protected](J.C. Marques).
aromatic (tyramine) and heterocyclic amines (histamine) with low-molecular weight [4]. Consumption of high amounts of these amines, namely histamine, can result in intoxication symp-toms such as headache, nausea, rushes, hypo- or hypertension and digestive problems, whereas tyramine and phenylethy-lamine have been associated with migraines and hypertension [5]. The study of biogenic amines can also be used as an indica-tor of food quality since their occurrence is normally associated with inadequate sanitary conditions during the production proce-dures. The determination of the amino acids and biogenic amines is of great importance in food industry due to nutritional labelling requirements, control of process operating conditions and, even-tually, in the determination of origin, as used for honey[6]in substitution of mellissopalynology. This method, recommended for the analysis and identification of pollens contained in honey, is extremely tedious, high time-consuming and requires a very skilful analyst for data interpretation[7]. Considering that about 1% of the non sugar/water fraction of honey is due to amino acids related to animal and vegetal sources, mainly bees and pollen [8], the amino acids profile can be advantageously used for the
characterization. In a similar way, they can be used for the char-acterization of wines. Amino acids act as a source of nitrogen (30–40%) for yeast during alcoholic fermentation, interacting in the aromatic composition of wine and, according to several authors[9–12], their composition may be a suitable method for the classification of wines according to variety, geographical origin, wine-making technologies and vintage.
Biogenic amines, naturally present in grapes and in wines, derive mostly from malolactic fermentation [13,14] from the decarboxylation of free amino acids by the action of lactic acid bacteria. In recent years, new trends in food safety, together with the consumers’ demand for quality and healthier products, have encouraged several authors to study these compounds in several wines[4,15–17]while in honeys, and as far as we know, no studies have been published. The most common biogenic amines found in wines are histamine, tyramine, putrescine and phenylethylamine[18].
Diverse analytical methods have been proposed for the analysis of amino acids and biogenic amines including gas chromatography (GC)[19–21], high-performance liquid chro-matography (HPLC) [22,23] and capillary electrophoresis (EC) [24,25]. More recently, liquid chromatography cou-pled with tandem mass spectrometry (LC–MS/MS) has been shown to be a very specific and sensitive technique for the determination of underivatized amino acids [2,26–31], but reported applications of these methods to biological measure-ments are limited. Besides involving shorter analysis times the LC–MS/MS technique is expensive and is not avail-able in many research laboratories. There are some methods used for the simultaneous determination of amino acids and biogenic amines by HPLC [32–35], micellar electrokinetic capillary chromatography (MECC) [36] and micellar liquid chromatography (MLC) [37]. Traditionally, the determina-tion of amino acids has been conducted by ion-exchange chromatography, followed by post-column derivatization with ninhydrin. So far, the analysis of these compounds using pre-column derivatization and reversed-phase HPLC separation of the derivatives has become widely accepted and usu-ally shows great sensitivity. Typical derivatization reagents include 9-fluorenylmethyl chloroformate (FMOC-Cl) [38,39], N-(9-fluorenylmethoxycarbonyloxy)succinimide (FMOC-OSu) [35], carbazole-9-yl-acetyl chloride (CRA-Cl)[40], orthophtha-laldeyde (OPA)[41,42], phenyl isothiocyanate (PITC)[41,43], 1-fluoro-2,4-dinitrophenyl-5-l-alanine amide[44]and dansyl-chloride[45,46].
This study indented to develop a simple RP-HPLC method-ology for the simultaneous identification and quantification of amino acids and biogenic amines in liquid food matrices, based on a pre-column OPA derivatization carried out in the chro-matograph injection loop. The OPA/MCE reagent was selected due to its high sensitivity and response to minor amino acids. OPA in the presence of 2-mercaptoethanol (MCE) reacts with amino acids and biogenic amines and proceeds to isoindolic derivatives, at room temperature, in a quick and simple reaction. The secondary amino acids, proline and hydroxyproline, are not determined as they do not react. Some derivatives are unstable making crucial an appropriate control of the reaction and
injec-tion time[47]. Furthermore, this derivatization reagent allows the simultaneous analysis of these compounds without extrac-tion and purificaextrac-tion processes preceding the derivatizaextrac-tion with fluorescent functional group detection[1,24]. In order to sim-plify the derivatization procedure and the reproducibility of the results, this work was focused in the derivatization operating conditions to be accomplished in the sample injection loop. This methodology was applied to honey and wine samples obtained from different production processes and geographic origins.
2. Experimental
2.1. Standards and reagents
Ultra-pure water was obtained from a Milli Q-System (Mil-lipore, Milford, MA, USA) while HPLC-grade methanol was obtained from Sigma–Aldrich (St. Louis, MO, USA). Tetrahy-drofuran (99.5%), ethanol (99.9%), sodium hydroxide (98%), sodium phosphate monobasic monohydrate (98%) are from Panreac Quimica SA (Barcelona, Spain). o-Phthaldialdehyde (p.a.), 2-mercaptoethanol (99%) were supplied by Acros Organ-ics (Geel, Belgium), hydrochloric acid (p.a.) by Riedel-de Ha¨en (Seelze, Germany) and boric acid (99.5%) by Merck Co. (Darm-stadt, Germany).
A kit of high purity l-amino acids (>98%) was supplied by Sigma–Aldrich (St. Louis, MO, USA) and consisted of 1 g of each of the following standards: aspartic acid (Asp), glu-tamic acid (Glu), asparagine (Asn), serine (Ser), glutamine (Gln), histidine (His), glycine (Gly), threonine (Thr), arginine (Arg), alanine (Ala), tyrosine (Tyr), methionine (Met), trypto-phan (Trp), valine (Val), phenylalanine (Phe), isoleucine (Ile), leucine (Leu) and lysine (Lys).
The following standards were supplied by Fluka BioChemika AG (Buchs, Switzerland):␥-aminobutyric acid (GABA) and the biogenic amines: histamine (Him), tyramine (Tym), phenylethy-lamine (Phm) isopenthyphenylethy-lamine (Ism), and cadaverine (Cad). Tryptamine (Trm) was purchased from Acros Organics (Geel, Belgium).
A concentrated 10 g/l stock solution of each amino acid and biogenic amine was prepared in 0.1 M HCl. Calibration stan-dards (ranging from 0.5 to 60.0 mg/l) were prepared in 0.1 M HCl from the concentrated standard solution. Finally, they were filtered through a 0.45m filter (Acrodisc® CR-PTFE, Ann Arbor, SOM, USA), stored in a refrigerator and protected from light.
2.2. Equipment
Table 1
Gradient program employed for the separation of amino acids and biogenic amines
Time (min) Flow (ml/min) Eluent A (%) Curve
0 1.00 100 6
6 1.00 100 6
17 1.00 85 6
25 1.00 80 6
33 1.00 70 6
45 1.00 60 6
61 1.00 20 6
67 1.00 0 6
70 1.00 0 6
71 1.00 100 1
80 1.00 100 6
2.3. Chromatographic conditions
HPLC conditions were as follow: mobile phase A: 1% of tetrahydrofuran, 8% methanol and 91% phosphate buffer (10 mM). Mobile phase B: 80% methanol and 20% phosphate buffer (10 mM).
The flow rate was set at 1 ml/min and the column maintained at 35◦C. The eluted OPA derivatives were detected by moni-toring their fluorescence at 335 and 440 nm as excitation and emission wavelengths, respectively. The injections were per-formed in less than 80 min, including column regeneration and stabilization during the last 13 min. The gradient program used is shown inTable 1.
2.4. Samples
A total of 21 samples were analyzed with the developed method (12 honeys and 9 wines—see Table 2). The honey samples include nine multifloral and three monofloral, from different origins namely Madeira islands (H1–H5), Portugal mainland (H6–H8) and Canary islands (H9–H12), purchased in local stores. The wine samples include four Madeira fortified wines (W1–W4), three Madeira table wines (W5–W7) and two Canarian table wines (W8 and W9) from the following grape varieties: Malvasia, Tinta Negra Mole and Sercial.
Before the derivatization procedure, 200l of the sample were added to 1.5 ml of a 0.4 M borate buffer solution (pH 10.5), homogenized in a vortex agitator and then filtered through 0.45m PTFE filter. In case of honey samples, 5 g were diluted with ultrapure water into a 10 ml volumetric flask and filtered.
2.5. Derivatization
OPA derivatization solution was prepared in a 10 ml vol-ume flask by dissolving 250 mg of reagent in 1.5 ml of ethanol and making up the volume with 0.4 M borate buffer (pH 10.5). Finally 200l of 2-mercaptoethanol was added. At last, the reagent solution was left to settle for 90 min, stored in dark glass vials at 4◦C and freshly prepared every 9 days.
The derivatization procedure was performed in the sample injection loop according to the following sequence: 10l of
Table 2
Samples analyzed by the developed HPLC method
Samples Characteristics Origin
Honey
H1 Multifloral
Madeira islands
H2 Multifloral
H3 Multifloral
H4 Multifloral
H5 Multifloral
H6 Monofloral
Portugal mainland
H7 Multifloral
H8 Monofloral
H9 Multifloral Canary islands
H10 Monofloral
H11 Multifloral
H12 Multifloral
Wine Fortified
W1 Malvasia (sweet)
Madeira islands
W2 Sercial (dry)
W3 Tinta Negra Mole (sweet) W4 Tinta Negra Mole (dry) Table
W5 Malvasia
Madeira islands W6 Tinta Negra Mole (ros´e)
W7 Tinta Negra Mole (red) Table
W8 Malvasia Canary islands
W9 Malvasia
buffered sample mixture were aspired to the injection loop followed by 10l of OPA solution and maintained for 3 min to promote the derivatization reaction. During this period, the flow is maintenance at 0 ml/min to keep the reagent into the loop. Then, the loop content (20l) was forced to enter into the column by changing the mobile phase flow to 1 ml/min.
2.6. Calculations
The concentration of each analyte was obtained by direct interpolation of the peak area in the correspondent linear cali-bration curve (peak area vs. concentration, ranging from 0.5 to 60.0 mg/l). Samples were diluted when needed to comply with the working range.
3. Results and discussion
3.1. Derivatization procedure
Table 3
Retention times, calibration curves (y=ax+b), correlation coefficient (r2), limits of detection (LOD) in mg/l, repeatability (RSD%) and recovery (Rec%) of amino
acids and biogenic amines
Retention times (min) a(×105) b(×105) r2 SD (×105) LOD Rep (RSD%) Rec (%) Amino acids
Aspartic acid 1.33±0.28 23.30 27.40 0.998 14.68 0.71 0.60 98
Glutamic acid 2.52±0.30 21.20 13.40 0.999 14.45 1.41 1.65 91
Asparagine 8.60±0.52 19.10 6.94 0.999 11.89 1.50 1.49 90
Serine 11.10±0.35 32.00 12.30 0.998 28.69 2.30 0.14 85
Glutamine 13.74±0.25 2.29 0.58 0.994 4.07 5.08 4.14 90
Histidine 14.25±0.45 9.54 −3.67 0.998 8.57 2.73 1.92 90
Glycine 17.25±0.38 45.50 −11.70 0.997 52.92 3.75 1.09 87
Threonine 19.15±0.30 24.10 8.92 0.999 18.73 1.96 2.55 88
Arginine 21.89±0.65 17.40 1.72 0.998 15.79 2.62 0.58 85
Alanine 26.15±0.25 36.20 −0.14 0.998 36.15 3.00 0.72 85
GABA 28.50±0.25 30.50 −22.40 0.996 42.26 4.89 0.89 83
Tyrosine 32.50±0.40 17.60 4.87 0.999 12.14 1.79 0.51 91
Methionine 45.20±0.25 21.40 −0.89 0.991 45.14 6.37 7.92 98
Tryptophan 46.25±0.35 31.20 16.70 0.999 16.98 1.10 0.39 91
Valine 47.50±0.20 13.60 −1.56 0.998 12.49 2.87 0.56 82
Phenylalanine 50.20±0.30 19.10 2.21 0.999 15.97 2.39 0.63 83
Isoleucine 52.50±0.45 29.90 10.30 0.999 19.27 1.59 0.88 91
Leucine 53.90±0.25 27.30 3.42 0.999 21.30 2.21 0.67 88
Lysine 59.50±0.40 6.78 −8.75 0.990 15.74 8.26 5.41 82
Biogenic amines
Histamine 49.10±0.45 29.50 −25.30 0.996 4,209,260 5.14 0.40 87
Tyramine 58.90±0.25 28.90 −24.30 0.994 4,972,310 6.00 6.04 82
Tryptamine 63.50±0.30 21.90 −25.10 0.994 3,815,051 6.37 0.66 81
Phenylethylamine 64.75±35 24.20 −18.10 0.995 3,963,053 5.66 0.24 78
Isopenthylamine 65.80±0.20 35.00 1.75 0.994 4,184,279 3.54 5.14 91
Cadaverine 67.00±0.20 20.50 −19.80 0.992 4,182,516 7.09 1.09 63
Most part of published methods requires sample pre-treatment before derivatization [6,48,49]. Param´as et al. [48] developed an OPA/MCE derivatization method for the determi-nation of amino acids in honey that includes a clean-up step and an extraction procedure before derivatization. The devel-oped method has the advantage of a simpler methodology, not requiring any complex pre-treatment for liquid food matrices and only a dilution is carried out, if necessary. OPA-derivatization times are short (3 min) when compared when other derivatization reagents are used for the simultaneous determination of these compounds[32,33,35]. The proposed method by Bauza et al. [33]using FMOC as derivatization reagent needs 6 min for reac-tion development, while Krause et al.[32]used a dabsyl method and the derivatization time was 20 min. Lately, Lozanov et al. [35]proposed the use of FMOC-OSu reacting during 20 min. OPA derivatization does not show the presence of excess reagent, interfering with the analytes resolution, as detected when using FMOC derivatization methods[35]. Furthermore, the derivati-zation reaction is automatic, occurs in the injection loop and shows sensitive and consistent results.
3.2. Method validation
The sample analytes were identified by comparison with the retention times of amino acid standard solutions. For the determination of retention times, the reference standards were injected both individually and as a mixture. Quantification was
performed by the external standard method based on peak areas of the eluted amino acid and biogenic amines derivatives.
The linearity was evaluated by the construction of cali-bration curves, using the chromatographic peaks areas of the fluorescence response from triplicate injections of standards, at six increasing concentrations in the 0.5–60.0 mg/l range for all amino acids and biogenic amines. The linear relationship between concentrations and peak area is given by a, b and r2—seeTable 3, whereaandbare the coefficients of the regres-sion equationy=ax+b,xbeing the concentration of the analyte, ythe peak area andr2the coefficient of determination. For this calculation, all obtained values were used instead the average of the three injections. In all cases, the relationship between con-centrations and peak areas were linear over the tested range, with coefficients of determination greater than 0.990. The repeatabil-ity of the method was evaluated by nine consecutive injections of the same sample during a working day. Detection limits (defined as three times the signal-to-noise ratio) ranged from 0.71 mg/l (Asp) to 8.26 mg/l (Lys)—Table 3.
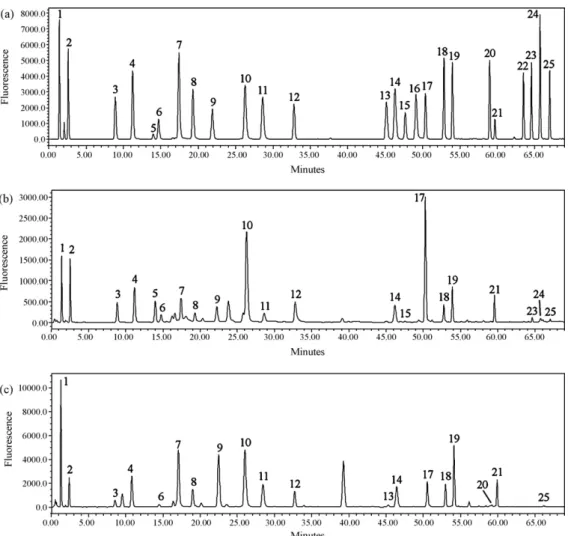
Fig. 1. Typical chromatogram profile of amino acids and biogenic amines in: (a) 20 mg/l standard mixture, (b) H5 honey and (c) W4 wine. Peak identification: (1) aspartic acid, (2) glutamic acid, (3) asparagine, (4) serine, (5) glutamine, (6) histidine, (7) glycine, (8) threonine, (9) arginine, (10) alanine, (11) GABA, (12) tyrosine, (13) methionine, (14) tryptophan, (15) valine, (16) histamine, (17) phenylalanine, (18) isoleucine, (19) leucine, (20) tyramine, (21) lysine, (22) tryptamine, (23) phenylethylamine, (24) isopenthylamine and (25) cadaverine.
deviations (RSD) of about 2% in the analyses of wine and honey samples.
The accuracy was estimated by means of the recovery tests. For the evaluation of the recovery rate, H3 honey and W7 wine (n= 5) were spiked with 10 mg/l standard solution, derivati-zated and quantified. The recovery rate averages obtained were acceptable, with values ranging from 82% (Lys) to 98% (Asp) for amino acids, and 63% (Cad) to 91% (Ism) for biogenic amines—Table 3.
3.3. Chromatographic analysis
The proposed HPLC method allows the simultaneous deter-mination of 19 amino acids and 6 biogenic amines in 83 min, including the column regeneration (9 min) and derivatization time (3 min), slightly higher than the methodology suggested by Alberto et al.[34], 63 min, but ensuring better separation. The applied methodology allows the total separation of all amino acids and biogenic amines in the standards solutions and analysed matrices, overcoming some peak overlay obtained by several authors [8,50–52]namely Asn + Ser [50,8], Gln + Thr [50], Asp + Asn[51], Glu + Gln[51]and Thr + Ala[52].Fig. 1
shows the separation obtained for the amino acids and bio-genic amines present in a 20 mg/l standard solution, together with typical chromatograms obtained for honey (H5) and wine (W4).
More than the determination of amino acid composition, this methodology is a useful tool for the control of biogenic amines with known toxic activity, like phenylethylamine, his-tamine (maximum recommended levels of 5–6 mg/l in Belgium
V
.
P
er
eir
a
et
al.
/
J.
Chr
omato
gr
.
A
1189 (2008) 435–443
Table 4
Levels (mg/l) of free amino acids in studied honey and wine samples with the respective standard deviation of the mean value (n= 3 for each data point)
Asp Glu Asn Ser Gln His Gly Thr Arg Ala GABA Tyr Met Trp Val Phe Ile Leu Lys
Honeys Madeira island
H1 3.73±0.080 4.65±0.11 2.83±0.01 <LOD 39.99±0.30 3.20±0.20 <LOD <LOD 3.36±0.03 3.69±0.04 <LOD 4.77±0.35 n.d. 3.31±0.00 <LOD 76.38±0.72 2.24±0.02 10.74±0.12 12.58±0.83 H2 3.89±0.01 5.64±0.01 2.85±0.03 2.67±0.00 55.19±0.48 4.71±0.00 <LOD <LOD 2.99±0.00 7.77±0.01 <LOD 8.44±0.02 n.d. 5.56±0.00 <LOD 146.65±1.65 4.07±0.01 23.09±0.02 12.48±0.12 H3 3.33±0.04 4.94±0.04 3.01±0.00 3.44±0.03 32.71±0.37 2.73±0.18 <LOD <LOD 3.61±0.03 12.41±0.05 <LOD 5.47±0.01 n d. 2.03±0.01 n.d. 19.99±0.02 <LOD 3.24±0.00 9.75±0.08 H4 6.26±0.27 11.77±0.27 3.29±0.00 4.77±0.11 34.06±0.86 6.73±0.21 <LOD 3.21±0.04 <LOD 6.41±0.05 <LOD 20.65±0.28 n.d 3.37±0.00 6.45±0.00 97.76±0.08 2.36±0.01 1.79±0.01 9.43±0.06 H5 3.54±0.04 6.36±0.01 5.51±0.05 2.73±0.00 32.56±0.22 5.07±0.00 <LOD <LOD 3.67±0.00 4.45±0.09 <LOD 6.49±0.02 n.d. 2.45±0.01 <LOD 20.37±0.06 <LOD <LOD 12.63±0.16
Portugaal mainland
H6 3.82±0.04 2.84±0.06 4.95±0.05 3.56±0.01 20.08±0.11 4.77±0.05 <LOD <LOD 4.27±0.15 3.72±0.08 <LOD 33.84±0.35 n.d. 1.65±0.05 <LOD 109.61±0.29 1.62±0.02 11.11±0.12 8.71±0.12 H7 5.49±0.13 6.58±0.14 3.81±0.10 3.33±0.09 26.93±1.19 4.92±0.03 <LOD <LOD 4.00±0.03 8.02±0.01 <LOD 8.91±0.14 n.d 2.37±0.00 <LOD 47.69±0.39 <LOD 2.32±0.02 9.49±0.03 H8 23.65±0.28 39.23±0.45 15.17±0.89 7.76±0.53 154.42±0.91 4.07±1.36 4.15±0.18 3.26±0.16 9.98±0.26 11.36±0.29 8.70±0.17 9.07±0.06 n.d 6.79±0.07 <LOD 145.28±1.53 3.70±0.02 3.02±0.00 8.42±0.09
Canary island
H9 2.29±0.10 4.74±0.04 2.66±0.04 3.19±0.03 31.34±0.06 6.21±0.07 <LOD <LOD 3.43±0.05 3.58±0.00 <LOD 40.67±0.01 n.d. 2.06±0.02 <LOD 159.68±0.17 <LOD 3.85±0.01 15.62±0.00 H10 17.04±0.39 9.28±0.27 17.93±0.36 3.85±0.03 57.08±1.26 5.77±0.05 <LOD <LOD 4.58±0.03 5.24±0.02 <LOD 6.10±0.05 n.d. 3.44±0.04 n.d. 10.44±0.05 1.85±0.02 <LOD 8.85±0.12 H11 43.85±0.91 45.58±0.47 4.42±0.26 7.36±0.82 91.68±2.74 3.05±0.20 8.42±0.03 <LOD <LOD 19.99±0.06 <LOD 2.64±0.18 n.d. 5.21±0.09 n.d. 15.74±0.36 <LOD 3.89±0.00 <LOD H12 6.84±0.06 7.48±0.06 7.63±0.54 3.83±0.09 61.35±1.41 9.64±0.38 <LOD 2.62±0.07 <LOD 5.29±0.15 <LOD 19.66±0.13 n.d. 3.58±0.04 <LOD 74.62±1.84 2.09±0.08 <LOD 21.11±0.24
Wines Madeira fortified
W1 14.62±0.08 12.16±0.10 2.32±0.04 21.23±0.09 <LOD 4.38±0.09 14.03±0.10 19.39±0.60 313.46±1.62 85.74±0.22 95.60±1.16 5.69±0.04 <LOD 10.61±0.00 n.d. 8.51±0.02 3.49±0.12 8.33±0.02 <LOD W2 20.90±0.01 6.46±0.00 3.03±0.02 6.98±0.02 1.17±0.05 3.49±0.13 10.54±0.02 6.88±0.10 15.46±0.05 16.51±0.20 9.41±0.07 6.37±0.05 1.39±0.00 6.52±0.09 n.d. 9.83±0.19 4.81±0.09 13.56±0.32 15.43±0.45 W3 30.44±0.41 11.47±0.15 4.89±0.04 16.77±0.04 <LOD 4.73±0.09 11.85±0.07 21.96±0.40 459.56±6.29 87.23±0.56 33.57±0.21 18.17±0.09 n.d. 11.40±0.07 n.d. 11.33±0.07 6.72±0.02 12.01±0.03 14.96±0.15 W4 29.52±0.19 8.45±0.08 3.88±0.12 12.20±0.01 <LOD 3.69±0.10 18.84±0.52 9.10±0.08 47.42±0.32 28.67±0.15 13.91±0.34 11.78±0.07 <LOD 10.58±0.07 n.d. 15.40±0.03 6.72±0.05 20.61±0.05 33.40±1.49
Madeira table
W5 10.67±0.06 26.48±0.11 11.03±0.29 4.86±0.01 <LOD 5.29±0.21 5.61±0.12 3.47±0.00 19.43±0.50 17.58±0.03 5.18±0.01 4.70±0.03 <LOD 4.16±0.01 n.d. 6.64±0.03 3.17±0.01 11.00±0.02 19.86±0.09 W6 10.35±0.02 29.64±0.01 5.39±0.36 4.35±0.02 28.37±0.05 6.78±0.28 8.41±0.21 2.47±0.18 24.73±0.15 14.90±0.02 31.27±0.11 8.61±0.02 <LOD 3.74±0.15 n.d. 7.13±0.05 2.35±0.03 9.13±0.01 20.11±0.14 W7 1.55±0.01 9.49±0.04 1.39±0.01 3.60±0.06 21.36±0.17 2.03±0.07 5.43±0.05 0.85±0.02 5.58±0.08 8.31±0.09 6.27±0.11 2.05±0.04 0.15±0.01 1.50±0.11 n.d. 1.93±0.06 0.64±0.06 2.01±0.04 2.75±0.05
Canarian table
and 10 mg/l in Switzerland[53]) and tyramine, considered toxic to human health (25–40 mg/l)[54].
The results obtained for the honey and wine samples are sum-marized inTable 4, where only amino acid concentrations are shown as biogenic amines were found only in vestigial quan-tities, usually below the LOD. The main amino acids found in honey samples were phenylalanine, glutamine and lysine and in wines were arginine, alanine and GABA. Methionine showed very low level in wines and was not detected in honeys.
The total amount of the primary amino acids found is described inFig. 2. The values range from 76.89 mg/l (W7) to
802.40 mg/l (W8). From the analyzed honeys, Madeira multiflo-ral honey (H2) presents the highest amount of amino acid found, 286.00 mg/l. Analysing Madeira wines from similar grape vari-eties, it was observed that fermented ones show lower values (about 172.94 mg/l) than the wines submitted to partial fermen-tation, like sweet wines (684.73 mg/l in average for W1 and W3), as expected since amino acids are catabolised in several reac-tions during this step. Comparing the results obtained for the same variety submitted to a different fermentation process (W3 and W4), the content of the following acids decrease at least 50% during fermentation: arginine, alanine,␥-aminobutyric acid and
Table 5
Relative abundance (%) of each amino acid in honeys and wines under study
Amino acids (%) Madeira island honeys Portugal mainland honeys Canary island honeys
H1 H2 H3 H4 H5 H6 H7 H8 H9 H10 H11 H12
Asp 9 9 8 14 8 9 13 54 22 39 100 16
Glu 10 12 11 26 14 6 14 86 10 20 100 16
Asn 16 16 17 18 31 28 21 85 15 100 25 43
Ser – 34 44 61 35 46 43 100 41 50 95 49
Gln 26 36 21 22 21 13 17 100 20 37 59 40
His 33 49 28 70 53 49 51 42 64 60 32 100
Gly – – – – – – – 49 – – 100 –
Thr – – – 98 – – – 100 – – – 80
Arg 34 30 36 37 43 40 100 34 46 – –
Ala 18 39 62 32 22 19 40 57 18 26 100 26
GABA – – – – – – 100 – – – –
Tyr 12 21 13 51 16 83 22 22 100 15 6 48
Met – – – – – – – – – – – –
Trp 49 82 30 50 36 24 35 100 30 51 77 53
Val – – – 100 – – – – – – – –
Phe 48 92 13 61 13 69 30 91 100 7 10 47
Ile 55 100 – 58 – 40 – 91 – 45 – 51
Leu 47 100 14 8 – 48 10 13 17 – 17 –
Lys 60 59 46 45 60 41 45 40 74 42 – 100
Total compounds 13 14 13 16 12 14 13 17 13 13 12 13
Amino Acids (%) Madeira island wines Canary island wines
Fortified Table Table
W1 W2 W3 W4 W5 W6 W7 W8 W9
Asp 39 56 81 79 28 28 4 80 100
Glu 23 12 21 16 49 55 18 86 100
Asn 21 27 44 35 100 49 13 29 42
Ser 100 33 79 57 23 20 17 57 60
Glu 2 4 8 1 7 100 75 5 20
His 5 4 6 4 6 8 2 100 85
Gly 56 42 47 75 22 33 22 100 97
Thr 88 31 100 41 16 11 4 53 45
Arg 68 3 100 10 4 5 1 61 39
Ala 98 19 100 33 20 17 10 76 54
GABA 94 9 33 14 5 31 6 100 96
Tyr 19 21 61 39 16 29 7 100 88
Met 9 20 – 22 29 22 2 93 100
Trp 45 28 49 45 18 16 6 100 58
Val – – – – – 100
Phe 48 55 63 86 37 40 11 100 96
Ile 44 61 85 85 40 30 8 100 81
Leu 38 61 54 93 50 41 9 100 97
Lys 10 42 40 90 54 54 7 93 100
threonine, showing the importance of these amino acids in the formation of typical aromas present in Madeira wines (together with cisteine, not determined with this method, due to low sen-sitivity). The total amino acid content in Madeira fortified dry wines is similar to Madeira table wines, since the fermentation is almost complete. Canarian table wines present high levels of these compounds (741.64 mg/l in average) close to Madeira sub-mitted to partial fermentation, explained by the fact that those wines were produced from over-maturated Malvasia grapes.
The percentage of the amino acid relative abundance is exposed inTable 5. The samples with the highest relative abun-dance of amino acids were H8 (honey) due to serine, glutamine, threonine, arginine, GABA and tryptophan and W8 (wine) due to histidine, glycine, GABA, tyrosine, tryptophan, phenylalanine, isoleucine and leucine. Wines besides having higher amounts of amino acids also possess the richest amino acids profile.
The applicability of the reported procedure for simultane-ously analysis of amino acids and biogenic amines has been demonstrated for the analysis of honey and wine samples. The reported method is routinely used in our laboratory.
4. Conclusions
A simple RP-HPLC analytical method for the simultane-ous analysis of amino acids and biogenic amines in liquid food matrices is proposed based on a pre-column derivatiza-tion with OPA, performed in the sample injecderivatiza-tion loop, and fluorescence detection. The separation and quantification of 19 amino acids and nine amines was carried out in a single run as their OPA/MCE derivatives elute within 80 min, ensuring a reproducible quantification. The practical utility of the pro-posed chromatographic procedure was shown by the analysis of the amino acid and biogenic amine content in honey and wine samples without any preliminary separation or clean-up steps. The method showed high sensitivity and response to minor compounds with the exception to proline, cysteine and hydrox-yproline. Future trends pass through the use of shorter columns, to reduce analysis and the application of this procedure to others food matrices.
Relatively to the analysed samples, the amino acid present at the highest concentration in honeys was phenylalanine and in wines was arginine. The biogenic amines suspected to cause tox-icological effects (histamine, tyramine and phenylethylamine) were no cause for concern in the analysed honey and wine samples since they are present in vestigial quantities.
Acknowledgments
Vanda Pereira thanks to Fundac¸˜ao para a Ciˆencia e Tecnologia for the PhD grant SFRH/BD/24177/2005.
This work was financed under project ANTIVINMAC (05/MAC/2.3/M28) from the program INTERREG-IIIB/ FEDER.
References
[1] D. Kutl´an, I. Moln´ar-Perl, J. Chromatogr. A 987 (2003) 311.
[2] S. ¨Ozcan, H. Senyuva, J. Chromatogr. A 1135 (2006) 179.
[3] M.C. Vidal-Carou, R. Codony-Salcedo, A. Marin´e-Font, Am. J. Enol. Vitic-ult. 42 (1991) 145.
[4] I. Mafra, P. Herbert, L. Santos, P. Barros, A. Alves, Am. J. Enol. Viticult. 50 (1999) 128.
[5] M.H. Silla-Santos, Int. J. Food Microbiol. 29 (1996) 213.
[6] M.T. Iglesias, C. Lorenzo, M.C. Polo, P.J. Mart´ın- ´Alvarez, E. Pueyo, J. Agric. Food Chem. 52 (2004) 84.
[7] F. Bianchi, M. Careri, M. Musci, Food Chem. 89 (2005) 527.
[8] I. Hermos´ın, R.M. Chic´on, M.D. Cabezudo, Food Chem. 83 (2003) 263.
[9] A.M.P. Vasconcelos, H.J. Chaves das Neves, J. Agric. Food Chem. 37 (1989) 931.
[10] G. Noudaje, N. Sim´eon, F. Dedieu, M. Nertz, F. Ph Puig, Couderc, J. Chromatogr. A 765 (1997) 337.
[11] E.H. Soufleros, M.L. Barrios, A. Bertrand, Am. J. Enol. Viticult. 49 (1998) 266.
[12] E.H. Soufleros, E. Bouloumpasi, C. Tsarchopoulos, C.G. Biliaderis, Food Chem. 80 (2003) 261.
[13] T. Bauza, A. Blaise, J.P. Mestres, P.L. Teissedre, F. Daumas, J.C. Cabanis, Sci. Aliment. 15 (1995) 367.
[14] M.C. Vidal-Carou, A. Ambatlle-Espunyes, M.C. Ulla-Ulla, A. Marin´e-Font, Am. J. Enol. Viticult. 41 (1990) 160.
[15] M.B. Vazquez-Lasa, M. Iniguez-Crespo, M. Gonzalez-Larraina, A. Gonzalez-Guerrero, Am. J. Enol. Viticult. 49 (1998) 229.
[16] M. Gloria, B. Watson, L. Simon-Sarkadi, M. Daeschel, Am. J. Enol. Vitic-ult. 49 (1998) 279.
[17] P. Herbert, L. Santos, A. Alves, J. Food Sci. 66 (2001) 1319.
[18] E. Coton, S. Torlois, A. Bertrand, A. Lonvaud-Funel, Bull. L’OIV 72 (1999) 22;
J.M. Alcaide-Hidalgoa, M.V. Moreno-Arribasa, P.J. Mart´ın- ´Alvareza, M.C. Polo, Food Chem. 103 (2007) 572.
[19] S. Yamamoto, H. Itano, H. Kataoka, M. Makita, J. Agric. Food Chem. 30 (1982) 435.
[20] A. Bandichau, D. Bruyer, R. Ontiveros, W. Shermer, J. Sci. Food Agric. 38 (1987) 1.
[21] M.J. Nozal, J.L. Bernal, M.L. Toribio, J.C. Diego, A. Ruiz, J. Chromatogr. A 1047 (2004) 137.
[22] J. L´opez-Cervantes, D.I. S´anchez-Machado, J.A. Rosas-Rodr´ıgues, J. Chromatogr. A 1105 (2006) 106.
[23] L. Pripris-Nicolau, G. Revel, S. Marchand, A.A. Beloqui, A. Bertrand, J. Sci. Food Agric. 81 (2001) 731.
[24] C. Bjergegaard, L.P. Hansen, P. Møller, H. Sørensen, S. Sørensen, J. Chro-matogr. A 836 (1999) 137.
[25] ´A. Kov´acs, L. Simon-Sarkadi, K. Ganzler, J. Chromatogr. A 836 (1999) 305.
[26] P. Chaimbault, K. Petritis, C. Elfakir, M. Dreux, J. Chromatogr. A 855 (1999) 191.
[27] K. Petritis, P. Chaimbault, C. Elfakir, M. Dreux, J. Chromatogr. A 896 (2000) 253.
[28] J. Qu, Y. Wang, G. Luo, Z. Wu, Yang.F C., Anal. Chem. 74 (2002) 2034.
[29] K. Petritis, C. Elfakir, M. Dreux, J. Chromatogr. A 961 (2002) 9. [30] J.J. Dalluge, S. Smith, F. Sanchez-Riera, C. McGuire, R. Hobson, J.
Chro-matog. A 1043 (2004) 3.
[31] A.N. Fonteh, R.J. Harrington, M.G. Harrington, Amino Acids 32 (2007) 203.
[32] I. Krause, A. Bockhardt, H. Neckermann, T. Henle, H. Klostermeyer, J. Chromatogr. A 715 (1995) 67.
[33] T. Bauza, A. Blake, F. Daumasb, J.C. Cabanis, J. Chromatogr. A 707 (1995) 373.
[34] M.R. Alberto, M.E. Arena, M.C.M. Nadra, Food Control 13 (2002) 125.
[35] V. Lozanov, S. Petrov, V. Mitev, J. Chromatogr. A 1025 (2004) 201. [36] Q. Wanga, H. Yua, H. Lib, F. Dinga, P. Hea, Y. Fanga, Food Chem. 83
(2003) 311.
[38] E.M. Sanders, C.S. Ough, Am. J. Enol. Viticult. 36 (1985) 43. [39] S. Einarsson, J. Chromatogr. 348 (1985) 213.
[40] J. You, H. Sunb, W. Lao, Q. Ou, Anal. Chim. Acta 382 (1999) 51. [41] B.H. Klein, J.W. Dudenhausen, J. Liq. Chromatogr. 18 (1995) 4007. [42] P. Lehtonen, Am. J. Enol. Viticult. 47 (1996) 127.
[43] B.A. Bidlingmeyer, S.A. Cohen, T.L. Tarvin, J. Chromatogr. 336 (1984) 93.
[44] J. Gonz´alez-Castro, J. L´opez-Hern´andez, J. Simal-Lozano, Oru˜na-Concha, J. Chromatogr. Sci. 35 (1997) 181.
[45] P. F¨urst, L. Pollack, T.A. Graser, H. Godel, P. Stehle, J. Chromatogr. 449 (1990) 557.
[46] P. Martin, P.A. Su´arez, C. Polo, M.D. Cabezudo, M.V. Dabrio, Anal. Bro-matol. 32 (1980) 289.
[47] R. Hanczk´o, I. Moln´ar-Perl, Chromatographia 57 (2003) S103.
[48] A.M.G. Param´as, J.A.G. B´arez, C.C. Marcos, R.J. Garc´ıa-Vilanova, J.S. S´anchez, Food Chem. 95 (2006) 148.
[49] O. Busto, J. Guasch, F. Borrull, J. Chromatogr. A 718 (1995) 309. [50] A.M.C. Davies, R.G. Harris, J. Apicult. Res. 21 (1982) 168.
[51] L.S. Conte, M. Miorini, A. Giomo, G. Bertacco, R. Zironi, J. Agric. Food Chem. 46 (1998) 1844.
[52] P.M. Cometto, P.F. Faye, R.P. Naranjo, M.A. Rubio, M.A.J. Aldao, J. Agric. Food Chem. 51 (2003) 5079.
[53] P. Lehtonen, M. Saarinen, M. Vesanto, M.L. Riekkola, Z. Lebensm. Unters. Forsch. 194 (1992) 434.