ISSN 1517-7076 artigo e11804, 2017
Autor Responsável: Shayenne Diniz da Nobrega Data de envio: 22/07/2016 Data de aceite: 11/01/2017
10.1590/S1517-707620170001.0136
Optimization of spin-coated electrodes
for electrolyte-supported solid
oxide fuel cells
Shayenne Diniz da Nobrega 1, Natalia Kondo Monteiro 1, Francisco Tabuti 1, Daniel Zanetti de Florio 2, Fabio Coral Fonseca 1
1 Instituto de Pesquisas Energéticas e Nucleares, IPEN-CNEN/SP, 05508-000, São Paulo, SP, Brazil e-mail: [email protected]; [email protected]; [email protected]; [email protected]
2
Universidade Federal do ABC, 09090-400, Santo André, SP, Brazil e-mail: [email protected]
ABSTRACT
Electrodes for electrolyte-supported solid oxide fuel cells (SOFC’s) were fabricated by spin coating. Stronti-um-doped lanthanum manganite (LSM) cathode and nickel yttria-stabilized zirconia cermet anodes were syn-thesized and processed for enhanced deposition conditions. The influence of electrode microstructural pa-rameters was investigated by a systematic experimental procedure aiming at optimized electrochemical per-formance of single cells. Polarization curves showed a strong dependence on both electrode thickness and sintering temperature. By a systematic control of such parameters, the performance of single cells was signif-icantly enhanced due to decreasing of polarization resistance from β6 Ω cm² to 0.6 Ω cm² at 800°C. The re-sults showed that spin-coated electrodes can be optimized for fast and cost effective fabrication of SOFCs. Keywords: solid oxide fuel cell; spin-coating; optimization; performance.
1. INTRODUCTION
Solid oxide fuel cells (SOFCs) are envisioned as a promising technology for electric power generation with low environmental impact and high efficiency [1]. Such electrochemical energy converters are the only solid-state fuel cells, allowing different designs and a broad range of applications. Moreover, the high operation temperatures ensure high efficiencies and the possibility of internal processing of different fuels [2-5].
A standard SOFC consists basically of two porous electrodes, typically yttria-stabilized zirconia (YSZ) - Ni cermet anode and strontium-doped lanthanum manganite (LSM) cathode, separated by a dense YSZ electrolyte [1,6]. Such a ceramic fuel cell requires controlled and cost effective processing techniques for fabrication. Several techniques have been reported for SOFC electrode and electrolyte depositions and, essentially, they can be divided in two main categories: wet chemistry and physical processes [7,8]. The later ones have great reproducibility, but the high costs can be an issue. Wet chemistry techniques are preferred for industrial production, but require a detailed control to ensure reproducibility [7,8].
Amongst wet chemistry deposition techniques, possibly, the most developed ones are screen printing and wet spray [7-9]. However, spin coating has gained attention as a method to produce thin layers for SOFCs, which can be used for layer depositions for both electrolyte- and anode-supported cells [10-19]. Such technique is based on the deposition by rotation in which a suspension is spread across the surface of a sub-strate by a centrifugal acceleration. It is a widely used technique in the electronic industry, in microlithogra-phy for the manufacture of integrated circuits and for fabrication of antireflective coatings in solar cells [10
-19]. Spin coating has been successfully developed to fabricate both porous electrode layers and dense electro-lyte films for anode supported SOFCs, evidencing the suitability of such deposition technique [10-19].
NOBREGA, S.D.; MONTEIRO, N.K.;TABUTI, F.; FLORIO, D.Z.; FONSECA, F.C. revista Matéria, v.22, n.1, 2017.
2. MATERIALS AND METHODS
The La0.65Sr0.30MnO3 (LSM) cathode was synthesized by the polymeric precursor technique [20]. Starting materials were La(NO3)2.6(H2O) (Aldrich, 99,99%), Sr(NO3)3.4(H2O) (Aldrich, 99%), Mn(CH3CO3)2.4(H2O) (Aldrich, 99%). Citric acid (Fluka, 99.5%) was added to an aqueous solution of the metallic salts under con-stant mixing and heated at ~70°C. Ethylene glycol (Aldrich, 99.8%) was added and the resulting solution was kept under constant mixing and heating (70°C) until a viscous resin was obtained. The polymeric precursor was heat treated at 300°C and calcined at 800°C to obtain single phase LSM. The calcining time at 800°C was varied between 1 h and 3 h. Composite LSM-YSZ (50-50 wt.%) for the cathode functional layer (FL) was prepared by mixing YSZ (Tosoh, Japan) and LSM powders. The powders were suspended in ethanol and ball milled for 16 h with zirconia ball (TZ-3Y, Tosoh, 8 mm diameter). After milling, ethanol was evaporated under mixing at 100°C.
The NiO-YSZ composite powders were prepared by a liquid mixture method [21]. Such a method consists in the evaporation of a dispersion of YSZ in nickel acetate (Aldrich, 99%) solution in ethanol under mixing and heating at 70°C, followed by calcining at 450°C for 5 h. NiO-YSZ composites were prepared in two different proportions aiming at final Ni-YSZ anode compositions 40-60 vol.%, for the functional layer (FL), and 60-40 vol.%, for the current-collector layer (CL). For both the cathode and the anode FL powders, the effect of particle size distribution was investigated after a ball milling step for 16 h using YSZ grinding media.
Crystalline phases were investigated by X-ray diffraction (XRD, Rigaku Miniflex), in the 20° - 80° 2θ range, with step size 0.05° and 2 s counting time/step, using Cu Kα radiation. Particle size distributions were determined by laser scattering.
Electrolyte-supported single solid oxide fuel cells were fabricated for testing different electrodes. Firstly, yttria-stabilized zirconia (8 mol%, YSZ - Tosoh) substrates were prepared by uniaxial pressing (1 ton cm-2), pre-sintering at 1500 °C, diamond wheel grinding, and sintering at 1600ºC for 1 h in air. Final dimen-sions of YSZ supports are ~20 mm diameter and ~500 µm thickness. Anodic and cathodic layers were depos-ited by spin-coating. The suspensions for spin coating, with 30% solids loading, were prepared by dissolving ethyl cellulose in Terpineol (Aldrich) under constant mixing and heating at 80°C. After cooling to room tem-perature, the ceramic powder (LSM, LSM-YSZ, or NiO-YSZ) was added to the solution and mixed for 15 h in a ball mill with zirconia balls grinding media. Suspensions for spin coating were developed aiming at sim-ple preparation and fast deposition with a minimum spin coating steps to achieve the desired layer thickness (t). The YSZ substrate is fixed to the spin coater (Laurel, model WS-400-6NPP-LITE) by vacuum. The ce-ramic suspension was deposited onto the substrate, and rotated at 6000 rpm for 10 s. For typical electrode thickness two spin coating steps were performed. After coating, the deposited layer is dried in a hot plate at 80°C for 5 min. The active area of the single cells is 0.78 cm² (1 cm diameter).
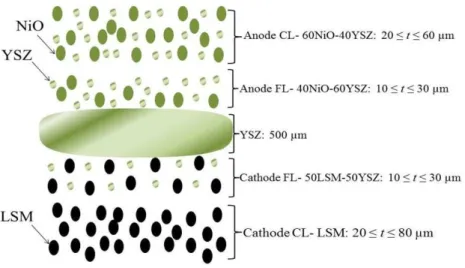
The fabricated single cells have both the anode and the cathode comprised of two layers: the function-al layer (FL), which is the interfacifunction-al layer deposited on the electrolyte, and the current-collector layer (CL), deposited over the FL. Cathode and anode FL were LSM-YSZ (50-50 wt.%) and YSZ-NiO (60-40 vol.%) composites, respectively. The CL for the cathode and anode was LSM and the YSZ-NiO (40-60 vol.%), re-spectively. Fig. 1 shows the scheme of the electrolyte supported single cells. Layer thickness of both FL and CL were controlled by the suspension mass deposited and the number of deposition steps on the spin coater. Each layer typically requires 2 to 3 spin coating steps to attain desired thickness. Hereafter, the thickness of the electrode layers refer to the nominal values, unless otherwise indicated in the text. The thickness of elec-trode layers and sintering temperatures were varied in order to optimize the performance of single cells. Typ-ically, FL (anode and cathode) were varied between t = 10-30 m and the CL (anode and cathode) between t = 20-80 m. Sintering temperatures were in the 1100-1200°C and 1300-1400°C temperature ranges, for cathode and anode, respectively. Such values are within the typical temperature range used for sintering SOFCs electrodes aiming at reduced costs and optimized microstructures [1].
The microstructural characterization of the samples was performed by scanning electron microscopy (SEM, Jeol JSM-6010LA) of the cross section of fractured surfaces sputtered with Pt.
The performance of single cells was evaluated by measuring the polarization curves (I-V) and imped-ance spectroscopy (IS) in the temperature range of 600-800°C. The electrical contact was a Pt mesh attached to both the anode and cathode with Pt paste cured at 800°C for 1 h. Samples were sealed on one side of an
cath-ode and ancath-ode side. Single cells were tested with H2 (3 vol.% H2O) and synthetic air, both with flow rates of 50 mL min-1 set by mass flow controllers. A multichannel digital multimeter (Keithley 2000) monitors both the emf of a type K thermocouple placed close to the cathode and the ambient temperature of an electronic sensor. The main fuel cell parameters are controlled, stored, and monitored on a LabView based software, by connecting both the mass flow controllers and the multimeter to a microcomputer via GPIB (National In-struments) interface. The I-V and IS data were measured using a Zahner IM-6 electrochemical station. I-V curves were collected with a 10 mV min-1 rate, from the open circuit voltage (OCV ~1.1 V) to 0.2 V. IS data were measured at OCV with 100 mV ac amplitude, in the 0.1 Hz to 1 MHz interval. All samples were meas-ured in duplicates, and in some cases a third sample was fabricated and measmeas-ured to confirm results.
Figure 1: Schematics of the layers of the single SOFC (not in scale): anode (CL=current collector and FL=functional
layer), electrolyte support, and cathode (CL and FL). Thickness (t) of each layer is indicated.
3. RESULTS AND DISCUSSION
3.1 Characterization of starting materials
NOBREGA, S.D.; MONTEIRO, N.K.;TABUTI, F.; FLORIO, D.Z.; FONSECA, F.C. revista Matéria, v.22, n.1, 2017.
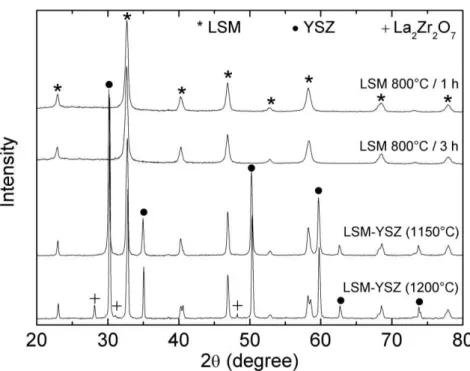
Figure 2: X-rays diffraction patterns of LSM calcined at 800°C for 1 h and 3 h.
The XRD patterns of LSM-YSZ composite powders heat treated at 1150°C and 1200°C were ana-lyzed (Fig. 2). The composite samples heated at 1150°C showed diffraction peaks of both LSM and YSZ phases. However, XRD results of the LSM-YSZ sample heated at 1200°C shows peaks corresponding to sec-ondary phases. The formation of resistive phases such as lanthanum zirconate (La2Zr2O7), or strontium zir-conate (SrZrO3), is well-known to occur at temperatures higher than ~1150°C [22-24].
The XRD patterns of NiO-YSZ (40-60 and 60-40 vol.%) composites are shown in Fig. 3. Only peaks corresponding to the cubic structures of YSZ and NiO were observed. The XRD patterns were indexed based on the JCPDS cards 7-1049 (NiO) and 30-1468 (YSZ).
Figure 3: X-rays diffraction patterns of NiO-YSZ anode precursors after calcining at 450°C. Symbols * and ● mark the
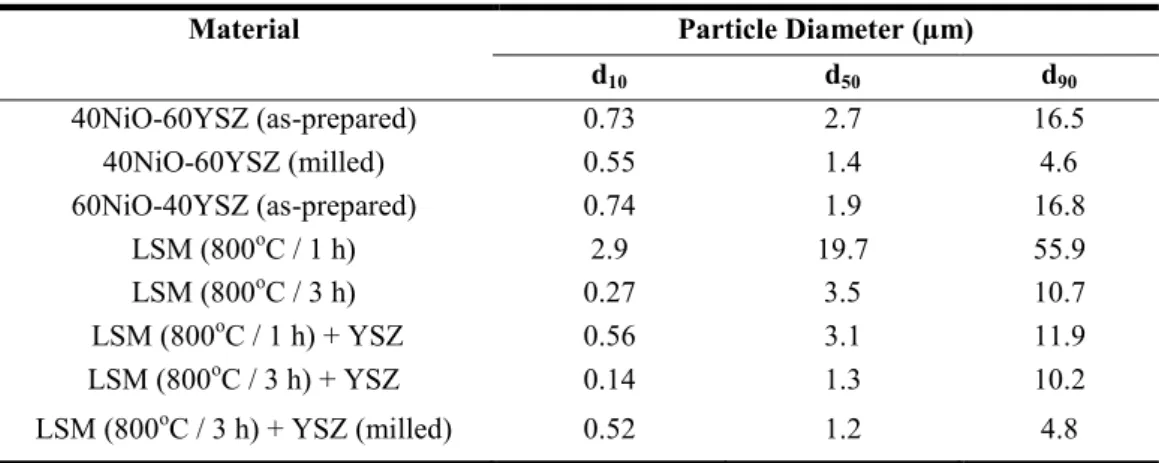
The produced powders were processed for the preparation of ceramic suspensions for electrode depo-sitions by spin coating. An important parameter was the particle (or agglomerate) size distribution, which was controlled by a ball milling step. Table 1 lists the main parameters of the particle size distributions ex-tracted from the light scattering experiments.
Table 1: Characteristic diameters determined from particle/agglomerate size distribution analysis.
Material Particle Diameter (µm)
d10 d50 d90
40NiO-60YSZ (as-prepared) 0.73 2.7 16.5
40NiO-60YSZ (milled) 0.55 1.4 4.6
60NiO-40YSZ (as-prepared) 0.74 1.9 16.8
LSM (800oC / 1 h) 2.9 19.7 55.9
LSM (800oC / 3 h) 0.27 3.5 10.7
LSM (800oC / 1 h) + YSZ 0.56 3.1 11.9
LSM (800oC / 3 h) + YSZ 0.14 1.3 10.2
LSM (800oC / 3 h) + YSZ (milled) 0.52 1.2 4.8
The characteristic diameters of both FL and CL anode layers were equivalent, irrespectively of the relative phase composition. The ball milling step for the anode FL precursor powder resulted in a considera-ble reduction of the mean particle size d50 from 2.7 to 1.4 m. Moreover, milling resulted in a significant narrowing of the particle size distribution, as inferred from d90/d10 ratio decrease from 22 to 8. Particle distri-bution analysis of cathode powders revealed an unexpected dependence on the calcining time. The LSM powder calcined at 800°C for 1 h exhibited a d50 ~19 m, while powder calcined for 3 h displayed signifi-cantly decreased mean particle size (d50 ~3.5 m). Crystallite diameter estimated by using the Scherrer equa-tion and XRD data showed weak dependence on the calcining time, increasing from 16 nm to 18 nm with increasing time from 1 h to 3 h, respectively. Such behavior was further investigated by thermogravimetric (TG) analysis (not shown), which evidenced that powder calcined at 800°C for 1 h exhibited a ~3.5% mass loss up to 800°C. Thus, calcining time of 1 hour was insufficient to remove the organic residues from synthe-sis. Therefore, particle size measurements for such material include both the organic residue and the inorgan-ic phase. Calcining powder for 3 hours resulted in pure LSM and partinorgan-icle size measurements reflect the aver-age particle of the cathode precursor powder. Milling the cathode FL powder significantly narrowed the par-ticle size distribution by decreasing d90 from ~10 to 5m.
3.2 Fuel cell optimization
NOBREGA, S.D.; MONTEIRO, N.K.;TABUTI, F.; FLORIO, D.Z.; FONSECA, F.C. revista Matéria, v.22, n.1, 2017.
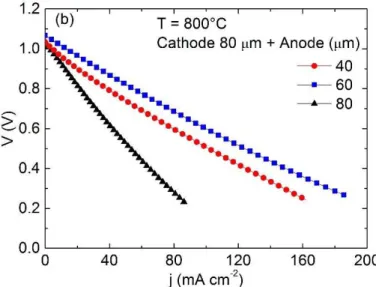
Figure 4: Polarization curves at 800°C of single cell with fixed FL thickness (20μm) and different CL layers for the (a)
cathode and (b) anode. The indicated thickness corresponds to the total electrode thickness: FL (20μm) + CL.
The experimental data shown in Fig. 4 indicated that by fixing the anode thickness at 60 (FL = 20 µm, CL = 40 µm) and increasing the thickness of the cathode CL from 40 μm to 80 μm increased the fuel cell performance, reaching a maximum current density of ~100 mA cm-2 at 0.6 V. However, further increasing
the cathode CL to 100 μm resulted in a rapid decrease of the performance. By using the optimized thickness of the cathode, the anode CL was varied from 40 μm to 80 m (Fig. 4b). Similarly to the cathode behavior, maximum performance was observed for an intermediary value (t = 60 μm). Such behavior is related to a maximum thickness that minimizes both the electrical resistivity and the resistance to the transport of gase-ous species through the CL layer to reaction sites at the triple phase boundary along FL/electrolyte interface [25-28].The performance of both electrodes was found to be strongly dependent on the thickness of the elec-trodes and such result is in agreement with previously reported experimental data and theoretical calculations [25-28].
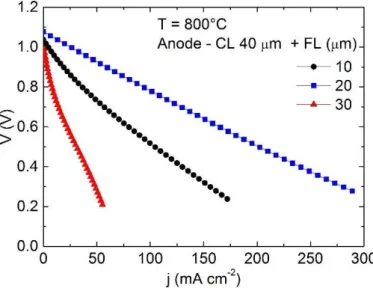
By setting the anode CL thickness at 40 μm, the influence of FL thickness was studied. Fig. 5 shows the I-V curves of single cells with anode FL thickness between 10 m and 30 m, and fixed CL layer (40
Figure 5: Polarization curves at 800°C of single cells with different anode FL layers and fixed CL (40 µm).
Figure 6 shows SEM images of the different FL at the electrolyte/anode interface corresponding to the single cells results shown in Fig. 5. The thickness of FL was estimated by SEM images in Fig 6a-c: 12.4, 20.3, and 26.7 µm, respectively, in good agreement with nominal values. Moreover, SEM images indicate good adhesion of anode FL to the electrolyte and homogeneous surface across the interface. The SEM imag-es confirm that it was possible to control the deposition of electrode layers by spin-coating.
Figure 6: SEM images of the electrolyte / anode functional interface with anode FL thickness (a) ~12 µm, (b) ~20 µm,
and (c) ~27 µm.
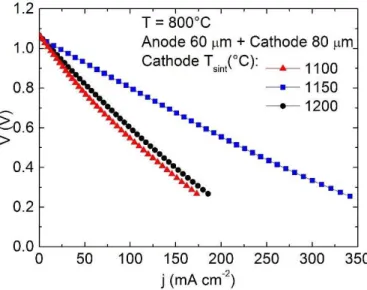
Both the thickness and the microstructure are key parameters for enhancing the performance of fuel cells. Therefore, a detailed analysis of the sintering temperature of both the cathode and anode was carried out. Figures 7 and 8 show the I-V curves of single cells with cathodes sintered at different temperatures and the correspondent SEM images, respectively.
The results of Fig. 7 revealed that the sintering temperature (Tsint) is a critical parameter for fuel cell performance. The sintering temperature controls both the particle/pore size distributions and the adhesion of the electrode layer to the electrolyte support. For the cathode (Fig. 7), a maximum performance was observed for Tsint= 1150°C. Increasing Tsint to 1200°C is known to result in undesired reactions between LSM and YSZ that can form resistive phases on the cathode/electrolyte interface (Fig. 2) [31]. The SEM images of the frac-tured cross section of the cathode sintered at different temperatures are shown in Fig. 8.
10 µm 10 µm 10 µm
NOBREGA, S.D.; MONTEIRO, N.K.;TABUTI, F.; FLORIO, D.Z.; FONSECA, F.C. revista Matéria, v.22, n.1, 2017.
Figure 7: Polarization curves at 800°C of single cells with different cathode sintering temperatures.
Fig. 8 shows round-shaped grains with average size < 1 µm for samples sintered up to 1150 °C. Both the average grain size and interparticle connectivity significantly increased with increasing sintering tempera-ture from 1100 to 1150 °C, a featempera-ture closely related to the enhanced performance of the fuel cell sintered at 1150 °C shown in Fig. 7. Further increasing Tsint to 1200°C resulted in significant microstructural changes, with larger grain size distribution and more faceted particles, probably reflecting the reaction between LSM and YSZ. Thus, controlling the cathode microstructure requires a careful control of the sintering temperature in a relatively narrow temperature interval.
Figure 8: SEM images for the cathode sintered at different temperatures: (a) 1100°C, (b) 1150°C, and (c) 1200°C.
Figure 9 shows the I-V curves of single cells with anodes sintered at different temperatures. For the anode a maximum performance was observed for Tsint.=1400°C. Such a strong dependence of the sintering temperature is related to both the adhesion between the anode layers to the electrolyte and better connectivity between Ni particles, observed as a significant decrease of the ohmic polarization in the I-V curve.
(a)
1 µm
(b) (c)
Figure 9: Polarization curves at 800°C of single cells with different anode sintering temperatures.
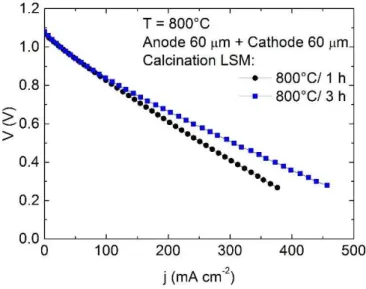
The cathode was further studied by varying the calcining temperature of the precursor powder. Fig. 10 shows the I-V curves of single cells with the LSM powder for both CL and FL calcined for different times. The curves indicated that increasing the calcination time from 1 h to 3 h decreases the polarization resistance of the cell. Such an effect is mainly observed in the ohmic loss region of the I-V curve and indicates that the complete removal of the organic residues of the LSM powder is important. The residual organics inhibit the sintering of the cathode and decreases the electronic conductivity of the electrode.
Figure 10: Polarization curves at 800 °C of single cells with LSM powders calcined for 1 h and 3 h.
NOBREGA, S.D.; MONTEIRO, N.K.;TABUTI, F.; FLORIO, D.Z.; FONSECA, F.C. revista Matéria, v.22, n.1, 2017.
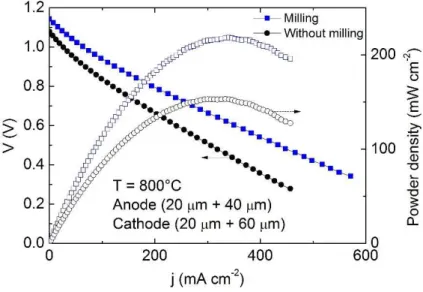
powder milling. Such an increased is reflected on the power density of the single cells shown in Fig. 11. Maximum power density displayed a significant increase from ~150 mW cm-2 to ~220 mW cm-2. Comparing power density values of fuel cells is a hard task due to different fabrication and measurement conditions used in reported studies. Nonetheless, the values obtained are comparable to previously reported data, but below the state-of-the-art fuel cells, which usually have thin YSZ supports (~150 µm) and can exceed 1 W cm-2 in similar testing conditions [32,33].
Figure 11: Polarization (left y-axis) and power density (right y-axis) curves at 800 °C showing the effect of milling
an-ode and cathan-ode FL powders.
In order to investigate the effect of the microstructural optimization of electrodes IS data of different fuel cells were measured at OCV. Figure 12 compares the impedance diagrams corresponding to the opti-mized fuel cell (Fig. 11) with non-optiopti-mized fuel cell (Fig. 5).
Figure 12: Impedance diagrams of single SOFCs before and after microstructural optimization. The inset shows the
ex-panded view of data corresponding to the optimized electrodes.
report-ed in this study to be limitreport-ed by both the electrolyte thickness (~500 µm) and the relatively low operating temperature for LSM cathodes. Nonetheless, measured values indicate that further development is required to attain lower polarization resistances and enhanced fuel cell performance. Such developments are underway.
4. CONCLUSIONS
A systematic optimization of the microstructure of spin-coated electrodes in electrolyte supported solid oxide fuel cell was carried out. The main results confirmed that processing of precursor powders along with careful control of cell fabrication are key parameters for achieving low polarization resistance. A decrease of circa two orders of magnitude of the electrode polarization resistance resulted in significant performance en-hancement of single cells. Such results indicate that spin coating can be used as a fast and cost effective tech-nique for deposition of solid oxide fuel cell electrodes.
5. ACKNOWLEDGEMENTS
Authors are thankful for the partial financial support of FINEP, CNPq, Fapesp 2013/26961-7, 2014/09087-4, and CNEN. Authors are thankful to CAPES (SDN and NKM) for scholarships. FCF and DFZ are CNPq fel-lows.
6. BIBLIOGRAPHY
[1] MINH, N.Q. “Ceramic fuel cells”, Journal of The American Ceramic Society, v. 76, pp. 563-588, 1993. [2] ATKINSON, A., BARNETT, S., GORTE, R.J., et al.,“Advanced anodes for high-temperature fuel cells”, Nature Materials, v. 3, pp. 17-27, 2004.
[3] LIU, J., BARNETT, S.A. “Operation of anode-supported solid oxide fuel cells on methane and natural
gas”, Solid State Ionics,v. 158, pp. 11-16, 2003.
[4] ZHAN, Z., BARNETT, S.A. “Solid oxide fuel cells operated by partial oxidation reforming of iso -octane”, Journal of Power Sources, v. 155, pp. 353-357, 2006.
[5] LIAO, M., WANG, W., RAN, R., et al., “Development of a Ni-Ce0.8Zr0.2O2 catalyst for solid oxide fuel
cells operating on ethanol through internal reforming”, Journal of Power Sources, v. 196, pp. 6177-6185, 2011.
[6] FLORIO, D.Z., FONSECA, F.C., MUCCILLO, E.N.S., et al., “Materiais cerâmicos para células as co
m-bustível”, Cerâmica, v. 50, pp. 275-290, 2004.
[7] SCUEGRAF, K.K. Handbook of thin film deposition processes and techniques (Materials and processing technology), William Andrew, 2002.
[8] WINCEWICZ, K.C., COOPER, J.S. “Taxonomies of SOFC material and manufacturing alternatives”, Journal of Power Sources, v. 140, pp. 280-296, 2005.
[9] MINH, N.Q. “Solid oxide fuel cell technology—features and applications”, Solid State Ionics, v. 174, pp. 271 - 277, 2004.
[10] SMITH, D.L. Thin-film deposition: Principles & Practice, McGraw-Hill Professional, 1995.
[11] NOBREGA, S.D., GALESCO, M.V., GIRONA, K., et al., “Direct ethanol solid oxide fuel cell operating in gradual internal reforming”, Journal of Power Sources, v. 213, pp. 156 - 159, 2012.
[12] MONTEIRO, N.K., NORONHA, F.B., COSTA, L.O.O., et al., “A direct ethanol anode for solid oxide fuel cell based on a chromite-manganite with catalytic ruthenium nanoparticles”, International Journal of Hydrogen Energy, v. 37, pp. 9816 – 9829, 2012.
[13] XU, X., XIA, C., HUANG, S., et al., “YSZ thin films deposited by spin-coating for IT-SOFCs”, Ceram-ics International, v. 31, pp. 1061 - 1064, 2005.
[14] WANG, J., LU, Z., CHEN, K., et al., “Study of slurry spin coating technique parameters for the fabrica-tion of anode-supported YSZ films for SOFCs”, Journal of Power Sources, v. 164, pp. 17 - 23, 2007. [15] HUI, R., WANG, Z., YICK, S., et al., “Fabrication of ceramic films for solid oxide fuel cells via slurry
spin coating technique”, Journal of Power Sources, v. 172, pp. 840 - 844, 2007.
NOBREGA, S.D.; MONTEIRO, N.K.;TABUTI, F.; FLORIO, D.Z.; FONSECA, F.C. revista Matéria, v.22, n.1, 2017.
[18] XIE, H., SU, P.-C. “Fabrication of yttrium-doped barium zirconate thin films with sub-micrometer thickness by a sol–gel spin coating method”, Thin Solid Films, v. 584, pp. 116-119, 2015.
[19] KIMA, H.J., KIMA, M., NEOHA, K.C., et al.,“Slurry spin coating of thin film yttria stabilized zirco-nia/gadolinia doped ceria bi-layer electrolytes for solid oxide fuel cells”, Journal of Power Sources, v. 327, pp. 401-407, 2016.
[20] FONSECA, F.C, MUCCILLO, R. ”Properties of YBa2Cu3O7−δ-Ag superconductors prepared by the cit-rate method”, Physica C: Superconductivity and its Applications, v. 267, pp. 87 - 92, 1996.
[21] FONSECA, F.C., FLORIO, D.Z., ESPOSITO, V., et al., “Mixed ionic-electronic YSZ/Ni composite for
SOFC anodes with high electrical conductivity”, Journal of The Electrochemical Society, v. 153 (2), pp. A354 - A360, 2006.
[22] DHAHRI, J., SEMNI, K., OUMEZZINE, M., et al., “The effect of deficit of strontium on structural, magnetic and electrical properties of La0.8Sr0.2-xMnO3 manganites”, Journal of Alloy and Compounds, v. 394, pp. 51 - 57, 2005.
[23] ZEMNI, S., GASMI, A., BOUDARD, M., et al., “Effect of nominal strontium deficiency on the struc-ture and the magnetic properties of La0.6Sr0.4-δMnO3 manganese perovskites”, Material science and Engineer-ing B, v. 144, pp. 117 -122, 2007.
[24] JIANG, S.P. “Development of lanthanum strontium manganite perovskite cathode materials of solid
oxide fuel cells: a review”, Journal of Materials Science, v. 43, pp. 6799-6833, 2008.
[25] MURRAY, E.P., TSAI, T., BARNETT, S.A. “Oxygen transfer processes in (La,Sr)MnO 3/Y2O3-stabilized ZrO2 cathodes: an impedance spectroscopy study”, Solid State Ionics, v. 110, pp. 235-243, 1998. [26] VIRKAR, A.V., CHEN, J., TANNER, C.W., et al., “The role of electrode microstructure on activation
and concentration polarizations in solid oxide fuel cells”, Solid State Ionics, v. 131, pp. 189-198, 2000. [27] HAANAPPEL, V.A.C., MERTENS, J., RUTENBECK, D., et al., “Optimization of processing and m i-crostructural parameters of LSM cathodes to improve the electrochemical performance of anode-supported
SOFCs”, Journal of Power Sources, v. 141, pp. 216-226, 2005.
[28] CHEN, D., LIN, Z., ZHU, H., KEE, R.J. “Percolation theory to predict effective properties of solid o x-ide fuel-cell composite electrodes”, Journal of Power Sources, v. 191, pp. 240-252, 2009.
[29] KLEITZ, M., PETIBON, F. “Optimized SOFC electrode microstructure”, Solid State Ionics, v. 92, pp. 65-74, 1996.
[30] JIANG, S.P., CHAN, S.H. “A review of anode materials development in solid oxide fuel cells”, Journal of Materials Science, v. 39, pp. 4405-4439, 2004.
[31] BRANT, M.C., DESSEMOND, L. “Electrical degradation of LSM-YSZ interfaces”, Solid State Ionics, v. 138, pp. 1-17, 2000.
[32] BUCCHERI, M.A., SINGH, A., HILL, J.M. “Anode- versus electrolyte-supported Ni-YSZ/YSZ/Pt SOFCs: Effect of cell design on OCV, performance and carbon formation for the direct utilization of dry
me-thane”, Journal of Power Sources, v. 196, pp. 968-976, 2011.