PERFORMANCE ASSESSMENT OF THE SOCCER TEAMS IN BRAZIL USING DEA
Guilherme Marques Calôba * Marcos Pereira Estellita Lins
Programa de Engenharia de Produção (PO/PEP) Universidade Federal do Rio de Janeiro (UFRJ) Rio de Janeiro – RJ
[email protected] [email protected]
* Corresponding author / autor para quem as correspondências devem ser encaminhadas
Recebido em 07/2005; aceito em 05/2006 após 1 revisão Received July 2005; accepted May 2006 after one revision
Abstract
In this paper we propose a DEA (Data Envelopment Analysis) based ranking for Brazilian soccer teams. Ranking is a major issue for the soccer clubs, either when looking for sponsorship or expanding their supportive group. We first include value judgements, applying a method to consolidate the results of the national and international matches. Then we use both aggregate results as outputs for applying the DEA model. Rankings published by the Brazilian Soccer Confederation (CBF) and ‘Placar’, a traditional sports magazine, do not give any credit to international titles and national cups, focusing only on the results in the National League. We compare the DEA ranking with the Federation’s and the magazine’s, raising some controversial issues and drawing unexpected conclusions.
Keywords: soccer in Brazil; data envelopment analysis; decision aid.
Resumo
Neste artigo é proposto um ranking baseado em Análise Envoltória de Dados (DEA) para os times de futebol brasileiros. Ranking é uma questão importante para os clubes, quer seja quando procuram patrocínio ou expansão da torcida. Primeiramente incluídos julgamentos de valor, utilizando um método para consolidar resultados de torneios nacionais e internacionais. Em seguida usamos ambos agregados como outputs para a aplicação do modelo DEA. Os rankings da Confederação Brasileira de Futebol (CBF) e da tradicional revista Placar, por exemplo, não dão nenhum crédito a títulos internacionais e nacionais, focalizando apenas no resultado da Liga Nacional. O ranking obtido via DEA é comparado com os da CBF e da revista, o que ocasiona certa controvérsia e conclusões inesperadas.
1. Introduction
In Brazil, soccer is a passion. After winning the fifth FIFA World Championship in 2002, Brazilian soccer and its players became even more famous and sought after by the world’s best teams. People love to watch their own team’s games and those of the Brazilian national squad. There is great rivalry between clubs, and this is mainly seen in the cheering crowds. This rivalry is but one of the factors that emphasizes the role of soccer rankings; the ability to attract sponsors in return for advertising being another crucial factor.
The Brazilian Soccer Confederation (CBF) produces its ranking based only on the points every team has achieved in the national championship. Placar, the most renowned sports magazine in Brazil, designed its own ranking, but also only considers this same championship data.
In this paper, we question the rankings in measurement of team performance. Instead of using only the National Championship data, which is the same as when it began in 1971, we use data from the first Brazilian national championships, which went by the name of Brazil Cup, and date right back to the late 50’s. The clubs, however, have existed since the beginning of the century, when they played mostly state championships, which are a tradition in Brazil.
We also considered data from international competitions, such as the South American Champions Cup (also known as Libertadores) and others, besides the greatest title for a Brazilian team, the Toyota Championship, or Intercontinental Cup, which consists of a competition between the Libertadores champion and the European Champions Cup winner. Since the 80’s, a single game is played in this competition, while two or three games were played in the 60’s and the 70’s. Brazilian teams conquered this title in 1962 and 1963, when Pele’s Santos enchanted the world, 1981 with Zico’s Flamengo, 1983 with Grêmio, and finally in 1992 and 1993 with São Paulo.
Administration of soccer teams in Brazil is not so clear and straightforward as it is in Europe and the United States. Partnerships with companies come and go, players are sold throughout the year to European, Japanese and Arabian clubs. Consistent data regarding investment in the junior team, in stadium improvements and in sports materials is not available. The same applies to the number of tickets sold and the membership figures for fan clubs, which are two of the clubs’ most important assets.
We decided, therefore, to implement a DEA (Data Envelopment Analysis) Model using data from aggregate National and International Championships. These are the outputs of the DEA Model, whose input will be a single, unitary value, as proposed by Lovell and Pastor (1999).
Data Envelopment Analysis was initially developed by Charnes, Cooper & Rhodes (1978), using a CRS (constant returns-to-scale) model. This was followed by Banker, Charnes & Cooper (1984), with a VRS (variable returns-to-scale) model. Although opting for this basic VRS model, we will overcome some drawbacks, such as measurements with respect to Pareto inefficient projections, using non-radial efficiency measurements.
2. The Data
The data available comprises results from State and National Championships, National League Titles, South American Championships and Worldwide Competitions, as described below:
• State Championships are organized by the state federations, thus presenting no
coincident data series.
• National Championships contain data from the Brazilian Championship since 1971 to the 2003.
• National Cups began in 1989 and comprise data from the Brazilian Cup, in which two clubs face each other in two rounds and advance toward the finals. In addition, the Brazilian National Tournaments in the 60`s were included in the league titles, for there is little information about them. Data was gathered until 2003.
• South American Championships consist of the Libertadores Cup (1960-2003),
Mercosul Cup / South American Cup (1998-2003). The Mercosul Cup was idealized as a gathering of Brazil, Argentina, Chile, Uruguay and Paraguay`s best clubs, but participants are chosen without any explicit criteria. Other cups include Conmebol Cup (1992-1999), Libertadores Supercup (1988-1997), South American Cup Winners Cup (1989-1998), Masters Super Cup (1992 and 1995) and Golden Cup (1993, 1995 and 1996).
• Worldwide Competitions: Brazil has competed in two world club competitions:
FIFA World Championship, which took place only once and was hosted by Brazil in 2000, and the Intercontinental Cup, which has been held since 1960, except in 1975 and 1978.
The National Championship has a more detailed scoring, but for the South American, National and Worldwide Competitions, only the champion and the runner-up were considered.
In Brazil, some states have a considerable number of teams that can actually win the state championships. These tend to be the more economically developed states, such as São Paulo, Rio de Janeiro and the states of the southern region. In other states, however, there may be a single team or two that are actually able to win. Comparing teams from the former kind of state with teams from the latter kind would cause a serious distortion in the evaluation, because there is a lack of homogeneity among the state championships. Thus, we decided to disregard information about state championships.
As regards the National Championship, which is generally long, it is a remarkable achievement to reach fourth position. Another good result for a club is to have the top scorer in the championship.
When the cups were concerned, i.e., the Brazilian Cup and the National Tournaments from the late 50’s until 1970, we considered that a good result was to be in the finals, that is, to win or be in second place.
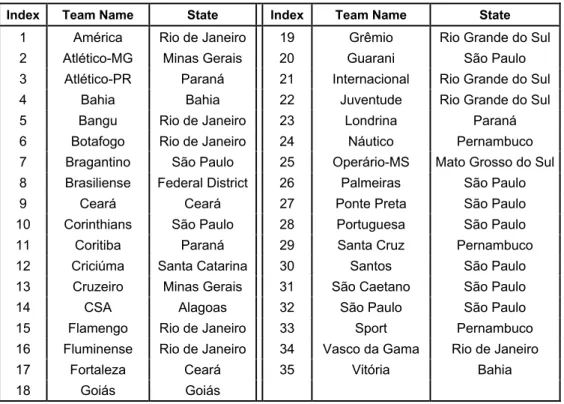
Clubs that did not achieve any of the results above will be eliminated from evaluation of the following set of DMUs. In other words, the data will be composed of teams that either accomplished any one of the first four places in the National Championship, or won or was the runner-up in a cup, or else had the top scorer. Thirty-five teams were selected. They are named in Table 1, along with the state to which they belong.
Table 1 – Teams participating in the DEA experiment and their states.
Index Team Name State Index Team Name State
1 América Rio de Janeiro 19 Grêmio Rio Grande do Sul 2 Atlético-MG Minas Gerais 20 Guarani São Paulo 3 Atlético-PR Paraná 21 Internacional Rio Grande do Sul 4 Bahia Bahia 22 Juventude Rio Grande do Sul 5 Bangu Rio de Janeiro 23 Londrina Paraná 6 Botafogo Rio de Janeiro 24 Náutico Pernambuco 7 Bragantino São Paulo 25 Operário-MS Mato Grosso do Sul 8 Brasiliense Federal District 26 Palmeiras São Paulo
9 Ceará Ceará 27 Ponte Preta São Paulo
10 Corinthians São Paulo 28 Portuguesa São Paulo
11 Coritiba Paraná 29 Santa Cruz Pernambuco
12 Criciúma Santa Catarina 30 Santos São Paulo 13 Cruzeiro Minas Gerais 31 São Caetano São Paulo
14 CSA Alagoas 32 São Paulo São Paulo
15 Flamengo Rio de Janeiro 33 Sport Pernambuco 16 Fluminense Rio de Janeiro 34 Vasco da Gama Rio de Janeiro
17 Fortaleza Ceará 35 Vitória Bahia
18 Goiás Goiás
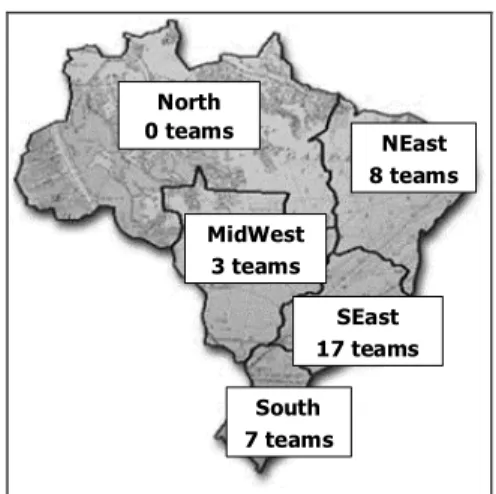
Total teams per state:
• 9 from São Paulo;
• 6 from Rio de Janeiro;
• 3 from Rio Grande do Sul, Paraná and Pernambuco;
• 2 from Ceará, Minas Gerais and Bahia;
• 1 from the Federal District, Goiás, Alagoas, Santa Catarina and Mato Grosso do Sul.
North
0 teams
NEast
8 teams
MidWest
3 teams
SEast
17 teams
South
7 teams
Figure 1 – Geographical distribution of teams in Brazil.
3. Composing Aggregates for National and International Results
If we considered each isolated competition result as a different output in a DEA program, the weights assigned to them should be restricted, in the multipliers model, so as to incorporate value judgements. This would allow better discrimination among units (Angulo-Meza & Estellita Lins, 2002) and avoid unacceptable weights. Rather, we included Decision Maker appraisal or expertise through a preceding step, where preferences were aggregated in National and International results, using the MACBETH method.
We shall begin by describing the process for the national performance, which is more complex than the international one. All the criteria were entered as stimuli for the software. Inputting data in MACBETH is done by declaring pairwise preferences between the stimuli.
The stimuli or criteria were identified as follows: • L1: 1st place in the National League; • L2: 2nd place in the National League; • L3: 3rd place in the National League; • L4: 4th place in the National League;
• Top: Team where the top scorer of the national league plays; • C1: 1st place in the National Cups;
• C2: 2nd place in the National Cups;
• Wor: A result worse than any of the above.
MACBETH automatically gives a weight or score of zero to the least preferred stimulus. As every result is important in the light of the national aggregate, we added the Wor criteria, a procedure recommended by the authors of the software (Bana e Costa et al., 1999).
We considered the following statements:
• Due to the tradition, the National Championship League should be slightly more
important than the National Cup. A title in the League has a very weak preference in relation to the Cup;
• A Title in the league is very strongly preferred to 2nd place in the league and in the championship, as well as in comparison to the top scorer. The relation is extreme between the title in the championship and the 3rd and 4th places;
• A Title in the Cup is very strongly preferred to 2nd place in any championship and top scoring and extremely preferred to 3rd and 4th places;
• Second places are slightly preferred to being top scorer, and increasingly towards the 4th place.
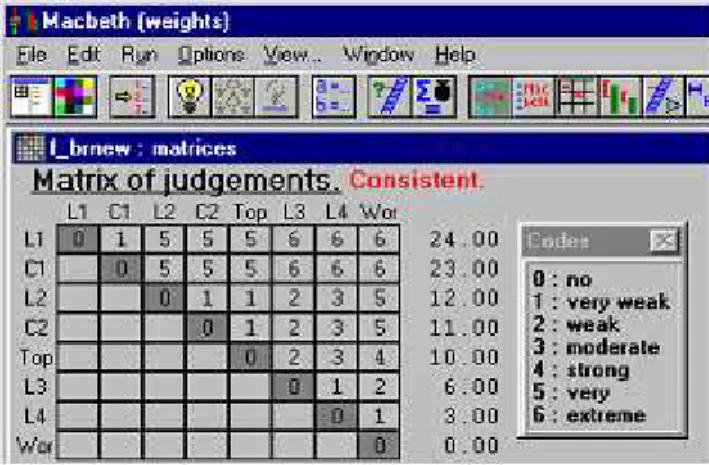
The preference matrix is presented in Figure 2.
Figure 2 – Judgement matrix for national championships.
The resulting weights for the stimuli are specified in the column to the right of the matrix. League titles should have a score of 24, cup titles, 23, 2nd places in the league and in the cup receive a score of respectively 12 and 11. Then a score for a given x club in the national aggregate will be given by:
NAx = 24.(L1x) + 23.(C1x) + 12.(L2x) + 11.(C2x) + 10.(Topx) + 6.(L3x) + 3.(L4x) (1)
Where all the incognita with index x represent the number of achievements of the club in a particular criteria.
For the international aggregate, the results considered as distinguishable were 1st and 2nd places in cups. The following criteria were adopted:
• Ot1: 1st place in one or more other South-American Cups (Mercosul Cup / South American Cup, Conmebol Cup, Libertadores Supercup, South-American Cup Winners Cup, Masters Supercup and Golden Cup);
• Ot2: 2nd place in the above listed cups;
• Wor: A result worse than any of the above, our aforementioned scale depth. The following assumptions were made:
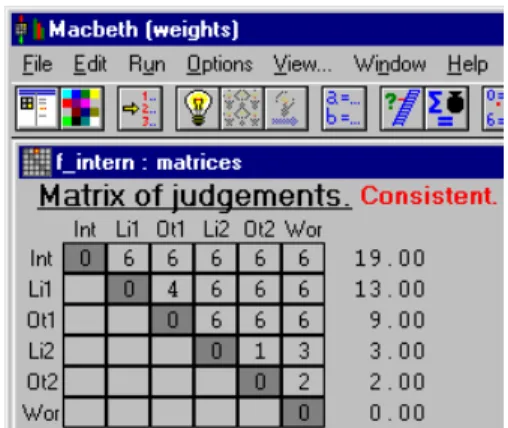
• The Intercontinental is extremely preferred in comparison to any other result; • The Libertadores is strongly preferred to other cup titles, except for Intercontinental; • Cup titles other than Libertadores are extremely preferred to 2nd place in any cup. The resulting preference matrix is shown in Figure 3, revealing that an Intercontinental cup should have a score of 19, a Libertadores Cup 13, and so forth.
Figure 3 – Judgement matrix for international championships.
Therefore, a club’s score in the international aggregate should be:
IAx = 19.(Intx) + 13.(Li1x) + 9.(Ot1x) + 3.(Li2x) + 2.(Ot2x) (2)
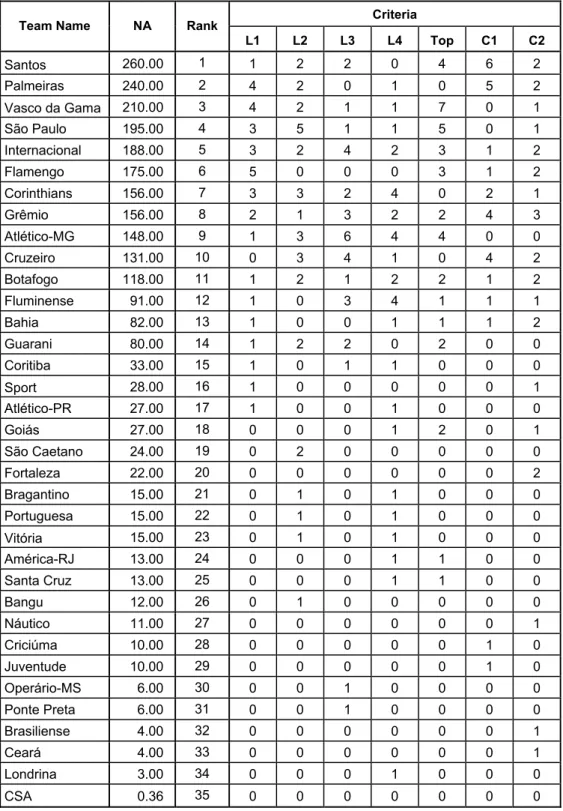
In Table 2, we show the achievements of each team according to every criteria composing the national aggregates, as well as the NA index itself, ranked in descending order.
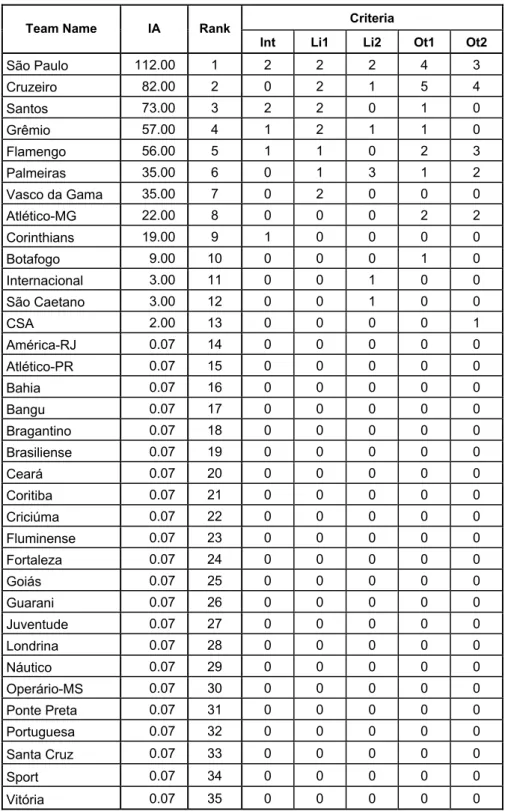
Note that, although the last team in the ranked NA, CSA presented zero values in the attributes, these values were replaced by a small amount ε, which in the case given is 0.36. A similar table was compiled for the international aggregates leading to the results shown in Table 3, also ranked in descending order.
We notice that only 13 clubs have scored in this category. The remaining 22 received the value of ε, equal to 0.07 for the IA index.
Table 2 – Teams achievement in criteria involved in NA.
Criteria
Team Name NA Rank
L1 L2 L3 L4 Top C1 C2
Santos 260.00 1 1 2 2 0 4 6 2
Palmeiras 240.00 2 4 2 0 1 0 5 2
Vasco da Gama 210.00 3 4 2 1 1 7 0 1
São Paulo 195.00 4 3 5 1 1 5 0 1
Internacional 188.00 5 3 2 4 2 3 1 2
Flamengo 175.00 6 5 0 0 0 3 1 2
Corinthians 156.00 7 3 3 2 4 0 2 1
Grêmio 156.00 8 2 1 3 2 2 4 3
Atlético-MG 148.00 9 1 3 6 4 4 0 0
Cruzeiro 131.00 10 0 3 4 1 0 4 2
Botafogo 118.00 11 1 2 1 2 2 1 2
Fluminense 91.00 12 1 0 3 4 1 1 1
Bahia 82.00 13 1 0 0 1 1 1 2
Guarani 80.00 14 1 2 2 0 2 0 0
Coritiba 33.00 15 1 0 1 1 0 0 0
Sport 28.00 16 1 0 0 0 0 0 1
Atlético-PR 27.00 17 1 0 0 1 0 0 0
Goiás 27.00 18 0 0 0 1 2 0 1
São Caetano 24.00 19 0 2 0 0 0 0 0
Fortaleza 22.00 20 0 0 0 0 0 0 2
Bragantino 15.00 21 0 1 0 1 0 0 0
Portuguesa 15.00 22 0 1 0 1 0 0 0
Vitória 15.00 23 0 1 0 1 0 0 0
América-RJ 13.00 24 0 0 0 1 1 0 0
Santa Cruz 13.00 25 0 0 0 1 1 0 0
Bangu 12.00 26 0 1 0 0 0 0 0
Náutico 11.00 27 0 0 0 0 0 0 1
Criciúma 10.00 28 0 0 0 0 0 1 0
Juventude 10.00 29 0 0 0 0 0 1 0
Operário-MS 6.00 30 0 0 1 0 0 0 0
Ponte Preta 6.00 31 0 0 1 0 0 0 0
Brasiliense 4.00 32 0 0 0 0 0 0 1
Ceará 4.00 33 0 0 0 0 0 0 1
Londrina 3.00 34 0 0 0 1 0 0 0
Table 3 – Team achievements in criteria involved in IA.
Criteria
Team Name IA Rank
Int Li1 Li2 Ot1 Ot2
São Paulo 112.00 1 2 2 2 4 3
Cruzeiro 82.00 2 0 2 1 5 4
Santos 73.00 3 2 2 0 1 0
Grêmio 57.00 4 1 2 1 1 0
Flamengo 56.00 5 1 1 0 2 3
Palmeiras 35.00 6 0 1 3 1 2
Vasco da Gama 35.00 7 0 2 0 0 0
Atlético-MG 22.00 8 0 0 0 2 2
Corinthians 19.00 9 1 0 0 0 0
Botafogo 9.00 10 0 0 0 1 0
Internacional 3.00 11 0 0 1 0 0
São Caetano 3.00 12 0 0 1 0 0
CSA 2.00 13 0 0 0 0 1
América-RJ 0.07 14 0 0 0 0 0
Atlético-PR 0.07 15 0 0 0 0 0
Bahia 0.07 16 0 0 0 0 0
Bangu 0.07 17 0 0 0 0 0
Bragantino 0.07 18 0 0 0 0 0
Brasiliense 0.07 19 0 0 0 0 0
Ceará 0.07 20 0 0 0 0 0
Coritiba 0.07 21 0 0 0 0 0
Criciúma 0.07 22 0 0 0 0 0
Fluminense 0.07 23 0 0 0 0 0
Fortaleza 0.07 24 0 0 0 0 0
Goiás 0.07 25 0 0 0 0 0
Guarani 0.07 26 0 0 0 0 0
Juventude 0.07 27 0 0 0 0 0
Londrina 0.07 28 0 0 0 0 0
Náutico 0.07 29 0 0 0 0 0
Operário-MS 0.07 30 0 0 0 0 0
Ponte Preta 0.07 31 0 0 0 0 0
Portuguesa 0.07 32 0 0 0 0 0
Santa Cruz 0.07 33 0 0 0 0 0
Sport 0.07 34 0 0 0 0 0
4. The DEA Model and its Results
Given the pre-processing step for the data set, we disregarded the use of direct weight constraints or those on the virtual outputs, as suggested by Wong & Beasley (1990). The question of allowing efficiencies of scale or not, was surpassed by the equivalence of CCR and BCC models, when using only one single-valued input.
The next step was to run a DEA Multipliers Model and its dual, the Envelope. The first one gives us the weights on inputs and outputs, and the second one, the benchmarks for the units. A radial performance index, such as that of the standard DEA would lead to inaccurate results, for there would be no clear separation between the efficiency of those points that are projected on the Pareto Efficient Frontier and the Non-Pareto Efficient Frontier. Rather we used the Slacks Based Measure of Efficiency (SBM) developed by Tone (2000) as our efficiency metric. SBM for a given DMU is calculated as the simple average of the ratios between projected and observed input values, divided by the simple average of the ratios between projected and observed output values. Considering the slacks si- as the difference between the projected and observed input i of a given DMU, the corresponding input ratio will be {xio – si-)/xio}. Adding for each input and dividing by the respective total of output ratios: {(yro + si+)/yro}, we obtain the SBM index ρ as:
ρ = ([1/m].Σi=1..m{(xio – si-)/xio}) / ([1/s].Σr=1..s {(yro + si+)/yro}) (3)
Since our model uses only one input, it is more appropriate to measure the direct ratio of outputs, instead of the inverse. So, we obtained the modified SBM efficiency as:
ρ = ([1/s].Σr=1..s {yro/(yro + si+)} (4)
In our simple, two outputs case, the formula becomes:
ρk = [(NAko/NAkp) + (IAko/IAkp)]/2 (5)
Where NAkp = NAko + sNA+ and IAkp = IAko + sIA+ are the projected outputs for NA and IA, considering the DMU k, where the o index stands for observed and p for projected. The values sNA+ and sIA+ are the positive slacks on these outputs.
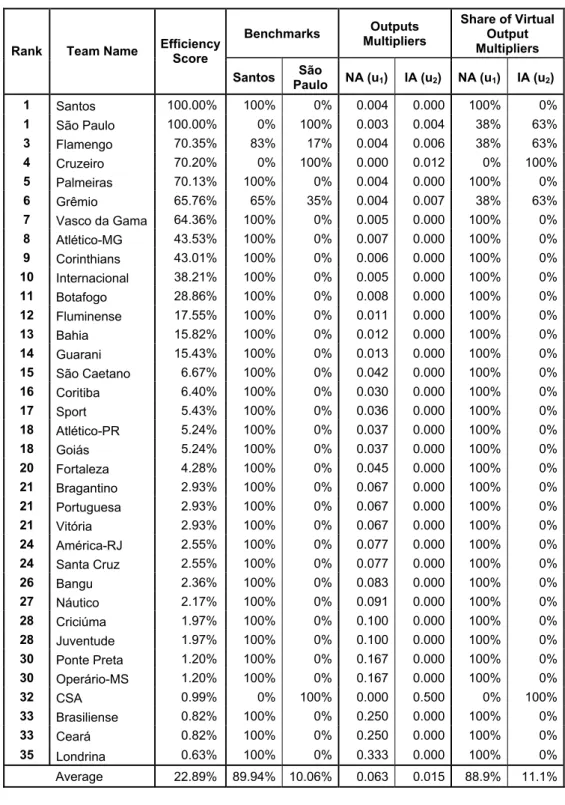
The model results are shown in Table 4, where the teams are ranked according to descending efficiencies. The contribution of the benchmarks (the two 100% efficient DMUs: Santos and São Paulo, obtained from the envelope model) are identified in the fourth and fifth columns.
It is remarkable that Santos is a benchmark for about 90% of the units, but São Paulo for only 10 %. From the sixth to the ninth columns, the Table shows information obtained from the multipliers model. In order to obtain scale invariance (Lovell & Pastor, 1995), we calculated the virtual outputs (multipliers times the output values) and presented their shares in the global virtual output in the eighth and ninth columns.
Table 4 – Results from the DEA model.
Benchmarks Outputs
Multipliers
Share of Virtual Output Multipliers
Rank Team Name Efficiency
Score
Santos São
Paulo NA (u1) IA (u2) NA (u1) IA (u2)
1 Santos 100.00% 100% 0% 0.004 0.000 100% 0%
1 São Paulo 100.00% 0% 100% 0.003 0.004 38% 63%
3 Flamengo 70.35% 83% 17% 0.004 0.006 38% 63%
4 Cruzeiro 70.20% 0% 100% 0.000 0.012 0% 100%
5 Palmeiras 70.13% 100% 0% 0.004 0.000 100% 0%
6 Grêmio 65.76% 65% 35% 0.004 0.007 38% 63%
7 Vasco da Gama 64.36% 100% 0% 0.005 0.000 100% 0%
8 Atlético-MG 43.53% 100% 0% 0.007 0.000 100% 0%
9 Corinthians 43.01% 100% 0% 0.006 0.000 100% 0%
10 Internacional 38.21% 100% 0% 0.005 0.000 100% 0%
11 Botafogo 28.86% 100% 0% 0.008 0.000 100% 0%
12 Fluminense 17.55% 100% 0% 0.011 0.000 100% 0%
13 Bahia 15.82% 100% 0% 0.012 0.000 100% 0%
14 Guarani 15.43% 100% 0% 0.013 0.000 100% 0%
15 São Caetano 6.67% 100% 0% 0.042 0.000 100% 0%
16 Coritiba 6.40% 100% 0% 0.030 0.000 100% 0%
17 Sport 5.43% 100% 0% 0.036 0.000 100% 0%
18 Atlético-PR 5.24% 100% 0% 0.037 0.000 100% 0%
18 Goiás 5.24% 100% 0% 0.037 0.000 100% 0%
20 Fortaleza 4.28% 100% 0% 0.045 0.000 100% 0%
21 Bragantino 2.93% 100% 0% 0.067 0.000 100% 0%
21 Portuguesa 2.93% 100% 0% 0.067 0.000 100% 0%
21 Vitória 2.93% 100% 0% 0.067 0.000 100% 0%
24 América-RJ 2.55% 100% 0% 0.077 0.000 100% 0%
24 Santa Cruz 2.55% 100% 0% 0.077 0.000 100% 0%
26 Bangu 2.36% 100% 0% 0.083 0.000 100% 0%
27 Náutico 2.17% 100% 0% 0.091 0.000 100% 0%
28 Criciúma 1.97% 100% 0% 0.100 0.000 100% 0%
28 Juventude 1.97% 100% 0% 0.100 0.000 100% 0%
30 Ponte Preta 1.20% 100% 0% 0.167 0.000 100% 0%
30 Operário-MS 1.20% 100% 0% 0.167 0.000 100% 0%
32 CSA 0.99% 0% 100% 0.000 0.500 0% 100%
33 Brasiliense 0.82% 100% 0% 0.250 0.000 100% 0%
33 Ceará 0.82% 100% 0% 0.250 0.000 100% 0%
35 Londrina 0.63% 100% 0% 0.333 0.000 100% 0%
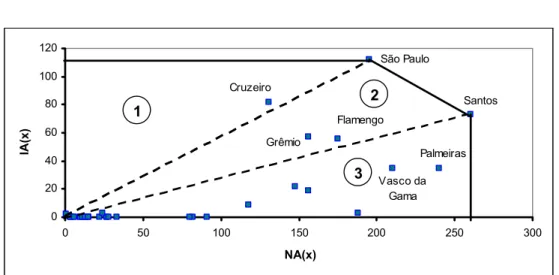
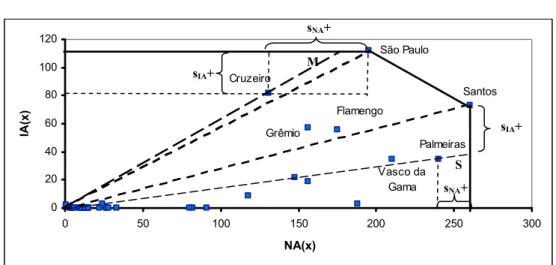
Figure 4 – Graphical representation of the efficient frontier.
The frontier is plotted with three solid lines, and the two efficient units, São Paulo and Santos, are clearly identified. We also added two dotted lines, thus separating the productivity set into three regions, which we labeled 1, 2 and 3. All DMU’s located in Region 1 will be projected onto the Pareto-inefficient facet defined by São Paulo. The SBM metrics yield reduced measurement for DMUs projected onto the non-Pareto efficient frontier. There are only two DMU’s in this region: Cruzeiro, which is identified in Figure 4, and CSA. The units located in Region 2, which are Grêmio and Flamengo are projected onto the facet defined by the two efficient units, thus the benchmark for these units will be partially São Paulo and partially Santos. The third set, Region 3, involves all units which are projected against the Pareto-inefficient facet defined by Santos.
A very significant number of units (32 out of 35) gives zero weight either to NA or IA multiplier. The advantage of the DEA method in comparison with other fixed-weight ranking methodologies is that the unit may choose how to distribute its weights in order to maximize its efficiency. The next section will further describe this issue.
We can graphically verify the slacks on each output, and thus observe how the SBM is calculated. This is done in Figure 5.
Note that DMU’s Cruzeiro and Palmeiras, for instance, if measured by traditional DEA efficiency, would consider projections in the Non-Pareto Efficient Frontier, over points M and S. However, their projection will be represented by São Paulo and Santos, respectively. We would remind here that, in order for their efficiency indexes to reflect this projection, we use SBM instead of classic DEA measurements, which calculates the efficiency using the slacks sNA+ and sIA+, as detailed previously.
0 20 40 60 80 100 120
0 50 100 150 200 250 300 NPI(x)
IP
I(
x
)
São Paulo
Santos Cruzeiro
Flamengo Grêmio
1
2
3
Palmeiras
Vasco da Gama
NA(x)
IA
(x
Figure 5 – Calculating the slacks for DMU’s, Palmeiras and Cruzeiro.
5. Ranking Comparisons
In this section, we will introduce the rationale of the other two rankings used nowadays to identify the best teams in Brazil, aiming to compare them with our proposed ranking.
The Brazilian Confederation ranking (Placar, 2004) is based on the total number of points scored by the teams in the league. There are three important issues for this index. First of all, until the mid-90’s, every game won would award the winner two points. From the mid-90’s to the present date, winning a match awards three points. This would benefit the most recent championships, and as the objective is to rank the teams from a historical perspective, adjustments would be mandatory in order to achieve a homogeneous set.
Another issue here is that the league format has been changing constantly ever since its beginning, and the number of matches every year also changes. Considering this, the more matches in a given year the more importance this team would have in the ranking.
Our third issue is that a team can achieve more points than all others and still not win the title. The 1st team in this rank is Atlético from Minas Gerais, which has won only a single championship, while Flamengo has won the league five times, and yet ranks only eighth.
The sports magazine Placar ranking (Placar, 2004) also considers only the league, and awards 10 points for the winner, 9 points for the 2nd team and continues this linearly descending award to the 10th team, which receives a single point.
We point out that this score is very partial and controversial. It seems extremely unfair, for instance, that a 1st and 3rd place would be equivalent to two 2nd places. The ranking lacks the clear discrimination between winning and not winning the title.
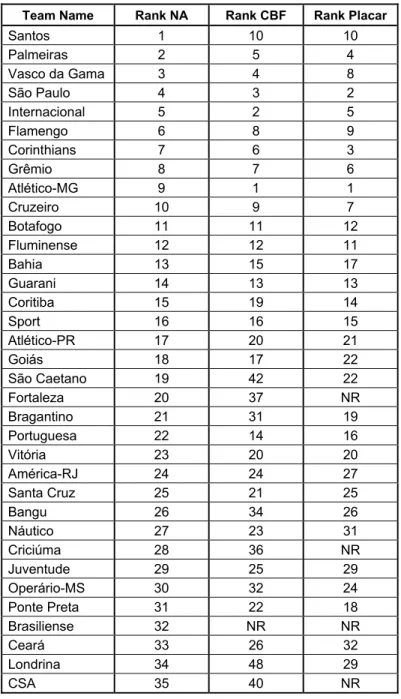
In Table 5, we present a preliminary comparison of team ranks in CBF, Placar and our national index of performance (NA). This is done to compare teams based on the same competitions.
0 20 40 60 80 100 120
0 50 100 150 200 250 300 NPI(x)
IP
I(
x
)
São Paulo
Santos Cruzeiro
Flamengo Grêmio
1
2
3
Palmeiras
Vasco da Gama
sIA+
sNA+
M
S
sIA+
sNA+
NA(x)
IA
(x
Table 5 – A comparison of national rankings.
Team Name Rank NA Rank CBF Rank Placar
Santos 1 10 10
Palmeiras 2 5 4
Vasco da Gama 3 4 8
São Paulo 4 3 2
Internacional 5 2 5
Flamengo 6 8 9 Corinthians 7 6 3
Grêmio 8 7 6
Atlético-MG 9 1 1
Cruzeiro 10 9 7
Botafogo 11 11 12
Fluminense 12 12 11
Bahia 13 15 17
Guarani 14 13 13
Coritiba 15 19 14
Sport 16 16 15
Atlético-PR 17 20 21
Goiás 18 17 22
São Caetano 19 42 22
Fortaleza 20 37 NR
Bragantino 21 31 19 Portuguesa 22 14 16
Vitória 23 20 20
América-RJ 24 24 27
Santa Cruz 25 21 25
Bangu 26 34 26
Náutico 27 23 31
Criciúma 28 36 NR
Juventude 29 25 29
Operário-MS 30 32 24
Ponte Preta 31 22 18
Brasiliense 32 NR NR
Ceará 33 26 32
Londrina 34 48 29
CSA 35 40 NR
It is noticeable some differences in the rankings. For instance, Santos is the best in our view but is only tenth in the other two rankings. Atlético-MG has decreased from 1st in CBF and Placar’s rankings to ninth in our ranking. Other teams have similar rankings.
Table 6 – Comparison between rankings.
Team Name Rank DEA Rank CBF Rank Placar
Santos 1 10 10
São Paulo 1 3 2
Flamengo 3 8 9
Cruzeiro 4 9 7
Palmeiras 5 5 4
Grêmio 6 7 6
Vasco da Gama 7 4 8
Atlético-MG 8 1 1 Corinthians 9 6 3
Internacional 10 2 5
Botafogo 11 11 12
Fluminense 12 12 11
Bahia 13 15 17
Guarani 14 13 13
São Caetano 15 42 22
Coritiba 16 19 14
Sport 17 16 15
Atlético-PR 18 20 21
Goiás 18 17 22
Fortaleza 20 37 NR
Vitória 21 20 20
Portuguesa 21 14 16 Bragantino 21 31 19
Santa Cruz 24 21 25
América-RJ 24 24 27
Bangu 26 34 26
Náutico 27 23 31
Juventude 28 25 29
Criciúma 28 36 NR
Operário-MS 30 32 24
Ponte Preta 30 22 18
CSA 32 40 NR
Ceará 33 26 32
Brasiliense 33 NR NR
Londrina 35 48 29
Note that very few teams have similar ranks in the three lists. Santos, which was the most famous Brazilian team during the 60’s, providing several players to the Brazilian National Squad, winner of the 1958, 1962 and 1970 FIFA World Championship Titles, is placed in a
mediocre 10th place. According to the DEA metrics, which considers both national and
The reverse situation happens with teams who have performed well in the league, such as Atlético-MG, Internacional and Corinthians, but lack the international performance. Some clubs do not present further ranking changes when applying the proposed DEA method, for instance, Palmeiras, Grêmio, Botafogo, Fluminense and Náutico.
6. Conclusions
Brazilian Soccer Confederation produces a ranking based solely on the National Championship. In this paper we used data from international and national competitions using a first step value judgement procedure followed by a DEA model. We applied non-radial efficiency measurements in order to overcome some drawbacks of basic DEA models, such as Pareto inefficient references.
We have shown that ranking is highly sensitive to a more comprehensive, though flexible, approach, as is the case of DEA, when allowing a wider range of national and international competitions to be considered. Moreover, DEA provides benchmarks that are used for measuring the performance of non-efficient units. As we pointed out in Figure 4, Santos became a reference for teams with medium and lower international results, while São Paulo turned out to be a reference for (a few) teams with higher international than national performance.
References
(1) Bana e Costa, C.A.; Ensslin, L.; Costa, E.C. & Vansnick, J.C. (1999). Decision Support Systems in action: Integrated Application in a multicriteria decision aid process. European Journal of Operational Research, 113, 315-335.
(2) Banker, R.D.; Charnes, A. & Copper, W.W. (1984). Some models for estimating
Technical and Scale inefficiencies in Data Envelopment Analysis. Management
Science, 30(9), 1078-1092.
(3) Charnes, A.; Copper, W.W. & Rhodes, E. (1978). Measuring the Efficiency of
Decision-Making Units. European Journal of Operational Research, 2, 429-444.
(4) Lovell, C.A.K. & Pastor, J.T. (1999). Radial DEA models without inputs or without outputs. European Journal of Operational Research, 118, 46-51.
(5) Lovell, C.A.K. & Pastor, J.T. (1995). Units Invariant and translation invariant DEA models. Operations Research Letters, 18, 147-151.
(6) Meza, L.A. & Lins, M.P.E. (2002). Review of Methods for Increasing Discrimination in Data Envelopment Analysis. Annals of Operations Research, 116, 225-242.
(7) Ranking Placar do Futebol Brasileiro (2004). Editora Abril.
(8) Tone, K. (2000). A Slacks Based Measure of Efficiency. European Journal of
Operational Research,130, 498-509.