1
National University of Chimborazo, Faculty of Health Sciences, School of Clinical Laboratory. Riobamba, Ecuador. 2
National University of Chimborazo, Faculty of Health Sciences, School of Medicine. Av. Antonio José de Sucre, km 1 ½ vía a Guano, Riobamba, Ecuador. Correspondência para/Correspondence to: ME GUERENDIAIN MARGNI. E-mail: [email protected]
3
Temple University, College of Science and Technology, Institute for Cancer Research and Molecular Medicine. Philadelphia, PA, United States.
Anthropometric and hematological tests
to diagnose nutritional deficiencies in
schoolchildren of indigenous communities
living in the Andean region of Ecuador
Análise antropométrica e hematológica para o
diagnóstico de deficiências nutricionais em
escolares de comunidades indígenas que vivem
na cordilheira dos Andes no Equador
Ximena del Rocío ROBALINO FLORES1
Aida Mercedes BALLADARES SALTOS1
Marcela Esther GUERENDIAIN MARGNI2
Fátima MORALES MARÍN3
A B S T R A C T
Objective
To carry out the anthropometric and biometric-hematological assessments in schoolchildren of the Andean region of Ecuador, in order to improve the diagnosis of nutritional deficiencies.
Methods
Results
The schoolchildren showed high prevalence of stunting (44%). The values of hematocrit (p=0.001) and hemoglobin (p=0.003) were higher in girls. It should be highlighted that using the normal value of hemoglobin, anemia was not detected. However almost a fifth of the schoolchildren studied were diagnosed with anemia when we applied the correction factors adapted to the altitude.
Conclusion
The use of correction factors adapted to the altitude is considered essential to do the hematology test in populations that live in high altitude in order to avoid a false diagnosis. Moreover, it is necessary to establish the environmental factors related to the stunted growth of this population of the Andean region.
Keywords: Anemia. Anthropometry. Biometry. Child development. Indigenous population.
R E S U M O
Objetivo
Realizar avaliações antropométricas e biométrico-hematológicas em escolares da cordilheira dos Andes no Equador, a fim de melhorar o diagnóstico de deficiências nutricionais.
Métodos
O estudo foi realizado na escola San Juan (Chimborazo, Equador), localizada a 3240 metros acima do nível do mar, a 36 crianças de 5 e 6 anos de idade. Foram analisadas as medidas antropométricas (peso, altura e índice de massa corporal) e as concentrações de hemoglobina e hematócrito. A medida da hemoglobina foi avaliada considerando os valores absolutos e os corrigidos pela altura geográfica.
Resultados
A população escolar apresentou alta prevalência de altura baixa (44%). Os valores de hematócrito (p=0,001) e hemoglobina (p=0,003) foram maiores nas meninas. Deve-se destacar que usando o valor normal da hemo-globina, a anemia não foi detectada. No entanto, quase um quinto dos escolares estudados foram diagnosticados com anemia quando os fatores de correção adaptados à altitude foram aplicados.
Conclusão
O uso de fatores de correção adaptados à altitude é considerado fundamental ao fazer uma biometria a os habitantes da zona para evitar um diagnóstico errôneo. Além disso, é necessário estabelecer os fatores ambientais associados ao retardo do crescimento que existe nesta região dos Andes.
Palavras-chave: Anemia. Antropometria. Biometria. Desenvolvimento infantil. População indígena.
I N T R O D U C T I O N
Currently, nutritional changes are a Public Health problem in Ecuador, affecting the school-age population in particular. Undernutrition is one of the major causes of death in children [1]. Infant mortality, difficulty to access resources and education are important problems for the populations living in the Andean region [2-5]. In Ecuador, there are numerous indigenous communities living under these unfavorable conditions.
Investigations on the nutritional status of the Ecuadorian population are scarce. The
ELAN Ecuadorian Hospital Malnutrition study reported an undernutrition rate of 37.1% in 2012 [6]. The nutritional status of hospitalized patients was shown as not included within the therapeutic objectives [7]. When analyzing the diets of 110 Ecuadorian adults, it was noted that their daily needs of carbohydrates, vitamins D, E, and minerals, such as iron and calcium were not met [8]. However, there are no recent studies on the nutritional status of children who are hospitalized or attending an outpatient clinic.
Neira-Mosquera et al. [9] highlighted the need
In Ecuador, there are communities living more than 2,500 meters above the sea level (masl) in the Andean Mountain. In this region, the environmental conditions, such as oxygen pressure, solar radiation, or the weather itself change and affect inhabitants. Thus, it was detected adaptations, such as high-altitude hypoxia, which triggers physiological stress, manifesting in higher hemoglobin levels, among other signs [10]. In addition, the first height census carried out in Ecuador revealed that the schoolchildren living in rural Andean areas had the shortest statures in the country [11].
Hematological biometric analysis is an important laboratory test that assesses the nutritional status, detecting anemia, infections, or vitamin deficiencies. In developing countries, 53% of schoolchildren and 42% of pre-schoolchildren suffer from anemia. The prevalence of iron deficiency anemia among Colombian schoolchildren is 47% [12]. Nevertheless, there are no records of subclinical iron deficiency except a study carried out in Medellin [13]. According to the National Survey of Health carried out in the school-age population, there are no official numbers regarding anemia in Ecuador. Thus, the implementation of this type of studies, especially in rural highlands (Sierra), inhabited by indigenous communities, is necessary [14].
According to the United Nations Organization for Food and Agriculture, anemia increased in the last decade, especially among children aged 1–10 years [15]. World Health Organization (WHO) experts reiterated the need to carry out studies providing accurate information on the prevalence of iron deficiency anemia. Subclinical iron deficiency is difficult to diagnose, considering that hyperbaric hypoxia stimulates the erythropoiesis in high altitude areas, low sensitivity of conventional measurement methods, and capacity and percentage of transferrin saturation [12]. The WHO established as a general statement that hemoglobin level increases at high altitudes and proposed that these values should be adjusted
by the altitude of the location to define specific cut-off points for anemia. In such settings, the cut-off point for hemoglobin needs to increase with altitude to define anemia better.
Different models have been created with the intent to correct hemoglobin at high altitudes. It was used regression analysis equations, obtained by comparing the hemoglobin level based on the altitude level. A study carried out by Gonzales & Gonzales [16] related the anemia defined by the hemoglobin value corrected by the altitude, to the anemia defined as per iron deficiency, measured by the body iron content. After correcting the hemoglobin by the altitude effect, 26.6% of the individuals are still anemic; however, when defined as iron deficiency, only 5.7% are considered anemic. Therefore, there is no agreement between the prevalence of anemia when hemoglobin values are corrected by the altitude and the values measured based on the iron content in the body. For this reason, it is important to investigate which parameters need to be considered to diagnose anemia correctly in communities living above 2,500masl.
The population of San Juan is in the
province of Chimborazo, 18km from the city of
Riobamba, located at an altitude of 3,240masl in
the Highlands of the volcano Chimborazo [17].
M E T H O D S
The investigation was carried out in the
School of San Juan, in the Riobamba canton of
Chimborazo province in Ecuador. San Juan is located at 3,240 meters above the sea level, and it is a predominant indigenous community in the Ecuador Highlands (Sierra).
This is a descriptive cross-sectional study, which included 36 schoolchildren aged 5 and
6 years, who were members of the Evaluación
Alimentaria y Nutricional de Escolares de la Sierra (EVANES project, Alimentary and Nutritional Evaluation of Highland Schoolchildren). Children with physical or mental disability and those whose parents or guardians had not signed the Informed Consent Form were excluded from this study. Healthy looking school-age children living in rural communities and attending rural schools
in the Riobamba canton were included in this
study.
In order to, determine the sample size, we applied the following formula:
taking into account the total number of children enrolled in the educational unit and their proportion per class. Thus, number equal to 40 schoolchildren was determined as an adequate sample size between the preschool and first year. This includes additional 20% participants, taking into account the possible losses to follow-up. The sample used was selected randomly by using a number generator. In total, 36 children participated because 4 schoolchildren did not meet the inclusion criteria or lacked the consent of their parents.
We selected younger schoolchildren for this study as these are priority groups because of their immense vulnerability from a nutritional point of view. Their rapid growth requires higher nutrients and energy per kg of their body weight as compared to the other age groups at normal weight. An impaired linear growth during the
n = Z2
a N * p * q i2(N – 1) + * p* q Z2
a
first years of life can be very difficult to recover, even when dietary supplementation is used [19]. Thus, early diagnosis of nutritional deficits is essential to mitigate the potential consequences.
Anthropometric measures for weight and height were taken to determine the Body
Mass Index (BMI=weight/height2). We used an
arm weighing scale and a portable measuring rod, with the accuracy of 100g and 0.1cm, respectively. The nutritional status was defined according to the BMI Standard Deviation (SD) Score and height based on sex and age, using the software AnthroPlus (World Health Organization, Geneva, Suitzerland, 2011) version 3.2.2. Therefore, the children were classified as: 1) BMI/age: undernutrition (<-2 SD), normal weight (-2 to 1 SD), overweight (>1 to 2) obesity (>2 SD); 2) height/age: stunting (<-2 SD) and normal height (≥-2 SD).
Blood samples were taken at school and transferred to 3mL tubes containing anticoagulant ethylenediamine tetraacetic acid. Total count of leukocytes was carried out using a blood dilution in a tube, dilution buffer, cell-counting chamber, and microscopic reading. We used blood smears colored with wright, which is based on the microscopic observation of different types of leukocytes and their percentage to determine the leukocyte or differential leukocyte counts. The hematocrit or globular volume was processed by loading 7cm long glass capillaries up to three quarters and centrifuging them for 5 minutes at 12,000rpm. Further reading was performed using a microhematocrit card. Hemoglobin concentration was determined by the cyanmethemoglobin method (International Committee for Standardization in Hematology, WHO), which requires diluting the blood with Drabkin reagent. The absorption capacity of the solution was measured in a spectrophotometer at 545nm and was compared with a standard solution or multiplied by a counting factor. Platelets were counted in stained blood smears used for differential leukocyte counts [20].
(SPSS Inc., Chicago, Illinois, United States), version 20.0. The results were expressed as means ± SD (quantitative variables) and percentages (qualitative variables). The differences between variables were determined based on sex, using the Univariate General Linear Model, which is applied for quantitative variables, and the Chi-square test, which is used for qualitative variables. For all analyses, a bilateral significance was determined at p<0.05.
The project was conducted in accordance with the ethical standards of the Declaration of Helsinki (Hong Kong review, in September 1989, in Edinburgh in 2000 and in Korea in 2008), while following the guidelines of the Council for International Organizations of Medical Sciences for Latin America (Geneva review, 2002; Translation and Adaptation for Latin America, 2003 [21]), and current laws regulating human clinical investigations in Ecuador. The written Informed Consent was obtained from all children and signed by their parents or guardians. The study has been approved by the
Ethics Committee of the San Francisco de Quito University, Ecuador (code 2015-046E).
R E S U L T S
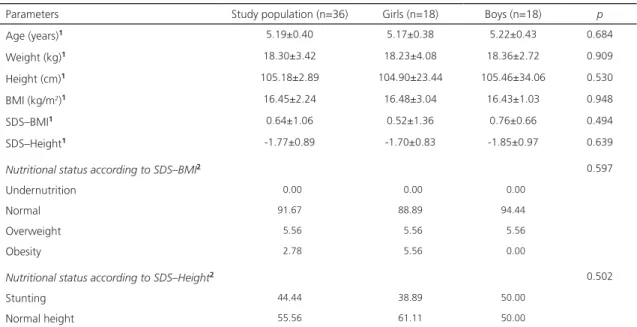
The anthropometric characteristics of children are shown in Table 1. Of the 36 schoolchildren, 18 were girls. The average age of these students was 5.19±0.40 years. Their average weight, height, and BMI were 18.30±3.42kg, 105.18±2.89cm, and
16.45±2.24kg/m2, respectively. When compared
by sex, we determined the average age of the girls and boys as 5.17 years, and 5.22 years, respectively. Average weight for girls and boys was 18.23kg and 18.36kg, while average height was 104.90cm and 105.46cm, and BMI was
16.48kg/m2 and 16.43kg/m2, respectively. No
statistically significant differences were observed in any of these parameters. The prevalence of stunting in these children was high at 44.44%. No statistically significant difference was noted
between boys and girls (p=0.502).
Table 1. Anthropometric characteristics and nutritional status of schoolchildren according to sex. San Juan, Riobamba, Ecuador (2015).
Parameters Study population (n=36) Girls (n=18) Boys (n=18) p
Age (years)1 5.19±0.40 5.17±0.38 5.22±0.43 0.684
Weight (kg)1 18.30±3.42 18.23±4.08 18.36±2.72 0.909
Height (cm)1 105.18±2.89 104.90±23.44 105.46±34.06 0.530
BMI (kg/m2)1 16.45±2.24 16.48±3.04 16.43±1.03 0.948
SDS–BMI1 0.64±1.06 0.52±1.36 0.76±0.66 0.494
SDS–Height1 -1.77±0.89 -1.70±0.83 -1.85±0.97 0.639
Nutritional status according to SDS–BMI2 0.597
Undernutrition 00.00 00.00 00.00
Normal 91.67 88.89 94.44
Overweight 05.56 05.56 05.56
Obesity 02.78 05.56 00.00
Nutritional status according to SDS–Height2 0.502
Stunting 44.44 38.89 50.00
Normal height 55.56 61.11 50.00
Note: Results expressed as 1mean ± standard deviation and 2percentages. Statistically significant difference: p<0.05 (1Univariate general linear
model, 2Chi-square).
Table 2 shows the biometric-hematological characteristics of schoolchildren according to their sex. Hematocrit level in girls was 44.81%
Table 2. Biometric-hematological parameters of schoolchildren according to sex. San Juan, Riobamba, Ecuador (2015).
Parameters Study population n Girls n Boys n p Reference values Hematocrit (%) 43.34±2.65 32 44.81±2.23 16 41.88±2.22 16 0.001 37–47* Hemoglobin (g/dL) 14.56±0.92 32 15.03±0.72 16 14.09±0.88 16 0.003 12.2–15.5* Hemoglobin CA (g/dL) 12.34±0.92 32 12.81±0.72 16 11.87±0.88 16 0.003 11.51 Leukocytes (x mm3) 10607.81±2453.07 32 10209.38±2788.32 16 11006.25±2079.17 16 0.367 4000–12000* Segmented (%) 49.94±13.03 32 47.00±13.40 16 52.88±1.36 16 0.207 55–65* Monocytes (%) 2.69±1.65 29 2.30±1.30 14 3.29±1.82 15 0.059 2–8* Lymphocytes (%) 46.03±13.15 32 49.06±12.76 16 43.00±13.23 16 0.197 20–45* Eosinophils (%) 2.63±2.59 19 2.73±3.26 8 2.50±1.41 11 0.856 1–4*
Basophils (%) 1.00±0.00 2 1.00±0.00 - - - - 0–1*
Platelets (x mm3) 438437.50±55189.37 32 458125.00±48883.37 16 418750.00±55482.73 16 0.041
200000–450000*
Note: Reference values: *Gonzales et al. [16] and 1World Health Organization [44]. Results expressed as mean ± standard deviation. p-values in
bold indicate statistically significant difference: p<0.05 (Univariate general linear model).
Hemoglobin CA: Hemoglobin Corrected by geographic altitude.
Figure 1. Comparison of absolute and adjusted hemoglobin concentration by geographic altitude. San Juan, Riobamba, Ecuador (2015; n=32).
Note: Concentrations below 11.5g/dL indicate anemia.
Hb: Hemoglobin; Hb CA: Hemoglobin Corrected by Geographic Altitude.
and hemoglobin level was 15.03g/dL. The boys had the hematocrit level of 41.88% and hemoglobin level of 14.09g/dL. The leukocyte
Hb Hb CA
0 5 10 15 20 25 30 35
Number of children
Hemoglobin concentration (g/dL)
17
16
15
13
12
11
10
9 14
11.5g/dL
Boys
counts were 102,09.38xmm3 in girls and
11,006.25xmm3 in boys. The platelet count in
girls was 458,125xmm3 and 418,750xmm3 in boys.
It should be noted that hematocrit values (p=0.001),
such as hemoglobin (p=0.003) and platelets
(p=0.041) were higher in girls than in boys.
Moreover, we determined the hemoglobin values adjusted by the geographic elevation. The results were adjusted with correction factors for
elevation, which was measured in the San Juan
parish as 3,240masl. Hemodynamic biometrics statisticians showed that corrected hemoglobin values for boys ranged from 10.58g/dL to 14.08g/dL. On the other hand, the values of hemoglobin without correction varied from 12.8g/dL to 16.3g/dL, as shown in Figure 1. However, it is noted that, after adjusting the concentrations, 6 children in the study (18.8%) presented values below 11.5g/dL, which is the reference cut-off value to diagnose anemia, and 5 of these children were boys.
D I S C U S S I O N
The analysis of anthropometric characteristics of the schoolchildren indicated that there were no statistically significant differences between boys and girls. However,
in a study carried out in the region of Aymara,
Bolivia, which is at 3,900masl, there were slight
differences in BMI values (i.e., BMI higher in
girls) [22]. Nevertheless, in a study carried out in
Funza, Colombia, at 2,548masl, the prevalence of stunting was higher in boys as compared to girls [4].
It is important to note the high prevalence
of stunting among schoolchildren in San Juan.
According to the first height census carried out in the country, the height of the 6 years–old girls and boys in this area was 106.7cm, and 107.7, respectively [11]. However, although the population size of this study is smaller, the data obtained for height is even lower (104.9 for girls and 105.5 for boys). In a research carried
out in Funza, Colombia, which included rural
and urban areas without specifying indigenous origin, 9.1% stunting in children aged 2–5 years was detected [4], which is substantially lower than the growth delay found in our study.
It is very important to identify risk factors capable of triggering this health problem, as has been done in similar studies conducted in the rural populations of Chile and Argentina. In these works, stunting was found to be related to maternal illiteracy, low birth weight, lack of maternal feeding, lack of hygiene at home, malnutrition, and low socioeconomic status of the families [23-25]. In addition, undernutrition has been associated with delayed psychomotor development in Ecuadorian [26] and Colombian [27] children. Furthermore, experimental animal studies associated brain growth retardation with undernutrition, which could not be reversed with nutritional supplements [28]. Thus, child nutrition is essential for maintaining adequate psychomotor and cognitive development.
An investigation on children aged 0–2 years, which was carried out in regions close to the study area revealed that risk factors for stunting are age, male sex, low socioeconomic status, having more brothers, and illiterate
mothers [29]. Karra et al. [30] agree that the
referring to children’s stunting and living at
high-altitudes and ancestral regions, which appear in a study carried out in areas at 3,700masl [33].
In a study conducted by Ferreira et al.
[34], the birth weight and height of indigenous children in Brazil were similar to the average WHO reference standards. However, shortly after birth, a change in growth was observed in both parameters. The authors suggested that the growth alterations in this population might be related to the precarious sanitary conditions and food insecurity, especially during the first years of life. This highlights the importance of environmental aspects in indigenous communities as the growth-influencing factors. This is supported by the notion that these children presented with values similar to the other populations at birth. The province of
Chimborazo, where the community of San Juan
is located, presents the greatest poverty in the country with indigenous populations being the most affected and deprived of basic necessities [18].
Although it does not refer specifically to indigenous communities, a study conducted in healthy children from low- and middle-resource countries reinforced the previous concept; the authors concluded that the large gaps in
children’s linear growth were probably because
of exposure to an unfavorable environment instead of any innate or genetic differences [30].
The parameters of blood count, total and differential white blood cell counts were within the reference values for children aged 2–12 years. A slight increase in platelets was observed only in girls.
The biometric-hematological analyses of hematocrit and hemoglobin demonstrated that the levels in the schoolchildren were within the admitted reference range [16] when the correction factor for height is not applied. Other studies carried out in Bolivia, at 3,700–4,000m elevation, set the cut-off value of anemia diagnosis at 14.4–15.8g/dL [35,36]. However, the corrected hemoglobin value gives us lower
results when compared to the WHO reference range [2], where anemia is considered when values are lower than 11.5g/dL. In this study, we found values of 10.5g/dL and detected anemia
among children at the School of San Juan in
Riobamba, Ecuador.
When comparing the values by gender, boys presented with lower levels of hemoglobin and hematocrit than girls did. Another study carried out in children living in the Himalayas, at 3,200m and 3,800m elevation had similar findings [37]. This is an important point that should be taken into account because the reference values shown in the bibliography are based on age only [38] and gender was not considered.
The average values of hemoglobin found in different studies that were carried out at high altitude areas vary according to the altitude, age, and the gender of the population. Several good examples are as follows: 16.1g/dL for adult men living in Nepal, at 3,300masl [39],
18.8g/dL in adult men living in La Paz, Bolivia
at 3,700masl [29], 17.5g/dL in adult Peruvians living at 3,680masl [40], 14.5g/dL in Bolivian adolescent girls living at 3,600masl, and 16.6g/dL in Peruvian adolescent girls living at 4,300masl [41]. In this study, the average value corresponds to 14.5g/dL for schoolchildren (boys and girls) who live at 3,240masl. Thus, reference values depending on age, sex, and altitude of residence are required to establish a common national and international pattern.
There are numerous studies comparing hemoglobin values among inhabitants of high altitude areas, above 3,000m elevation, and the residents of areas at sea level. Most of the time, these values are higher in areas of high
altitude [5]. Erzurum et al. [42] demonstrated
project aims to carry out a comparative study with students from other communities living at
lower altitudes in the province of Chimborazo
in Ecuador.
It should be noted that 6 schoolchildren in our study had anemia and 5 of them were
boys. Velásquez-Hurtado et al. [5] also found
that anemia is usually prevalent in boys. In our study, 18.8% of the schoolchildren participated had anemia which is a significant percentage of the population. Such anemia occurs when reference limits are applied to WHO-corrected hemoglobin values instead of the uncorrected values. Therefore, it is fundamental to correct hemoglobin values when working with inhabitants living in a region of high altitude, due to possible anemia cases might be masked. However, the determination of serum iron, ferritin, and transferrin is required to reach conclusive results. Thus, the next goal of the EVANES project is to analyze these metabolites, with the aim of defining the parameters to be considered when diagnosing anemia in indigenous populations, living in the Andean region.
Therefore, we conclude that the rural indigenous schoolchildren population in the
province of Chimborazo, Ecuador had high
prevalence of stunting. In addition, approximately one-fifth of the study population had anemia when WHO correction factors for height were applied. Anemia was mainly detected in boys, suggesting that schoolboys from the rural Highlands are more susceptible to develop anemia than girls. Given the differences identified with the use of the absolute hemoglobin concentration and the adjusted values, it is fundamental to apply correction factors for altitude when diagnosing this pathology. It should be noted that the authors will perform complementary tests, such as serum iron, ferritin and transferrin proteinogram, with the intent to confirm the results in schoolchildren presenting with anemia and residing at high altitude regions. In addition, environmental factors that predispose
schoolchildren to stunting and anemia will be studied. These aspects are critical in addressing the health policies considering the real needs of the rural indigenous populations of Ecuador.
A C K N O W L E D G M E N T S
We acknowledge the schoolchildren who participated in this study and their parents, Margoth Chávez, Luis Goyes, teachers and other personnel at the School of San Juan, students of the Clinical and Histopathological Laboratory of the Universidad Nacional de Chimborazo, and Iván Peñafiel, Professor of the aforementioned course, for having collaborated with the fieldwork.
C O N T R I B U T O R S
All authors participated in the development of the manuscript, approved the final version, sent to the journal. They all agree with authorship criteria and professional affiliation. XR ROBALINO FLORES and AM BALLADARES SALTOS carried out the fieldwork, analyzed the biological samples, and collected the data presented in the manuscript. ME GUERENDIAIN MARGNI carried out the analysis, interpreted the data obtained, organized the work, decided the design of the manuscript, and reviewed the final version, while F MORALES MARÍN elaborated the final draft of the manuscript presented herein.
R E F E R E N C E S
1. Sobrino-Toro M, Riaño-Galan I, Bassat Q, Perez-Lescure Picarzo J, de Aranzabal-Agudo M, Krauel-Vidal X, et al. Salud infantil y cooperación internacional: una aproximación pediátrica. An Pediatr. 2015;82(5):367.e1-6.
2. Food and Agriculture Organization of the United Nations. Country Fact Sheet: Ecuador. Rome: FAO; 2010 [cited 2016 Dec 18]. Available from: http:// www.fao.org/nr/water/aquastat/data/cf/readPdf. html?f=ECU-CF_eng.pdf
3. Psacharopoulos G, Patrinos H. Indigenous people and poverty in Latin America: An empirical analysis. Washington (DC): World Bank; 1994. 4. Poveda E, Cuartas A, Guarín S, Forero Y, Villarreal
A, factores de riesgo para las deficiencias y valoración antropométrica en niños preescolares del municipio de Funza, Colombia. Biomé-dica. 2007;27(1):76-93. https://doi.org/10.7705/ biomedica.v27i1.235
5. Velásquez-Hurtado JE, Rodríguez Y, Gonzáles M, Astete-Robilliard L, Loyola-Romaní J, Vigo WE, et al. Factores asociados con la anemia en niños menores de tres años en Perú: análisis de la Encuesta Demográfica y de Salud Familiar, 2007–2013. Biomédica. 2016;36(2):220-9. https:// doi.org/10.7705/biomedica.v36i2.2896
6. Gallegos Espinosa S, Nicolalde Cifuentes M, Santana Porbén S; Ecuadorian Group for the Study of Hospital Malnutrition. State of malnutrition in hospitals of Ecuador. Nutr Hosp. 2014;30(2):425-35. https://doi.org/10.3305/nh.2014.30.2.7559 7. Gallegos Espinosa S, Nicolalde Cifuentes M,
Santana Porbén S. Estado de los cuidados alimentarios y nutricionales en los hospitales públicos del Ecuador. Nutr Hosp. 2015;31(1):443-8. 8. Sánchez-Llaguno SN, Neira-Mosquera JA,
Pérez-Rodríguez F, Moreno Rojas R. Preliminary nutritional assessment of the Ecuadorian diet based on a 24-h food recall survey in Ecuador. Nutr Hosp. 2013;28(5):1646-56.
9. Neira-Mosquera JA, Pérez-Rodríguez F, Sánchez-Llaguno S, Moreno Rojas R. Study on the mortality in Ecuador related to dietary factors. Nutr Hosp. 2013;28(5):1732-40.
10. Bigham A, Bauchet M, Pinto D, Mao X, Akey JM, Mei R, et al. Identifying signatures of natural selection in Tibetan and Andean populations using dense genome scan data. PLoS Genet. 2010;6(9):e1001116.
11. Freire WB, Bacallao J. Primer censo Nacional de talla de los niños ecuatorianos de primer grado: resultados. Quito: Conade; 1992.
12. Castillo Bohórquez M, Mora Bautista AI, Munévar Valderrama A. Detección de deficiencias subclínicas de hierro a partir del índice receptor soluble de transferrina-ferritina en niños sanos de 1 a 10 años de edad residentes en alturas de 300 y 2600 msnm. Nova. 2009;7(11):43-51.
13. Agudelo GO, Cardona OL, Posada M, Montoya MN, Ocampo NE, Marín CM, et al. Prevalencia de anemia ferropénica en escolares y adolescentes, Medellín, Colombia, 1999. Pan Am J Public Health. 2003;13(6):376-86.
14. Freire WB, Ramírez-Luzuriaga MJ, Belmont P, Mendieta MJ, Silva-Jaramillo MK, Romero N,
et al. Encuesta Nacional de Salud y Nutrición. ENSANUT-ECU 2012. Quito: Ministerio de Salud Pública; 2014.
15. Moráis-López A, Dalmau-Serra J; Comité de Nutrición de la AEP. Importancia de la ferropenia en el niño pequeño: repercusiones y prevención. An Pediatr. 2011;74(6):415.e1-10.
16. Gonzales GF, Gonzales C. Hierro, anemia y eritrocitosis en gestantes de la altura: riesgo en la madre y el recién nacido. Rev Peruana Ginecol Obstetr. 2012;58(4):329-40.
17. Fernández D. Actualización plan de desarrollo y ordenamiento territorial parroquia San Juan, 2015-2019. San Juan: Centro de Estudios Para la Gestión Pública; 2015.
18. Sistema Nacional de Información. Información geográfica y sanitaria de Ecuador. Lima: Sistema Nacional de Información; 2015 [acceso 2015 Jul 20]. Disponible en: http://app.sni.gob.ec/ visorseguimiento/multimedia/seguimiento/portal/ reportes/indexg.htm
19. Bogin B. The growth of humanity. New York: Wiley-Liss; 2001.
20. Henry J. El laboratorio en el diagnóstico clínico. Madrid: Marbàn Libros; 2005.
21. Consejo de Organizaciones Internacionales de las Ciencias Médicas. Pautas éticas internacionales para la investigación biomédica en seres humanos. Santiago de Chile: Organización Panamericana de la Salud; 2003.
22. Beall CM, Brittenham GM, Strohl KP, Blangero J, Williams-Blangero S, Goldstein MC, et al.
Hemoglobin concentration of high-altitude tibetans and Bolivian aymara. Am J Phys Anthropol. 1998;106(3):385-400.
23. Poletti OH, Barrios L. Estudio de prevalencia de talla baja y factores de riesgo relacionados en escolares de Corrientes (Argentina). An Esp Pediatr. 2001;55(4):300-4.
24. Bustos P, Amigo H, Muñoz SR, Martorell R. Growth in indigenous and nonindigenous Chilean schoolchildren from 3 poverty strata. Am J Public Health. 2001;91(10):1645-9.
25. Amigo H, Bustos P, Leone C, Radrigán ME. Growth deficits in Chilean school children. J Nutr. 2001;131(2):251-4.
26. Huiracocha L, Robalino G, Huiracocha MS, García JL, Pazán CG, Angulo A. Retrasos del desarrollo psicomotriz en niños y niñas urbanos de 0 a 5 años: estudio de caso en la zona urbana de Cuenca, Ecuador. Maskana. 2012;3(1):13-28. 27. Quino Á, Aura C, Barreto BP. Desarrollo motor en
niños con desnutrición en Tunja, Boyacá. Rev Fac Nac Salud Pública. 2015;33(1):5-21.
29. Roche M, Gyorkos TW, Blouin B, Marquis GS, Sarsoza J, Kuhnlein HV. Infant and young child feeding practices and stunting in two highland provinces in Ecuador. Mater Child Nutr. 2017;13(2):1-15.
30. Karra M, Subramanian SB, Fink G. Height in healthy children in low- and middle-income countries: An assessment. Am J Clin Nutr. 2017;105(1):121-6. 31. Rooze S, Mathieu F, Claus W, Yangzom T, Yangzom
D, Goyens P, et al. Effect of calcium and vitamin D on growth, rickets and Kashin–Beck disease in 0– to 5–year–old children in a rural area of central Tibet. Tropical Med Int Health. 2016;21(6):768-75. 32. Nisar YB, Dibley MJ, Aguayo VM. Iron-folic acid
supplementation during pregnancy reduces the risk of stunting in children less than 2 years of age: A retrospective cohort study from Nepal. Nutrients. 2016;8(2):67-82.
33. Bianba B, Yangzong Y, Gonggalanzi G, Berntsen S, Andersen LB, Stigum H, et al. Anthropometric measures of 9– to 10–year–old native tibetan children living at 3700 and 4300 m above sea level and han chinese living at 3700 m. Medicine. 2015;94(42):e1516.
34. Ferreira AA, Welch JR, Cunha GM, Coimbra CEA. Physical growth curves of indigenous Xavante children in Central Brazil: Results from a longitudinal study (2009–2012). Ann Hum Biol. 2016;43(4):293-303.
35. Berger J, Aguayo VM, Téllez W, Luján C, Traissac P, San Miguel JL. Weekly iron supplementation is as effective as 5 day per week iron supplementation in Bolivian school children living at high altitude. Eur J Clin Nutr. 1997;51(6):381-6.
36. Tufts DA, Haas JD, Beard JL, Spielvogel H. Distribution of hemoglobin and functional consequences of anemia in adult males at high altitude. Am J Clin Nutr. 1985;42(1):1-11.
37. Garruto RM, Chin CT, Weitz CA, Liu JC, Liu RL, He X. Hematological differences during growth among Tibetans and Han Chinese born and raised at high altitude in Qinghai, China. Am J Phys Anthropol. 2003;122(2):171-83.
38. Vives JL, Aguilar JL. Manual de técnicas de laboratorio en hematología. Barcelona: Elsevier; 2006.
39. Beall CM, Reichsman AB. Hemoglobin levels in a himalayan high altitude population. Am J Phys Anthropol. 1984;63(3):301-6.
40. Tarazona-Santos E, Lavine M, Pastor S, Fiori G, Pettener D. Hematological and pulmonary responses to high altitude in Quechuas: A multivariate approach. Am J Phys Anthropol. 2000;111(2):165-76.
41. Bigham AW, Wilson MJ, Julian CG, Kiyamu M, Vargas E, Leon-Velarde F, et al. Andean and Tibetan patterns of adaptation to high altitude. Am J Hum Biol. 2013;25(2):190-7.
42. Erzurum SC, Ghosh S, Janocha AJ, Xu W, Bauer S, Bryan NS, et al. Higher blood flow and circulating NO products offset high-altitude hypoxia among Tibetans. Proc Natl Acad Sci USA. 2007;104(45):17593-8.
43. Fiori G, Facchini F, Ismagulov O, Ismagulova A, Tarazona-Santos E, Pettener D. Lung volume, chest size, and hematological variation in low-, medium-, and high-altitude central Asian populations. Am J Phys Anthropol. 2000;113(1):47-59.
44. World Health Organization. Haemoglobin concentrations for the diagnosis of anaemia and assessment of severity. Vitamin and Mineral Nutrition Information System. Geneva: WHO; 2011.