Heterogeneous Evolution of HIV-1 CRF01_AE
in Men Who Have Sex with Men (MSM) and
Other Populations in China
Xiaorong Peng, Haibo Wu, Xiuming Peng, Changzhong Jin, Nanping Wu*
State Key Laboratory for Diagnosis and Treatment of Infectious Diseases, Collaborative Innovation Center for Diagnosis and Treatment of Infectious Diseases, The First Affiliated Hospital, School of Medicine, Zhejiang University, 310003 Hangzhou, China
Abstract
Introduction
The HIV epidemic in men who have sex with men (MSM) continues to grow in most coun-tries. However, the phylodynamic and virological differences among HIV-1 strains circulat-ing in MSM and other populations are not well characterized.
Methods
Nearly full-length genomes (NFLGs) of the HIV-1 CRF01_AE were obtained from the Los Alamos HIV database. Phylogenetic analyses were conducted using the NFLG,gag,pol and envgenes, using the maximum likelihood method. Selection pressure analyses at the codon level were performed for each gene in the phylogenetic clusters using PAML.
Results
Sequences isolated from MSM in China clustered in Clusters 1 (92.5%) and 2 (85.71%). The major risk factor for Cluster 3 was heterosexual transmission (62.16%). The ratio of non-synonymous to synonymous substitutions in theenvgene (0.7–0.75) was higher than
thegag(0.26–0.34) orpol(0.21–0.26) genes. Inenvgene, Cluster 1 (4.56×10
-3
subs/site/ year) and 2 (6.01×10⁻³subs/site/year) had higher evolutionary rates than Cluster 3 (1.14×10⁻³subs/site/year). Positive selection affected 4.2–6.58% of the amino acid sites in
theenvgene. Two sites (HXB2:136 and 316) evolved similarly in Clusters 1 and 2, but not Cluster 3.
Conclusion
The HIV-1 CRF01_AE in MSM is evolving differently than in other populations. a11111
OPEN ACCESS
Citation:Peng X, Wu H, Peng X, Jin C, Wu N (2015) Heterogeneous Evolution of HIV-1 CRF01_AE in Men Who Have Sex with Men (MSM) and Other Populations in China. PLoS ONE 10(12): e0143699. doi:10.1371/journal.pone.0143699
Editor:Zhefeng Meng, Fudan University, CHINA
Received:July 29, 2015
Accepted:November 8, 2015
Published:December 1, 2015
Copyright:© 2015 Peng et al. This is an open access article distributed under the terms of the Creative Commons Attribution License, which permits unrestricted use, distribution, and reproduction in any medium, provided the original author and source are credited.
Data Availability Statement:All of the available NFLG sequences for CRF01_AE were obtained from the Los Alamos HIV database (http://www.hiv.lanl. gov/).
Funding:This study was supported in part by grants from the Mega-Project for National Science and Technology Development under the“12th, Five-Year Plan of China”(2013ZX10004-904).
Introduction
The HIV epidemic in men who have sex with men (MSM) continues to grow in most countries [1]. More than half of new HIV infections occur among MSM in both the United States of America and the United Kingdom [2,3]. In China, the proportion of MSM among those newly diagnosed with HIV increased to 29.4% in 2011 [4]. The drivers of the HIV epidemic in MSM are complex; they include increased high-risk behaviors, high risk of transmission through receptive anal intercourse, and a high prevalence within the network of possible sexual contacts [5]. There is an unmet need for studies focusing on the phylodynamics and virology of HIV transmission and acquisition risks for MSM and transmission dynamics within the MSM networks.
The molecular epidemiology of HIV infections in MSM in China was first studied in a small cohort (n = 45) in 2005–2006. In this cohort, the predominant subtype was the US-European origin subtype B virus (71.1%), followed by the CRF01_AE (24.4%), and CRF07_BC (4.4%) subtypes [6]. Four serial cross-sectional surveys in MSM, from 2005 to 2009 suggested that Non-B subtypes increased rapidly in recent years, in particular, CRF01_AE increased from 3.7% in 2005 to 50% in 2009 [7]. A nationwide molecular epidemiological survey in MSM showed that CRF01_AE accounted for 62.1% of infections in China as a whole between 2009 and 2011 [5]. In summary, CRF01_AE has become the predominant strain of the virus in MSM in China.
Recent studies have confirmed that CRF01_AE was introduced from Southeast Asia in the 1990s and has expanded rapidly in China [8]. The CRF01_AE epidemic in China is comprised of multiple genetically distinct clusters that have different risk factors and are epidemic in dif-ferent geographic regions. However, the evolutionary history of the clusters has not been well characterized.
Here, we have conducted a large-scale phylogenetic analysis of nearly full-length genomes (NFLG) of CRF01_AE strains to infer their evolutionary relationship. The substitution rates of the clusters were estimated using the Bayesian Markov Chain Monte Carlo (MCMC) method. We have also estimated the non-synonymous to synonymous substitution rate ratios (dN/dS ratio), and identified the positive selection sites for each cluster. These studies provide novel insights into the evolution of CRF01_AE in MSM, and will likely contribute to improving HIV-1 surveillance and vaccine development.
Materials and Methods
Sequence Data
All of the available NFLG sequences for CRF01_AE were obtained from the Los Alamos HIV database (http://www.hiv.lanl.gov/), on April 18, 2015. Identical sequences in the dataset are represented by the oldest sequence in the group. The dataset included 685 sequences. An initial alignment of the sequences was performed using Gene Cutter from the Los Alamos HIV sequence database (http://www.hiv.lanl.gov/content/sequence/GENE_CUTTER/cutter.html). The accession numbers for the sequences used in this study are summarized inS1 File.
Phylogenetic Tree Analysis
Evolutionary Rate
The substitution rates of the different clusters were estimated using the BEAST software and implementing an MCMC method [10]. The GTR+I+Г4 nucleotide substitution model and coa-lescent Bayesian skyline model were incorporated in the MCMC method [11]. A relaxed molecular clock model with uncorrelated lognormal distribution was used to infer the time-scaled maximum clade credibility phylogenies [12]. Multiple independent MCMC runs were performed and assessed for consistency. The MCMC analyses were combined to give a total chain length of 0.5-4x10⁷steps with sampling every 5,000 steps. The first 10% of the states of each chain were discarded as burn-in. Ten thousand trees were then sampled to estimate the evolutionary rate using LogCombiner v1.8.0. Convergence of relevant parameters was assessed by effective sample sizes over 200 in Tracer v1.5 (http://tree.bio.ed.ac.uk/software/tracer/).
Selection Pressure Analysis
To examine the selection pressure placed on each cluster, we estimated the ratio of non-synony-mous (dN) to synonynon-synony-mous (dS) substitutions for each cluster, using the HyPhy package [13]. Selection pressure analyses at the codon level for each gene in the different clusters were con-ducted using the CODEML program in the PAML 4.4 software package to apply site-specific models for detecting positive selection [14]. Two selective models that allow for positive selection (2a and 8;ω>1) were compared with two null models (1a and 7, respectively) that do not allow for positive selection. The likelihood ratio test was used to determine whether there were signifi-cant differences between the null model and the alternative model by calculating twice the log-likelihood difference following aχ2distribution, with the number of degrees of freedom [15].
Results
Phylogenetic analysis
Three phylogenetic trees were constructed from the CRF01_AE NFLGs (HXB2 nucleotide sequence numbering 796 to 8,905 nucleotides [nt]) using the ML approach with bootstrapping analyses to assess clade robustness: (1)envfragments (HXB2 6,789 to 8794 nt); (2)gag frag-ments (HXB2 796 to 2,216 nt); and (3)polfragments (HXB2 2,085 to 5,094 nt). The results for the NFLGs andenvfragments are shown inFig 1. The results forpolandgagfragments are shown inS1 Fig. Three clusters (numbered 1, 2, and 3) were observed in CRF01_AE sequences isolated from Chinese patients. MSM was the predominant risk factor for patients in Cluster 1 (92.5%) and 2 (85.71%). In contrast, heterosexuality was the major risk factor for patients in cluster 3 (62.16%).
Cluster 1 (bootstrap support in NFLG [82%] andenv[60%]) contained 40 sequences that were isolated between 2007 and 2012; notably, 47.5% of the sequences were isolated in 2009. Twenty-six sequences (65%) were isolated in LiaoNing (Table 1).
Cluster 2 (100% bootstrap support in NELG andenv) contained 27 sequences isolated between 2007 and 2011. Over half (59.2%) of the sequences were isolated in 2010. Sixteen sequences (40.7%) were isolated in Beijing (Table 1).
Cluster 3 (100% bootstrap support in NELG andenv) contained 37 sequences isolated between 2005 and 2007. The majority (70.3%) of the sequences were isolated in 2007. Eighteen sequences (48.6%) were isolated in GuangXi (Table 1).
Evolutionary analysis
Fig 1. Three distinct phylogenetic clusters of HIV-1 CRF01_AE were identified in China.(A) Phylogenetic tree for NFLG (HXB2: 796–8905 nt).
Individual sequences are indicated by symbols corresponding to their known risk groups: MSM (circle); heterosexual (triangle); intravenous drug use (IDU; square); and unknown high-risk behavior (diamond). (B) Phylogenetic tree of theenvgene (HXB2: 6789–8794 nt). The sequences isolated in China are
highlighted in red.
doi:10.1371/journal.pone.0143699.g001
Table 1. Characteristics of HIV-1 CRF01_AE strains in different clusters.
Number Risk factorsa Province Sampling Year
Cluster 1 40 MSM(92.5%), LiaoNing(65%) 2007–2012 2009(47.5%),
Hetero (7.5%) 2010 (35%)
Cluster 2 27 MSM(85.71%) BeiJing(40.7%), 2007–2011 2010(59.2%),
LiaoNing (25.9%) 2009 (18.5%),
2007 (14.8%)
Cluster 3 37 Hetero(62.16%), GuangXi(48.6%), 2005–2007 2007(70.3%),
IDU (37.83%) GuangDong (18.9%) 2005 (24.3%),
2006 (5.4%)
aRisk factors: MSM, men who have sex with men; Hetero, heterosexual; IDU, Intravenous Drug User Bold values are the most common characteristics of each lineage.
the magnitude of the selective pressure. A higher selective pressure indicates that the gene (or site) is under stronger positive selective pressure for amino acid substitution [16].
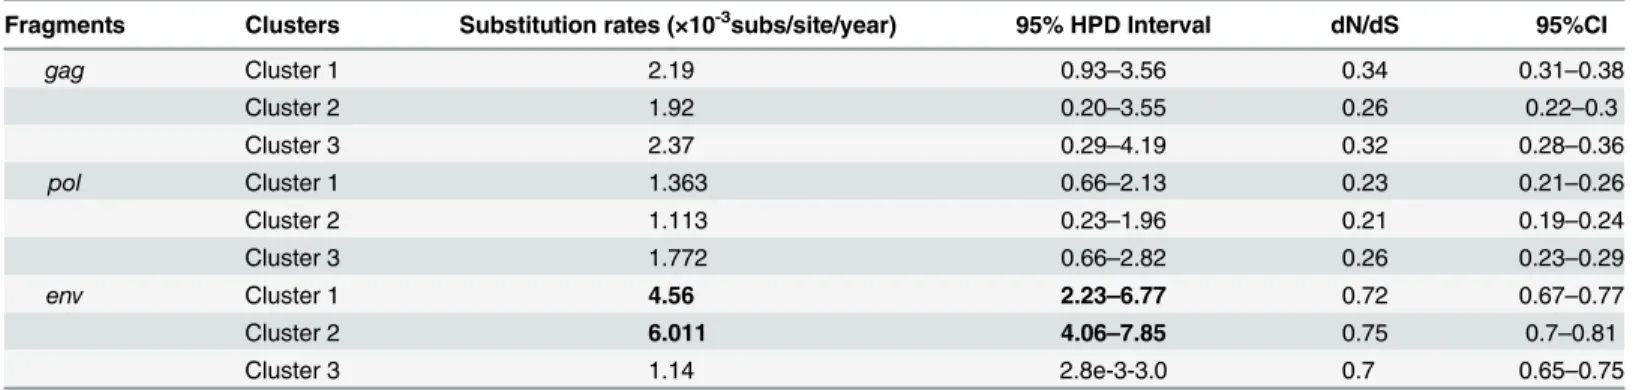
The dN/dS ratio for theenvgene (0.7–0.75) was higher than thegag(0.26–0.34) orpol
(0.21–0.26) genes, indicating greater selective pressure was exerted onenv. Within theenv
genes, Cluster 1 (4.56×10⁻³subs/site/year) and Cluster 2 (6.01×10⁻³subs/site/year) had higher evolutionary rates than Cluster 3 (1.14×10⁻³subs/site/year;Table 2).
Site-by-site Analyses
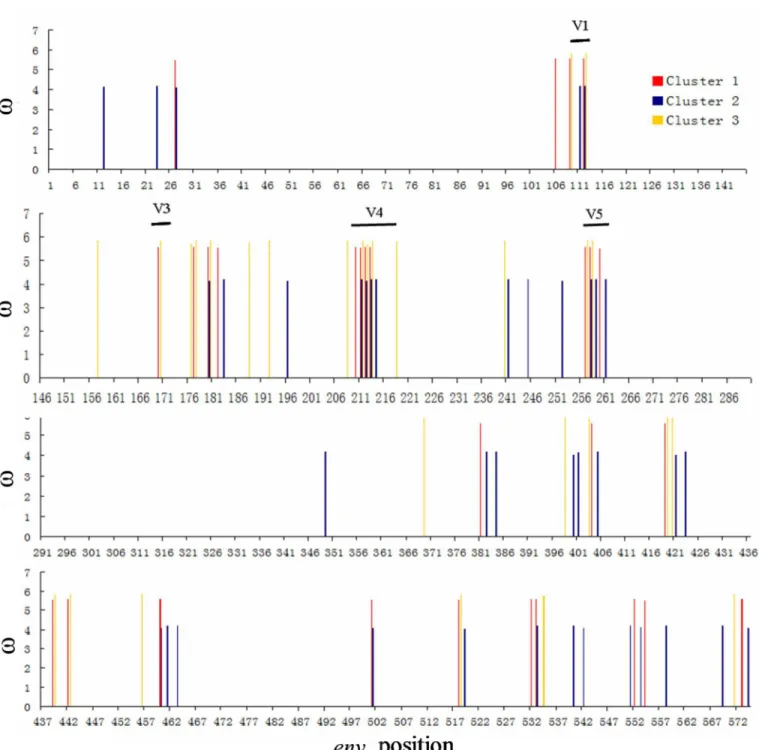
Positive selection usually affects only a few residues in a protein, therefore we used the site-spe-cific model in the PAML package to identify the positively selected sites (PSS) [17]. Two selec-tion models (M2a and M8) fit the data significantly better than the null models that did not incorporate selection (M1a and M7). The models indicated that 4.2%-6.58% of the amino acid sites in theenvgene appear to be under positive selection (dN/dS ratio: 3.78–5.81) (Table 3).
We then compared the similarities and differences in the PSS in the three clusters. Four PSS found in clusters 1 and 2 were not under positive selection in cluster 3. Of these, three (HXB2: 721, 775 and 816) were located in gp41, which suggested that the CRF01_AE gp41 protein is evolving and adapting in MSM. Seven PSS were identified in the three clusters that were evolv-ing differently. Of these, two (HXB2:136 and 316) were evolvevolv-ing similarly in Clusters 1 and 2
Table 2. Substitution rates and selective pressure for each HIV-1 gene by phylogenetic cluster.
Fragments Clusters Substitution rates (×10-3subs/site/year) 95% HPD Interval dN/dS 95%CI
gag Cluster 1 2.19 0.93–3.56 0.34 0.31–0.38
Cluster 2 1.92 0.20–3.55 0.26 0.22–0.3
Cluster 3 2.37 0.29–4.19 0.32 0.28–0.36
pol Cluster 1 1.363 0.66–2.13 0.23 0.21–0.26
Cluster 2 1.113 0.23–1.96 0.21 0.19–0.24
Cluster 3 1.772 0.66–2.82 0.26 0.23–0.29
env Cluster 1 4.56 2.23–6.77 0.72 0.67–0.77
Cluster 2 6.011 4.06–7.85 0.75 0.7–0.81
Cluster 3 1.14 2.8e-3-3.0 0.7 0.65–0.75
doi:10.1371/journal.pone.0143699.t002
Table 3. Positive selection characteristics for theenvgene in each cluster.
Date set Modela 2
Δℓb pc dN/dSd Adaptively evolving amino acidse
Cluster 1 M1a vs M2a 491.58 <0.001 5.58 27 (4.56%)
M7 vs M8 527.50 <0.001 5.22 37 (4.73%)
Cluster 2 M1a vs M2a 286.45 <0.001 4.37 25 (4.2%)
M7 vs M8 310.01 <0.001 3.78 39 (6.58%)
Cluster 3 M1a vs M2a 429.80 <0.001 5.81 27 (4.56%)
M7 vs M8 223.49 <0.001 5.50 28 (4.7%)
aModel code in PAML (seeMethods).
bthe likelihood ratio test statistics (2 delta lambda statistics). cThe P values indicate the level of signi
ficance with aχ2distribution and degrees of freedom = 2.
dAssociated average dN/dS (ω) of positions under positive selection.
eCodons with a high posterior probability (PP>0.90) that supports the likelihood of a site having a dN/dS>1.
and were significantly different from Cluster 3 (Fig 2). Threonine (T) was frequently used in site 136 (HXB2) in Clusters 1 (42.5%) and 2 (92.8%), while praline (P) was frequently used in Cluster 3 (52.9%). Lysine (K) was frequently used in site 316 (HXB2) in Clusters 1 (50%) and 2 (96.4%), while asparagine (N) was frequently used in Cluster 3 (47%,Table 4).
Fig 2. Positively selected sites in theenvgene from different clusters.The weighted mean dN/dS (ω) value for each site was calculated by multiplyingω
by the posterior probability for each cluster under M8 and summing the results. The weighted meanωratios of these sites were greater than 1 and the Bayes
Empirical Bayes (BEB) probabilities of these sites were higher than 95%. The positions of the five variable regions V1 to V5 are indicated.
Discussion
In this study, we carried out a large-scale sequence analysis of HIV-1 CRF01_AE. The CRF01_AE sequences isolated from MSM in China formed two clusters similar to previous studies [5]. These findings suggest that MSM have their own group, and that the HIV-1 sub-types circulating in MSM have unique evolutionary characteristics. We also observed distinct differences in the geographical distribution of the clusters: Cluster 1 was found more frequently in LiaoNing, while Cluster 2 was more concentrated in Beijing. As only a small fraction of sequences is included in the database, our study’s dataset is just a small sample of the viruses that circulate worldwide. This is a potential weakness of our study. Sample bias could be one of the reasons causing the distinct geographical differences among clusters.
The selective pressure is stronger onenvthangagorpol, and more sites under positive selec-tion were identified inenv. Theenvgene is associated with viral transmission and host cell tro-pism; it is also the primary target of the host immune response. Thus, many studies have evaluated its contribution to viral replication and HIV-1 pathogenesis [18]. The selective pres-sure exerted during transmission enhancesenventry efficiency and HIV-1 viral fitness, which might help explain the growing epidemic in MSM.
The envelope protein initially forms as a precursor (gp160) that is leaved by a cellular prote-ase to produce the surface subunit gp120 and the transmembrane subunit gp41. The gp120 protein is comprised of five variable (V1 to V5) and five conserved constant (C1 to C5) domains [19]. In our study, many of the PSS were found in the variable domains. However, there were marked differences between clusters. Some PSS were only observed in Clusters 1 and 2 (HBX2: 32, 721, 775, and 816). Sites 136 and 316 (HBX2) evolved differently and are located in the V1 loop and V3 loop respectively. The two sites circulating in MSM preferen-tially use threonine (T) and Lysine (K).
V1/V2 loop is generally exposed on the envelope and is one of the first targets of the early immune response [18]. Previous studies suggested that more compact or shorter V1/V2s reduce number of N-linked glycosylation sites and increase the number of quasispecies repli-cating in the plasma of donors at the time of transmission [20]. V1 and V2 also conceal the CD4 binding site; thus, deletion of the V1 and V2 regions increases viral sensitivity to neutral-izing antibodies. The V3 loop is exposed and engages the coreceptor (CCR5 or CXCR4), which then mediates membrane fusion. Further studies are needed to better understand how the 136 and 316 sites (HBX2) affect viral transmission.
Table 4. Summary of the amino acids of present at positively selected sites inenvin each cluster.
gp120 gp41
V1 V3 V4 v5
HXB2 136 139 316 340 343 402 403 404 459 464 640 674 677
109 112 170 177 180 211 212 213 257 258 419 439 442
Cluster 1
T (42.5%)
D(55%) K(50%) E (67.5%) R (72.5%) T(80%) M (42.5%) E (37.5%)
N(35%) N(45%) N (77.5%) D(80%) N (72.5%) Cluster 2 T (92.8%) G(50%) K (96.4%)
E(75%) N(50%) G (35.7%) T (82.1%) M (64.3%) N (28.6%) N (60.7%) N (71.4%) D (85.7%) N (78.5%) Cluster 3 P (52.9%) K (38.2%)
N(47%) E(50%) K (44.1%) E (41.1%) T (70.6%) I(32.3%) N (44.1%) N (67.6%) N (55.9%) D (70.6%) N (58.8%)
Bold values indicate positions that are similar in cluster 1 and 2, but markedly different from cluster 3.
Broad and potent HIV-1 neutralizing antibodies (bNAbs) are the goal of many HIV-1 vac-cine programs [21]. The four most vulnerable sites on theenvglycoprotein are the CD4 bind-ing site (CD4bs), glycan dependent epitopes in V1V2 and near the base of V3/C3, and linear epitopes in the membrane proximal external region (MPER) of gp41 [21]. These sites are widely recognized to differ between HIV-1 subtypes. Here, we demonstrated that they can also differ between transmissions, which add to the difficulty of developing an effective vaccine.
In summary, we conducted a large-scale sequence analysis of the HIV-1 CRF01_AE. The CRF01_AE sequences isolated in MSM in China formed two clusters and the highest rates of evolution were observed in theenvgene. In addition, the amino acids mutations at PSS differed between the clusters and are likely associated with virus budding and antigen recognition. These results further our knowledge of CRF01_AE evolution across transmissions, and will likely help improve HIV-1 surveillance and vaccine development.
Supporting Information
S1 Fig. Three distinct phylogenetic clusters of HIV-1 CRF01_AE were identified in China. (A) Phylogenetic tree of thegag(HXB2: 796–2216 nt). (B) Phylogenetic tree of thepolgene (HXB2: 2085–5096 nt).
(TIF)
S1 File. The accession numbers for the sequences used in this study. (XLS)
Acknowledgments
We would like to thank the native English speaking scientists of Elixigen Company (Hunting-ton Beach, California) for editing our manuscript. We gratefully acknowledge the support of the IBM high performance computing cluster of Bio-macromolecules Analysis Lab, Analysis Center of Agrobiology and Environmental Sciences, Zhejiang University.
Author Contributions
Conceived and designed the experiments: Xiaorong Peng NW. Performed the experiments: Xiaorong Peng HW Xiuming Peng. Analyzed the data: Xiaorong Peng CJ. Contributed reagents/materials/analysis tools: CJ NW. Wrote the paper: Xiaorong Peng HW.
References
1. Beyrer C, Baral SD, van Griensven F, Goodreau SM, Chariyalertsak S, Wirtz AL, et al. Global epidemi-ology of HIV infection in men who have sex with men. Lancet. 2012; 380(9839):367–77. doi:10.1016/ S0140-6736(12)60821-6PMID:22819660; PubMed Central PMCID: PMC3805037.
2. Hall HI, Song R, Rhodes P, Prejean J, An Q, Lee LM, et al. Estimation of HIV incidence in the United States. Jama. 2008; 300(5):520–9. doi:10.1001/jama.300.5.520PMID:18677024; PubMed Central
PMCID: PMC2919237.
3. Birrell PJ, Gill ON, Delpech VC, Brown AE, Desai S, Chadborn TR, et al. HIV incidence in men who have sex with men in England and Wales 2001–10: a nationwide population study. The Lancet
Infec-tious diseases. 2013; 13(4):313–8. doi:10.1016/S1473-3099(12)70341-9PMID:23375420; PubMed
Central PMCID: PMC3610092.
4. China. MoHotPsRo. China 2010 UNGASS Country Progress Report (2008–2009). UNGASS. 2010; http://data.unaids.org/pub/Report/2010/china_2010_country_progressreport_en.pdf.
5. Han X, An M, Zhang M, Zhao B, Wu H, Liang S, et al. Identification of 3 distinct HIV-1 founding strains responsible for expanding epidemic among men who have sex with men in 9 Chinese cities. Journal of acquired immune deficiency syndromes. 2013; 64(1):16–24. doi:10.1097/QAI.0b013e3182932210
6. Zhang X, Li S, Li X, Li X, Xu J, Li D, et al. Characterization of HIV-1 subtypes and viral antiretroviral drug resistance in men who have sex with men in Beijing, China. Aids. 2007; 21 Suppl 8:S59–65. doi: 10.1097/01.aids.0000304698.47261.b1PMID:18172393.
7. Wang W, Xu J, Jiang S, Yang K, Meng Z, Ma Y, et al. The dynamic face of HIV-1 subtypes among men who have sex with men in Beijing, China. Current HIV research. 2011; 9(2):136–9. PMID:21361866.
8. Feng Y, He X, Hsi JH, Li F, Li X, Wang Q, et al. The rapidly expanding CRF01_AE epidemic in China is driven by multiple lineages of HIV-1 viruses introduced in the 1990s. Aids. 2013; 27(11):1793–802. doi: 10.1097/QAD.0b013e328360db2dPMID:23807275; PubMed Central PMCID: PMC3819312. 9. Stamatakis A. RAxML version 8: a tool for phylogenetic analysis and post-analysis of large
phyloge-nies. Bioinformatics. 2014; 30(9):1312–3. doi:10.1093/bioinformatics/btu033PMID:24451623;
PubMed Central PMCID: PMC3998144.
10. Drummond AJ, Suchard MA, Xie D, Rambaut A. Bayesian phylogenetics with BEAUti and the BEAST 1.7. Molecular biology and evolution. 2012; 29(8):1969–73. doi:10.1093/molbev/mss075PMID: 22367748; PubMed Central PMCID: PMC3408070.
11. Minin VN, Bloomquist EW, Suchard MA. Smooth skyride through a rough skyline: Bayesian coales-cent-based inference of population dynamics. Molecular biology and evolution. 2008; 25(7):1459–71.
doi:10.1093/molbev/msn090PMID:18408232; PubMed Central PMCID: PMC3302198.
12. Drummond AJ, Ho SY, Phillips MJ, Rambaut A. Relaxed phylogenetics and dating with confidence. PLoS biology. 2006; 4(5):e88. doi:10.1371/journal.pbio.0040088PMID:16683862; PubMed Central PMCID: PMC1395354.
13. Pond SL, Frost SD, Muse SV. HyPhy: hypothesis testing using phylogenies. Bioinformatics. 2005; 21 (5):676–9. PMID:15509596.
14. Yang Z. PAML 4: phylogenetic analysis by maximum likelihood. Molecular biology and evolution. 2007; 24(8):1586–91. doi:10.1093/molbev/msm088PMID:17483113.
15. Yang Z, Bielawski JP. Statistical methods for detecting molecular adaptation. Trends in ecology & evo-lution. 2000; 15(12):496–503. PMID:11114436.
16. Sergei L KPA, Simon DW. Frost: Estimating selection pressures on alignments of coding sequences Analyses using HyPhy 2007. [http://wwwhyphyorg/pubs/hyphybook2007pdf]. 2007.
17. Yang Z, Wong WS, Nielsen R. Bayes empirical bayes inference of amino acid sites under positive selection. Molecular biology and evolution. 2005; 22(4):1107–18. doi:10.1093/molbev/msi097PMID: 15689528.
18. Rangel HR, Weber J, Chakraborty B, Gutierrez A, Marotta ML, Mirza M, et al. Role of the human immu-nodeficiency virus type 1 envelope gene in viral fitness. Journal of virology. 2003; 77(16):9069–73.
PMID:12885922; PubMed Central PMCID: PMC167250.
19. Pancera M, Zhou T, Druz A, Georgiev IS, Soto C, Gorman J, et al. Structure and immune recognition of trimeric pre-fusion HIV-1 Env. Nature. 2014; 514(7523):455–61. doi:10.1038/nature13808PMID: 25296255; PubMed Central PMCID: PMC4348022.
20. Cicala C, Arthos J, Fauci AS. HIV-1 envelope, integrins and co-receptor use in mucosal transmission of HIV. Journal of translational medicine. 2011; 9 Suppl 1:S2. doi:10.1186/1479-5876-9-S1-S2PMID:
21284901; PubMed Central PMCID: PMC3105502.