A Scoring Tool for Websites
–
A Case of Sustainable Organizations
Ahmed GOMAA
Marywood University, Scranton, PA, USA [email protected]
Rachel PAUKETT
Marywood University, Scranton, PA, USA [email protected]
Andrew R. DATTEL
Embry-Riddle Aeronautical University, Daytona Beach, FL, USA [email protected]
Abstract
This paper introduces a scoring tool to analyse company sustainability marketing efforts. We identify the expected scores for the companies selected on Corporate Responsibility Magazine’s list of 100 Best
Corporate Citizens of the year. The scoring tool is based on the aspects of sustainability and website quality and is divided into three categories: a) user friendly, b) transparency, and c) content. The automation of the scoring tool benefits from a sustainability taxonomy to extract and evaluate the sustainability concepts and efforts mentioned by the companies. The tool scores the selected companies websites to determine the extent and quality of a company’s marketing of sustainability efforts. The result of applying the scoring tool shows
that all companies in the list scored 8 to 14 in the user friendly section. In the transparency section, they scored 5 to 7, and in the content section they scored 6 to 10.
Keywords: sustainability; website analysis; scoring; marketing; benchmarking;
JEL Classification: C88, M39
1.
Introduction
There are people who aspire to leave some trace of their efforts behind, that in some way, great or small will make the world a better place for future generations. Companies have begun to realize that they too leave traces behind that affect the world at a greater magnitude than most individuals could ever accomplish. The effects of these traces could be felt for many generations afterwards on both humans and the organization itself. As a result of this realization, many companies have sought to find a way to continuously sustain both themselves and the world in order to ensure survival (Crane and Matten, 2010). The outcome of this desire to survive is the approach that many companies are using today, sustainability.
website, which provides for the dissemination of information to a growing population of internet users (Cobos et al., 2009). Corporate websites allow information to be provided quickly and easily to many individuals, providing a company with considerable power to affect stakeholders’perceptions of the organization. Providing that the proper sustainable initiatives are in place, marketing a company’s sustainability on its corporate website could aid the organization when it is considered for awards and/or placement on lists championing their degree of sustainability. This paper identifies the score range of sustainable companies’ websites based on three attributes: a) User friendly, b) Transparency and c) Content by analysing the websites using sustainability taxonomy.
2. Literature Review
2.1. Sustainability
Sustainability has been around for a number of years now, but has only recently gained a substantial amount of acclaim and corporate support, as today most organizations highlight their dedication to the topic in some way (Veleva and Ellenbecker, 2000). One of the most widely accepted views of sustainability is the idea of the triple bottom line, which identifies three areas of sustainable development: “environmental stewardship, social responsibility and economic benefits” (Xu, 2009). However, the definition of sustainability has evolved over time as the understanding of the topic has expanded to encompass all facets of running a business, and even now continues to change as companies grasp for an even better understanding of the inclusiveness of sustainability (Werbach, 2009). This quest for a concrete definition is partially due to the desire to create better benchmarks that companies can measure themselves against to obtain an idea of how they are performing sustainably, as well as inform them of areas that could use a little tweaking (van den Brink and van der Woerd, 2004). One such benchmarking tool that is currently used is Corporate Responsibility Magazine’s: CR’s 100 Best Corporate Citizens, which ranks organizations on the Russell 1000 index based on their sustainability in seven areas and also ranks them on their overall sustainability based on the combined score of the seven areas: environment, climate change, human rights, employee relations, corporate governance, philanthropy, and financial (Corporate Responsibility Magazine, 2012). Other sustainability benchmarking tools also exist, such as Newsweek’s Green Rankings and the Dow Jones Sustainability Index, helping companies assess their current level of sustainability and allowing for the further development of sustainability (2012 Green Ranking; and Dow Jones Sustainability Indexes).
2.2. Marketing
determine where a company stands sustainably and what could be done to adopt strategies of sustainability based on these categorizations (2009). The use of a framework for measuring sustainability has aided in the development of a more concrete picture of sustainability and its many facets. These models and categorization of companies’ marketing and sustainability have yet to be combined in a way that ties together a company’s sustainability and the marketing of its sustainability efforts. If combined, these two areas would allow marketing departments to determine how well they are marketing their efforts of sustainability.
2.3. Website Analysis
Corporate websites function as a way for organizations to market their company and/or its products and services through information, communication, transaction, and assurance (Coboset al., 2009). These functions are realized differently in each of the stages of web development, “publishing sites,” meant to provide information, “database and forms,” meant to provide and retrieve information, and “personalization,” which caters to individual preferences (Cobos et al., 2009). Much of the research concerning websites seeks to evaluate sites that are dedicated to e-commerce activities. Analysis of websites focused on e-commerce investigates attributes such as personalization, navigation, security, and quality (Tsai et al., 2011; Thorleuchter and van den Poel, 2012). However, these same ideas concerning the analysis of e-commerce websites can be applied in the evaluation of websites that focus on sustainability. Key aspects of websites focusing on sustainability are seen as the dissemination of information, ability to access it, and the ability to give feedback concerning the information (Moreno and Capriotti, 2006). Moreno and Capriotti even divided information concerning corporate social responsibility into ten different themes: corporate profile, products and services, employees/human resources, economic action, social action, environmental action, corporate ethics, public relations, corporate governance, and foreign relations/external affairs (2006).
2.4. Research Question
These investigations into sustainability’s definition and marketing aspects, have led to the question of what is the expected amount of effort that is typically placed on a sustainable company website. In order to find such an answer, new tools need to be introduced and tested. In order to measure an organization’s sustainability marketing efforts as depicted on its website, the rankings assigned to the 100 organizations on Corporate Responsibility Magazine’s 100 Best Corporate Citizens of 2012 (the list) were used as a representation of the true sustainability of an organization.
3. Methodology
organizations, through the analysis of their corporate website. These tools will help reveal insights into the amount of effort of the sustainability marketing activities in an organization.
3.1. Survey
The survey questions were developed based on information required to determine the degree to which the companies were marketing their sustainability. A representative of each company was contacted with an introductory email, which contained the reason for the email, the information that was sought, an attachment of the survey, an indication of the time when they should expect to be contacted by telephone to provide answers to the survey questions, and the option to reschedule. Depending on the way that the email for each company was set up, the survey questions would or would not be attached. If the survey questions could not be attached, then it was indicated that the questions could be sent if requested. Following an initial testing of the questions and process of administering the survey with a few organizations external to the list, the survey was distributed to companies on the list to determine if their efforts to market their sustainability correlate with their ranking on the list.
3.2. Website Analysis
In order to analyse the corporate websites, a website analysis tool was created to determine the degree to which a company is marketing its sustainability on its corporate website. The questions developed to analyse the websites were based on the attributes of sustainability and website quality and is divided into three categories: a) user friendly, b) transparency, and c) content.
3.2.1. Website Analysis attributes
a) User Friendly
1. Ease of access to information concerning sustainability
2. Ease of following and understanding information as it is presented on the website
3. Ability of all stakeholders to understand the content
4. Availability of information to answer any common questions
b) Transparency
1. Availability of a way to follow information about a company’s sustainability 2. Ability to contact the company with questions or comments concerning sustainability
3. Access to information on sustainability on the website
4. Access to external information concerning the topics discussed on the website
c) Content
1. Availability of summarized information versus detailed information
2. Access to information on the website and in the sustainability report concerning all aspects of sustainability
3. Mention of the company’s placement on CR Magazine’s 100 Best Corporate Citizens
website. The analysis of a company began with its homepage, and then proceeded through the site as necessary to answer the questions and generate a score for the company. This sequence is implemented as presented in the following section.
3.2.2 Automation of the website analysis tool
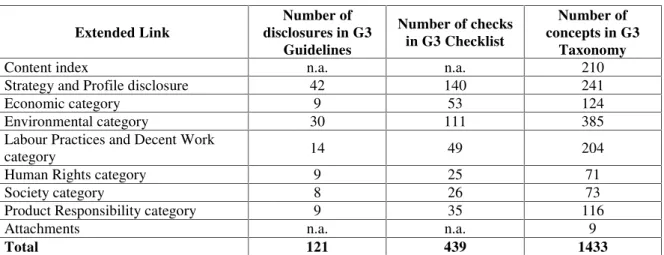
To be able to automate the analysis tool, sustainability taxonomy is required to map the concepts depicted on the corporate website to sustainability efforts. A number of taxonomies are already implemented including the GRI Taxonomy (Global Reporting Initiative). Table 1 shows the structure of this taxonomy which includes 1433 concepts. A boot will crawl companies websites, extract its site structure, and content to start performing both text and link mining to extract the meaning and the easiness of understanding and accessing the content as a step to rank the company site.
Table 1. GRI Taxonomy Framework
Extended Link
Number of disclosures in G3
Guidelines
Number of checks in G3 Checklist
Number of concepts in G3
Taxonomy
Content index n.a. n.a. 210
Strategy and Profile disclosure 42 140 241
Economic category 9 53 124
Environmental category 30 111 385
Labour Practices and Decent Work
category 14 49 204
Human Rights category 9 25 71
Society category 8 26 73
Product Responsibility category 9 35 116
Attachments n.a. n.a. 9
Total 121 439 1433
Source: Extracted from Arbex (2012) The attributes validation process:
a) User Friendly
1. Ease of access to information concerning sustainability: This is calculated by the number of nodes the agent needs to traverse to reach its target
2. Ease of following and understanding information as it is presented on the website: To enable the agent to “understand” the content, several steps need to take place
a. For each page that contains a title related to sustainability efforts For each paragraph in the page
For each sentence in the paragraph Do:
Search for the relevant stemmed concepts from the sustainability taxonomy (i.e.charity)
If one concept per paragraph rank = 1 If two concepts per paragraph rank = 2
If three or more concepts per paragraph rank = 3
If 1 to 2 concepts per page, then rank = 1 If 3 to 4 concepts per page, then rank = 2 If five or more concepts per page, then rank = 3 Repeat till end
Final sustainability ranking = mean page ranking
3. Ability of all stakeholders to understand the content: This is calculated by the number of modality each concept is represented, whether audio, video, image or text. The more the number of modality the more accessible and understandable the content. Total Accessibility rank = sumproduct (concepts x number of modalities per concept)
4. Availability of information to answer any common questions. This is calculated by the existence of contact information related to sustainability efforts.
b) Transparency
1. Availability of a way to follow information about a company’s sustainability. This is calculated based on the number of pages linking back to the company site and includes the same sustainability concepts included in the company site 2. Ability to contact the company with questions or comments concerning sustainability. This is calculated by the existence of contact information related to sustainability efforts.
3. Access to information on sustainability on the website. This is calculated by the existence of concepts related to sustainability.
4. Access to external information concerning the topics discussed on the website. This is calculated based on the number of pages linking back to the company site and includes the same sustainability concepts included in the company site.
c) Content
1. Availability of summarized information versus detailed information. This is calculated by validating the existence of internal pages acting as sustainability indexes, with links to different pages including different concepts all related to sustainability.
2. Access to information on the website and in the sustainability report concerning all aspects of sustainability. This is calculated by the matching percentage of the sustainability concepts existing in a company site and the sustainability taxonomy.
3. Mention of the company’s placement on CR Magazine’s 100 Best Corporate Citizens.
4. Results
4.1. Survey
The survey was distributed to companies listed on CR Magazine’s 100 Best Corporate Citizens of 2012, and the results were compiled. Though the response rate extinguished the validity of any statistical analysis and comparisons, the completed surveys offered a glimpse into the marketing efforts of the respondent companies. The questions on the survey that most represented a company’s marketing of sustainability were:
Question 3.Does the company mention its placement on CR Magazine’s 100 Best Corporate Citizens of 2012?
Question 5. To what degree does the company market its sustainable practices?
Question 6.To what degree does the company market its community and social programs?
These questions were scored on a scale of 1 to 5, with one representing ‘Never’ and five representing ‘Always.’ Below are the average scores of respondent companies for the four questions that related directly to the organizations’marketing of their sustainability.
Table 2. Averages of Survey Results for Survey Questions Most Related to Sustainability
Question 3 Avg. Question 5 Avg. Question 6 Avg. Question 7 Avg.
2.75 4 3.75 3.75
Table 2 reveals that the majority of the survey results for these four questions were positive, indicating that these companies are substantially endeavouring to market their sustainability. The response rate to the survey caused Questions 1 and 2, regarding the sector and customers of the company, to be too unrelated to be useful. Survey Question 8 inquiring about the allocation of the marketing budget, also could not be used, because the individuals interviewed did not know the information concerning the breakup of the marketing budget. Some individuals also indicated that their company either did not have much of a marketing budget due to the type of customers the organization served or that their marketing budget was too complex to determine based on the setup of the company. The answers to Question 9, concerning the effect of the company’s sustainability efforts, were consistent for all of the companies surveyed. All of the companies believed that they had substantially affected financial, community and environmental wellbeing with their sustainability efforts.
The greatest glimpse into the companies’marketing efforts came from Question 4, which asked organizations to list three reasons they felt had led to their placement on the list. The most prominent reasons listed were environmental reasons, followed by community focus and supply chain management practices. Also listed were reasons such as diversity and talent development, growth in the workplace, the fostering of long term employees, a financial literacy focus, stakeholder engagement, a robust Corporate Social Responsibility program, benefits of products, and the high visibility of corporate citizen projects. Other insights came from the elaboration of the reasons for the scores which the individuals provided on some questions. It was remarked that, in regard to marketing sustainable practices, the company would discuss their sustainability practices as much as they could when appropriate and where applicable. One organization mentioned that they had created a team to work on integrating Corporate Social Responsibility into their business model.
4.2. Website Analysis
The analysis of each of the companies listed on Corporate Responsibility Magazine’s 100 Best Corporate Citizens of 2012 (the list) also yielded some interesting insights into the research question. In the process of reviewing each website, two companies, Sara Lee Corporation and Marathon Oil Corporation could not be analysed due to their division into multiple companies after the publication of the list early in 2012.
Figure 1. Lilliefors test result for normal distribution of website analysis attributes
Lilliefors Test Results (Data Set #1) User Friendly Transparency Content
Sample Size 100 100 100
Sample Mean 9.820 6.050 7.410
Sample Std Dev 2.560 1.114 2.686
Test Statistic 0.1686 0.3121 0.2798
CVal (15% Sig. Level) 0.0769 0.0769 0.0769
CVal (10% Sig. Level) 0.0813 0.0813 0.0813
CVal (5% Sig. Level) 0.0888 0.0888 0.0888
CVal (2.5% Sig. Level) 0.0948 0.0948 0.0948
CVal (1% Sig. Level) 0.1298 0.1298 0.1298
Presenting the data in a scatterplot format, as shown in Figure 2, one can see the range of scores in the different categories for website analysis. The interesting observation is that there is no correlation between the site ranking as a sustainable company and the company score in any of the tested attributes.
Figure 2 A. Scatterplot of the tested attributed in the website analysis for sustainability related contents (Transparency)
0.0 0.1 0.2 0.3 0.4 0.5 0.6 0.7 0.8 0.9 1.0
-3
.0
-2
.0
-1
.0 0.0 1.0 2.0 3.0
Normal and Empirical Cumulative Distributions
Normal
User Friendly
Transparency
Content
0 20 40 60 80 100 120
0 1 2 3 4 5 6 7 8
R
an
ki
ng
Transparency
Figure 2 B. Scatterplot of the tested attributed in the website analysis for sustainability related contents (Content)
Figure 2 C. Scatterplot of the tested attributed in the website analysis for sustainability related contents (User Friendly)
As observed from Figure 2, there was not a direct correlation between the rankings of the companies on the list and the scores that they received for their marketing of sustainability on their websites. A subsequent table that re-ranked the companies based on their total score reveals the lack of correlation more clearly (See Annex 1). However, by running a logic regression test, and dividing the list into two groups of top 50 and lower 50 companies, based on the classification matrix, on can have 92% correctness if the website is not transparent enough, the website will not be on the top list. Further, one
0 20 40 60 80 100 120
0 2 4 6 8 10 12 14 16 18 20
R
an
ki
ng
Content
Scatterplot of Ranking vs Content of Data Set #1
0 20 40 60 80 100 120
0 2 4 6 8 10 12 14 16 18
R
an
ki
ng
User Friendly
can have 73% correctness if the content is relevant, the website will be on the top list. The user friendly option did reveals a poor 61% correctness, if the website is user friendly when it comes to sustainability content, the website will be on the top list.
4.3. Website Analysis Results
An investigation of the answers to the analysis questions in each category of the website analysis provides some interesting insights concerning current website marketing practices involving sustainability. In the a) User friendly category, analysis Question 1, concerning the placement of a link/tab to sustainability information on a company’s homepage, revealed that not every company had a link/tab to access the sustainability information available on their homepages. For some of the companies, it seemed that the lack of a prominent position given to sustainability links or tabs was due to the nature of the way that the company did business. For example, companies that used their sites for e-commerce were less likely to have a link or tab on the homepage to access sustainability information than companies that used their sites to provide information to stakeholders. Analysis Question 1 also provided a glance into each company’s approach to sustainability through the titles that each company gave to their information on sustainability.
Figure 3. Companies’Sustainability Program Titles Broken Down into Percentages
The program titles used most by companies on the list were Sustainability, Corporate Responsibility, Responsibility, and Corporate Citizenship. The high usage of some titles illustrates that the topic of sustainability has begun to take a more concrete form, while the variety in titles showcases the way that each organization has customized sustainability to fit their business and stakeholders.
Corporate Responsibility,
25%
Corporate Citizenship, 8%
Citizenship, 4% Responsibility (Responsibility: Doing Our Part),
9% Sustainability
(Sustainability Report), 28% Social
Responsibility, 5% Corporate Social Responsibility, 4%
Global Citizenship, 3%
Analysis Question 2 and 3, concerning the number of clicks it takes to reach information on sustainability and the sustainability report, give an indication of the ease of reaching the information on corporate websites. The ease of reaching information on sustainability was directly related to analysis Question 1 addressing the location of the link/tab on a company’s homepage. Many websites had easily locatable links to information concerning sustainability located on the company’s homepage. However, some companies did not have a direct link/tab to sustainability information on the homepage but instead this information was located under the link/tab used to reach the general information about the company. A few organizations even had their sustainability information buried deeper within the site, requiring a user to do a bit more searching to locate the information. The results of analysis Question 4, and 5, concerning the ease of following and reading sustainability information and the availability of the information in appropriate languages, revealed that the information on most corporate sites was easy to read and follow and was presented in the appropriate language(s) for the audience served. On the other hand, analysis Question 6, investigating the availability of a frequently asked questions page dedicated to sustainability, demonstrated that this was absent on most corporate websites.
In the b) Transparency category, the results for analysis Question 7, concerning the availability of a contact/ feedback option dedicated to sustainability, were nearly equally divided between companies that had contact or feedback information specifically for the topic of sustainability and those who did not. Analysis Question 8, investigating the availability of subscriptions to material on sustainability, indicated that many websites did not offer any subscriptions to material on sustainability related to the company. Those companies that did offer “subscriptions” to material about sustainability offered it in the form of blogs or Twitter accounts dedicated to the topic of sustainability. According to the scores on analysis Question 9, which looked into the availability of links to external sites with information on sustainability, many companies did not necessarily offer links to other websites with relevant information on sustainability. The links to external sites typically brought the user to the website of an award that the company had received or a website for one of the non-profit organizations or charities that the company supported. Analysis Question 10, concerning the number of internal links to additional information on sustainability, revealed that most of the corporate websites had various links that could be used to access information on sustainability for each company.
dedicated section of the corporate website. Finally, analysis Question 16 concerning the mention of a company’s placement on the list revealed that not all companies have their placement on Corporate Responsibility Magazine’s 100 Best Corporate Citizens available on their websites. Many companies that did mention their placement on the list did not have the information readily available in their sustainability report or in the sustainability section of their website.
5. Discussion
The results of this research have provided insights into the research question exploring the scoring range of the corporate website sustainability section, in terms of a) User Friendly, b) Transparency and c) Content and their placement on Corporate Responsibility Magazine’s 100 Best Corporate Citizens of 2012. The response rate for the survey tool that was developed for this research has shown that the use of a survey is not the best way to investigate a company’s marketing of sustainability. On the other hand, the analysis of the corporate websites has supported many of the conclusions made by Moreno and Capriotti concerning their research about company websites containing information on Corporate Social Responsibility (2006). In addition to supporting conclusions reached by previous research, the website scoring tool that was developed has proved to be valuable as a way of determining whether or not a company could be placed on a list assessing companies’ sustainability. Companies will be able to use this tool as a mean of assessing their marketing efforts through their scores on each of the questions. Automating the tool creates a scalable solution for companies and ranking agencies to see the state of the industry and generate benchmarks that can be used for monitoring and improving the industry sustainability efforts. Any company can use this tool to compare themselves against other companies in the area of sustainability. This website scoring tool will be especially useful to small companies that do not meet the qualifications to be considered for sustainability lists, such as CR’s 100 Best Corporate Citizens, because they are not a Russell 1000 company or lack some other such qualification (Corporate Responsibility Magazine, 2012). The score a small company receives by using this website analysis tool, would assist the company in determining how both the company’s sustainability and efforts to market its sustainability compare with those of companies on published sustainability lists.
Annex 1. Revised Ranking of CR’s 100 Best Corporate Citizens of 2012 Based on Website scoring Totals
New Ranking
Old
Rankings Company
New Ranking
Old
Rankings Company
1 16 McGraw-Hill Cos., Inc. 49 59 Colgate-Palmolive
2 21 Pepsico Inc. 50 69 Whirlpool Corp.
3 27 Mosaic Company 51 72 ITT Corporation
4 38 PG&E Corp. 52 75 Sonoco Products
5 93 Conagra Foods, Inc. 53 76 Oracle Corp.
6 1 Bristol-Myers Squibb Co. 54 96 Unitedhealth
7 25 Procter & Gamble Co. 55 4 Microsoft
9 41 Walt Disney Co. 57 28 3M Co.
10 42 Newmont Mining Corp. 58 47 EMC Corp.
11 44 General Mills, Inc.* 59 52 Carnival Corp.
12 45 Occidental Petroleum 60 54 Phillips-Van He.*
13 46 Merck & Co., Inc 61 61 TJX Companies
14 60 Weyerhaeuser Co. 62 63 Alcoa Inc.*
15 82 Wisconsin Energy Corp. 63 64 Target Corp
16 84 Dominion Resources Inc 64 86 Brown-Forman
17 97 Clorox Co. 65 87 Rockwell Auto.
18 7 Spectra Energy Corp 66 88 Kellogg Co
19 10 Freeport-McMoran. 67 92 Applied Materials
20 37 Dell Inc.* 68 5 Johnson Controls
21 50 Medtronic, Inc. 69 8 Campbell Soup
22 55 Hess Corporation* 70 18 Hormel Foods
23 70 Sempra Energy 71 39 Consolidated Edison, Inc.*
24 14 Coca-Cola Co 72 77 Motorola Solutions Inc.
25 31 Xerox Corp 73 83 State Street Corp.*
26 35 Duke Energy Corp.* 74 90 Tyson Foods, Inc.
27 49 Staples, Inc. 75 91 ConocoPhillips
28 56 JPMorgan Chase & Co. 76 3 Intel Corporation
29 57 Verizon Communications 77 22 Hasbro, Inc.
30 58 Baxter International Inc. 78 26 Hewlett-Packard Co. 31 62 Darden Restaurants, Inc. 79 34 Dow Chemical Co.
32 68 Lexmark International,Inc. 80 40 Chevron Corp
33 89 Cabot Corp. 81 51 Constellation Energy G.
34 94 ManpowerGroup* 82 53 Air Products & Chemicals
35 95 CVS Caremark Corp. 83 78 Baker Hughes Inc.
36 98 Best Buy Co. Inc. 84 80 Wells Fargo & Co.
35 95 CVS Caremark 85 85 Symantec Corp.
36 98 Best Buy Co. Inc. 86 100 Marriott Int’l, Inc.
37 99 CSX Corp. 87 36 Johnson & John.
38 2 IBM 88 67 Boeing Co.
39 9 Nike Inc. 89 71 Ford Motor Co.
40 15 Altria Group Inc. 90 48 United Parcel Service, Inc.
41 17 Eaton Corp. 91 6 Accenture plc
42 19 Abbott Lab 92 73 General Electric Co.
43 20 Int. Paper Co. 93 12 Mattel, Inc.
44 23 Starbucks Corp. 94 29 E.I. DuPont De Nemours &Co
45 24 Texas Instruments 95 81 Cummins Inc.
46 30 Northeast Utilities 96 66 Pinnacle West Ca.
47 33 Coca-Cola 97 79 Wyndham World.
References:
Arbex, N. (2012): Modernizing Sustainability Reporting– GRI, G4 and XBRL (GRI Reporting Webinar), “Guidance, Support and Innovations area” Abu Dabi, March 2012,
http://archive.xbrl.org/24th/sites/24thconference.xbrl.org/files/CAPM7ArbexXBRL_financial-market-symposium-march%202012.pdf.
Cobos, L.M., Wang Y., Okumus, F. (2009): Assessing The Web-Based Destination Marketing Activities: A Relationship Marketing Perspective. Journal of Hospitality Marketing and Management18.4:421-444 [Accessed 28 November 2012]
Crane, A. and Matten, D. (2010):Business Ethics. Oxford University, Oxford.
Mitchell, R.W., Wooliscroft, B. and Higham, J. (2010): Sustainable Market Orientation: A New Approach to Managing Marketing Strategy. Journal of Macromarketing30.2: 160-170.
Moreno, Á., Capriotti. P. (2006): La Comunicación De Las Empresas Españolas En Sus Webs Corporativas. Análisis De La Información De Responsabilidad Social, Ciudadanía Corporativa Y Desarrollo Sostenible (Spanish). Revista De Estudios De Comunicacion 11.21:49-64 [Accessed
28 November 2012]
S&P and RobecoSAM (2012): Dow Jones Sustainability Indexes. http://www.sustainability-index.com/index.jsp. [Accessed 5 December 2012]
Corporate Responsibility Magazine (2012): 100 Best Corporate Citizens List Methodology Procedure [Online], Philadelphia, PA. http://www.thecro.com/files/CR%20Corporate%20 Citizenship%20Protocol,%202012.pdf
The Newsweek / Daily Beast Company (2012): Green Rankings 2012: US. Companies. http://www.thedailybeast.com/newsweek/2012/10/22/newsweek-green-rankings-2012-u-s-500-list.html. [Accessed 5 December 2012]
Thorleuchter, D., van den Poel, D. (2012): Predicting E-Commerce Company Success By Mining The Text Of Its Publicly-Accessible Website. Expert Systems With Applications 39.17:13026-13034. doi:10.1016/j.eswa.2012.05.096. [Accessed 28 November 2012]
Tsai, W., Chou, W., and Leu, J. (2011): An Effectiveness Evaluation Model For The Web-Based Marketing Of The Airline Industry. Expert Systems With Applications 38.12:15499-15516. doi: 10.1016/j.eswa.2011.06.009. [Accessed 28 November 2012]
Van den Brink, T.W.M., van der Woerd, F. (2004): Industry Specific Sustainability Benchmarks: An ECSF Pilot Bridging Corporate Sustainability with Social Responsibility Investments.Journal of Business Ethics55:187-203. [Accessed 18 March 2012]
Veleva, V., Ellenbecker, M. (2000): A Proposal For Measuring Business Sustainability.Greener Management International31:101. [Accessed 28 November 2012]
Werbach, A. (2009): When Sustainability Means More Than Green. McKinsey Quarterly.
[Accessed March 2012]