(Orexin)
Makoto Honda1,2*, Krister S. Eriksson2, Shengwen Zhang2, Susumu Tanaka1, Ling Lin2, Ahmad Salehi3, Per Egil Hesla4, Jan Maehlen4, Stephanie E. Gaus2, Masashi Yanagisawa5, Takeshi Sakurai6, Shahrad Taheri7, Kuniaki Tsuchiya8, Yutaka Honda9, Emmanuel Mignot2,10*
1Sleep Disorder Research Project, Tokyo Institute of Psychiatry, Setagaya, Tokyo, Japan,2Center for Narcolepsy, Stanford University, Palo Alto, California, United States of America,3Department of Neurology, Stanford University, Palo Alto, California, United States of America,4Department of Pathology, Oslo University, Oslo, Norway, 5Molecular Genetics Department, University of Texas, Dallas, Texas, United States of America,6Department of Molecular Neuroscience and Integrative Physiology, Kanazawa University, Kanazawa, Japan,7Laboratories for Integrative Neurosciences and Endocrinology, Bristol University, Bristol, United Kingdom,8Tokyo Metropolitan Matsuzawa Hospital, Tokyo, Japan,9Japan Somnology Center, Neuropsychiatric Institute, Tokyo, Japan,10Howard Hughes Medical Institute, Stanford University, Palo Alto, California, United States of America
Abstract
Background:The sleep disorder narcolepsy is caused by a vast reduction in neurons producing the hypocretin (orexin) neuropeptides. Based on the tight association with HLA, narcolepsy is believed to result from an autoimmune attack, but the cause of hypocretin cell loss is still unknown. We performed gene expression profiling in the hypothalamus to identify novel genes dysregulated in narcolepsy, as these may be the target of autoimmune attack or modulate hypocretin gene expression.
Methodology/Principal Findings:We used microarrays to compare the transcriptome in the posterior hypothalamus of (1) narcoleptic versus control postmortem human brains and (2) transgenic mice lacking hypocretin neurons versus wild type mice. Hypocretin was the most downregulated gene in human narcolepsy brains. Among many additional candidates, only one, insulin-like growth factor binding protein 3 (IGFBP3), was downregulated in both human and mouse models and co-expressed in hypocretin neurons. Functional analysis indicated decreased hypocretin messenger RNA and peptide content, and increased sleep in transgenic mice overexpressing human IGFBP3, an effect possibly mediated through decreased hypocretin promotor activity in the presence of excessive IGFBP3. Although we found no IGFBP3 autoantibodies nor a genetic association with IGFBP3 polymorphisms in human narcolepsy, we found that an IGFBP3 polymorphism known to increase serum IGFBP3 levels was associated with lower CSF hypocretin-1 in normal individuals.
Conclusions/Significance:Comparison of the transcriptome in narcolepsy and narcolepsy model mouse brains revealed a novel dysregulated gene which colocalized in hypocretin cells. Functional analysis indicated that the identified IGFBP3 is a new regulator of hypocretin cell physiology that may be involved not only in the pathophysiology of narcolepsy, but also in the regulation of sleep in normal individuals, most notably during adolescence. Further studies are required to address the hypothesis that excessive IGFBP3 expression may initiate hypocretin cell death and cause narcolepsy.
Citation:Honda M, Eriksson KS, Zhang S, Tanaka S, Lin L, et al. (2009) IGFBP3 Colocalizes with and Regulates Hypocretin (Orexin). PLoS ONE 4(1): e4254. doi:10.1371/journal.pone.0004254
Editor:David C. Rubinsztein, University of Cambridge, United Kingdom
ReceivedSeptember 9, 2008;AcceptedNovember 21, 2008;PublishedJanuary 22, 2009
Copyright:ß2009 Honda et al. This is an open-access article distributed under the terms of the Creative Commons Attribution License, which permits unrestricted use, distribution, and reproduction in any medium, provided the original author and source are credited.
Funding:This work was supported by NIH-MH073435 to E. Mignot and by the Ministry of Education, Science, Sports and Culture, Grant-in-Aid for Scientific Research 19390310, 1739034 and Science Research on Priority Areas ‘‘Comprehensive Genomics’’ and in part by Uehara Memorial Foundation to M. Honda. E. Mignot (Investigator) is funded by the Howard Hughes Medical Institute.
Competing Interests:The authors have declared that no competing interests exist. * E-mail: honda@prit.go.jp (MH); mignot@stanford.edu (EM)
Introduction
Narcolepsy-cataplexy is a common sleep disorder affecting 0.02–0.16% of the general population in the United States, Europe and Asia. Disease onset may be insidious or abrupt, typically occurring around adolescence, and is characterized by excessive daytime sleepiness, cataplexy (sudden loss of muscle tone triggered by emotions) and other manifestations of abnormal Rapid Eye Movement (REM) sleep.
Narcolepsy has characteristic biological markers including Human Leukocyte Antigen (HLA) association and dysfunction of hypocretin (also called orexin) neurotransmission. Almost all
patients with narcolepsy-cataplexy share a common HLA allele,
DQB1*0602[1] suggesting an autoimmune basis for the disorder. Over 90% of narcolepsy-cataplexy cases are associated with a dramatic decrease in hypocretin-1 (HCRT1) in the cerebrospinal fluid [2].
suffi-cient to produce narcolepsy, as animal models with dysregulated HCRT transmission exhibit a narcolepsy-like phenotype [4,5]. Of notable interest is a transgenic mouse model where the HCRT
promoter drives a form of ataxin-3 containing a large polygluta-mine repeat, resulting in HCRT cell death and a narcolepsy-like phenotype at 2–3 weeks of age [6].
Human neuropathological studies have extended on these results.In situhybridization (ISH) studies have shown disappear-ance of HCRT mRNA in the perifornical area of narcoleptic brains. Furthermore, the concentrations of HCRT1 and HCRT2 in the cortex and pons, two areas with HCRT projections, are dramatically decreased [7]. Immunohistochemical studies also revealed more than 90% decrease in HCRT cell counts in the hypothalamus of narcoleptic subjects [8]. The loss of HCRT signal is most likely not a simple failure in producing hypocretin peptides alone. Hypocretin cells contain prodynorphin (PDYN) and neuronal pentraxin II (NPTX2; Neuronal Activity-Regulated Pentraxin) [9,10], and studies have shown that these two proteins are missing in the perifornical area, but not in other regions, of narcoleptic brains [11,12]. This could imply that HCRT producing cells are quiescent and do not produce HCRT, PDYN and NPTX2 or, more likely, that these cells are missing entirely. Some authors have noted residual gliosis in the perifornical region [13], which combined with the strong HLA association, favors the hypothesis of autoimmune mediated destruction of HCRT neurons. However, most attempts to prove the autoimmune hypothesis, for example through the detection of HCRT-cell specific autoantibodies, have been unsuccessful [14].
A deeper understanding of HCRT cell physiology is required, including the identification of genes and proteins that may be the target of an autoimmune attack or may modulate hypocretin expression/metabolism to make this cell population more susceptible to potential apoptosis. In this study, we have used postmortem human brain samples to compare the transcriptome of narcoleptic versus control subjects, with confirmation in animal models of narcolepsy. Our primary goal was to identify other
genes and associated proteins that may be dysregulated in the posterior hypothalamus of narcoleptic patients, potentially ex-pressed in HCRT neurons, as such genes are likely to be novel narcolepsy susceptibility genes.
Results
Identification of brain region specific transcripts
A total of 11 control and 6 narcolepsy brains were analyzed by microarray (Table 1). To validate our methods, we first compared transcript abundance across brain regions in control samples and identified brain region specific transcripts (Table S1). Of the 7 identified genes with putative preferential expression in the posterior hypothalamus, three are known to be restricted to this region: prepromelanin concentrating hormone, preprohypocretin, and histidine decarboxylase. Likewise, arginine vasopressin and oxytocin are expressed in the anterior hypothalamus. In the locus coeruleus (LC) where 14 genes were found to be region specific, seven, including dopamine-b-hydroxylase and tyrosine hydroxy-lase, are known to be expressed specifically in the LC. These results offered a strong validation of sample selection, dissection, array experiment procedure and the statistical analysis methods used in this study. (Table S1)
Identification of transcripts dysregulated in human narcolepsy
In the comparison of narcolepsyvscontrol posterior hypothal-ami, a total of 35 downregulated and 11 upregulated genes were identified by analysis of microarray expression data. Of these, only nine genes were confirmed by Quantitative Reverse Transcrip-tase-Polymerase Chain Reaction (QRT-PCR), all of which were downregulated in narcolepsy. Hypocretin was the most signifi-cantly decreased gene by Significance Analysis of Microarray (SAM) [15] ranking, and was second in terms of mean fold change. QRT-PCR confirmation indicated a dramatic 57.4 fold decrease
Table 1.Demographic and RNA quality data of human brain tissue used for analysis.
ID cause of death age sex PMI (h) brain pH 28S/18S DQB1 DQB1
C1 not available 77 F 6.0 6.76 0.62 0302 0502
C2 colon cancer 61 M 48.0 6.93 0.9 0301 0301
C5 prostate cancer 77 M 48.0 6.72 0.52 0201 0604
C7 cerebellum cancer meningitis 74 M 4.5 6.62 0.86 0301 0501
C8 kindey cancer; metabolic encephalopathy 75 F 8.0 6.74 0.77 0201 0303
C10 breast cancer 48 F 12.5 6.64 0.64 0503 0603
C12 chronic obstructive pulmonary disease 82 M 5.0 6.78 0.88 0602 0201
C13 dementia 92 M 7.0 6.91 0.65 0602 0602
C14 heart failure 90 M 6.0 6.6 0.53 0602 0602
C15 heart failure 61 F 8.2 6.66 0.5 0602 0301
C16 not available 77 M 2.0 6.63 0.54 0201 0301
N4 not available n/a F n/a 6.63 0.95 0602 0201
N5 lung cancer 68 F 2.5 6.76 1.48 0602 0603
N6 dementia 58 F 42.0 6.55 0.87 0602 0602
N7 dementia 89 F 20.0 6.53 1.12 0602 0201
N8 not available 60 M 3.5 6.7 1.21 0602 0303
N101 epidural hemmorage 69 M 10.5 6.75 0.76 0602 0502
in preprohypocretin transcript abundance, identifying the known central feature of narcolepsy. The eight other confirmed candidates, leiomodin 1 (LMOD1), cold shock domain protein A (CSDA), G protein-coupled receptor 4 (GPR4), endothelin 1 (EDN1), neuropeptide Y (NPY), growth arrest and DNA-damage-inducible, beta (GADD45B), interleukin 1 recptor-like 1 (IL1RL1) and insulin-like growth factor binding protein 3 (IGFBP3) were downregulated 1.6 to 6.1 fold (Table 2).
Previously known HCRT co-expressed genes were not reported in our analysis either because they were not listed within the top 100 SAM ranked candidates (NPTX2, GAL(galanin), and CART
(cocaine and amphetamine regulated transcript), or expression was classified as ‘‘absent’’ (PDYN) using the microarray suite software (MAS) 5.0 algorithm. The array signals for these genes were decreased (PDYN: 2.4 fold, p = 0.005;NPTX2: 1.3 fold, p = 0.5;
GAL: 2.3 fold, p = 0.06; CART: 1.2 fold, p = 0.36) as were the QRT-PCR comparisons (PDYN: 1.8 fold, p = 0.03; NPTX2: 1.6 fold, p = 0.07;GAL: 1.9 fold, p = 0.09;CART: 1.3 fold, p = 0.24). These results further validated our method.
IGFBP3 is co-localized in hypocretin producing cells in mouse brains
In situhybridization (ISH) of all human putative downregulated genes was performed in mice (C57/BL/6J) (Table 2). Of the 8 candidates confirmed by QRT-PCR as downregulated in narcolepsy brains, only one gene, Insulin-like Growth Factor Binding Protein-3 (Igfbp 3), was clearly enriched in the perifornical region where HCRT neurons are located (Table 2, Fig. 1). Among the other genes, many did not appear to be expressed at all in the studied brain regions or the expression was restricted to regions other than the perifornical area (Table 2).
To determine if IGFPB3 is selectively expressed by HCRT neurons in the perifornical area, we usedHcrt-ataxin-3 hemizygous (HZ) transgenic [6], andHcrtknock-out (KO) mice [4]. When we performed ISH with35S-probes and exposed X-ray film to these slides, signal in the perifornical area was visible after 4 day exposure in the littermate wild type (WT) mice, whereas this region remained invisible after 40 days of exposure in ataxin-3 mice (Fig. 1). Loss of HCRT peptide in ataxin-3 mice could potentially induce secondary changes in gene expression in neighboring cells. Therefore we studiedHcrtKO mice and found that Igfbp3 expression was similar to that of WT mice (Fig. 1) indicating that loss of HCRT peptide itself did not induce changes inIgfbp3expression.
To investigate coexpression of HCRT andIgfbp3, we performed
Igfbp3ISH followed by HCRT immunostaining. Colocalization of both signals was seen in a majority (,80%) of hypocretin neurons (Fig. 1). Using this technique, we also surveyedIgfbp3expression throughout the mouse brain. Significant Igfbp3 expression was restricted to a few brain areas including posterior hypothalamus, cerebellar Purkinje neurons, and a group of cells in the pons localized in or close to the pedunculopontine nucleus. Weaker signal was also seen in the ventromedial hypothalamus, granular and pyramidal layers of the hippocampus, and endopiriform nucleus. Expression in all regions other than posterior hypotha-lamic area was unaffected in the Hcrt-ataxin-3 hemizygous (HZ) mice.
IGFBP3 is localized in human hypocretin producing cells
IGFBP3 immunoreactivity was surveyed using various antibod-ies (after screening selectivity by western blot) through an entire human hypothalamic block. Blood vessels gave strong signal with IGFBP3 antibody, possibly due to residual blood which has very high IGFBP3 content. Other cells, mostly of non-neuronal origin
and negative for the NeuN neuronal marker were also stained. Cellular IGFBP3 staining of NeuN positive large neurons was only noted in the perifornical area. IGFBP3 and HCRT double immunostaining detected colocalization in 10–20% of HCRT neurons in the perifornical area (Fig. 2). All neurons showing colocalization of IGFBP3 and HCRT appeared to have a reduced hypocretin signal. Double-stained fibers were also observed in multiple other hypothalamic areas. This colocalization was also seen in some of the few remaining HCRT neurons in brains from narcolepsy patients.
Identification of transcripts downregulated in the hypocretin-ataxin-3 hemizygous transgenic mouse model
Gene expression in perifornical posterior hypothalamus was compared inHcrt-ataxin-3 transgenic mice lacking most hypocre-tin neurons versus wild type animals (two pools of 30 mice). Transcripts with the highest fold changes are reported in Table 3. Genes with known colocalization, such as NPTX2 and dynorphin, were downregulated, validating the model. Other transcripts were also found (Table 3), only one of which, IGFBP3, was downregulated in human narcolepsy hypothalami. For this reason, functional studies involving IGFBP3 and hypocretin were next carried out.
Evaluation of IGFBP3 levels, genotype, and IGFBP3 antibodies in blood and CSF of narcoleptic patients
We investigated whether human narcolepsy is associated with dysregulated IGFBP3 levels in the blood and CSF. Mean levels of IGFBP3 in age and sex matched narcolepsy patients (all with low CSF hypocretin-1) versus controls were 59.463.4 ng/ml (n = 11) and 58.064.5 (n = 11) ng/ml in serum and 31.262.1 ng/ml (n = 27) and 29.061.9 ng/ml (n = 35) in CSF respectively. As previously reported [16], levels of IGFBP3 correlated with age but not sex in adults. After controlling for these factors, there was no significant difference in age of onset.
A single base polymorphism in theIGFBP3promoter region (rs 2854744) strongly correlates with plasma IGFBP3 [17] levels. We tested whether this IGFBP3 polymorphism is associated with human narcolepsy-cataplexy by testing 130 trios using the transmission disequilibrium test (TDT). No difference in trans-mission was observed (53.5% versus 46.5% for the A allele; Chi sq = 0.77, p = 0.38).
We also explored the possibility that autoantibodies directed against IGFBP3 could be identified. We expressed human IGFBP3 in COS cells, and extracted proteins were western blotted. The resulting membrane was incubated with sera from 22 human narcoleptic and 20 control subjects and revealed with anti human IgG. None of the patients (some with disease onset less than a year prior to blood sampling) or controls had specific reactivity to expressed IGFBP3.
IGFBP3 inhibits hypocretin productionin vivo
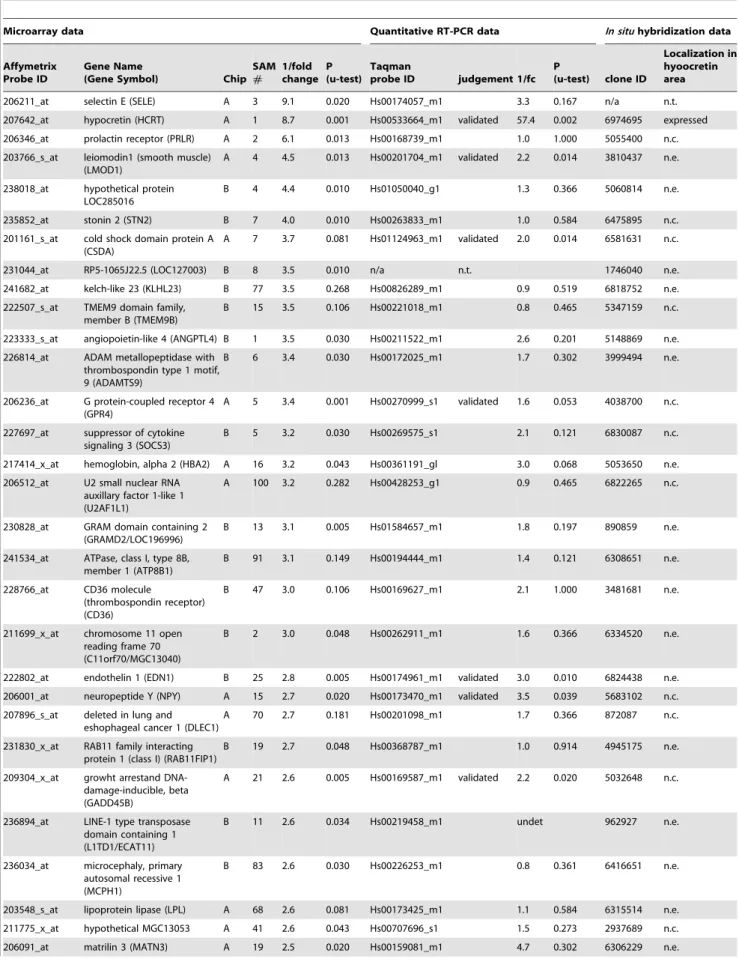
Table 2.Human narcolepsy susceptibility candidate genes analyzed by microarray, quantitative RT-PCR and distribution shown by in situhybridization in mice.
Microarray data Quantitative RT-PCR data In situhybridization data
Affymetrix Probe ID
Gene Name
(Gene Symbol) Chip SAM
#
1/fold change
P (u-test)
Taqman
probe ID judgement 1/fc P
(u-test) clone ID
Localization in hyoocretin area
206211_at selectin E (SELE) A 3 9.1 0.020 Hs00174057_m1 3.3 0.167 n/a n.t. 207642_at hypocretin (HCRT) A 1 8.7 0.001 Hs00533664_m1 validated 57.4 0.002 6974695 expressed 206346_at prolactin receptor (PRLR) A 2 6.1 0.013 Hs00168739_m1 1.0 1.000 5055400 n.c. 203766_s_at leiomodin1 (smooth muscle)
(LMOD1)
A 4 4.5 0.013 Hs00201704_m1 validated 2.2 0.014 3810437 n.e.
238018_at hypothetical protein LOC285016
B 4 4.4 0.010 Hs01050040_g1 1.3 0.366 5060814 n.e.
235852_at stonin 2 (STN2) B 7 4.0 0.010 Hs00263833_m1 1.0 0.584 6475895 n.c. 201161_s_at cold shock domain protein A
(CSDA)
A 7 3.7 0.081 Hs01124963_m1 validated 2.0 0.014 6581631 n.c.
231044_at RP5-1065J22.5 (LOC127003) B 8 3.5 0.010 n/a n.t. 1746040 n.e. 241682_at kelch-like 23 (KLHL23) B 77 3.5 0.268 Hs00826289_m1 0.9 0.519 6818752 n.e. 222507_s_at TMEM9 domain family,
member B (TMEM9B)
B 15 3.5 0.106 Hs00221018_m1 0.8 0.465 5347159 n.c.
223333_s_at angiopoietin-like 4 (ANGPTL4) B 1 3.5 0.030 Hs00211522_m1 2.6 0.201 5148869 n.e. 226814_at ADAM metallopeptidase with
thrombospondin type 1 motif, 9 (ADAMTS9)
B 6 3.4 0.030 Hs00172025_m1 1.7 0.302 3999494 n.e.
206236_at G protein-coupled receptor 4 (GPR4)
A 5 3.4 0.001 Hs00270999_s1 validated 1.6 0.053 4038700 n.c.
227697_at suppressor of cytokine signaling 3 (SOCS3)
B 5 3.2 0.030 Hs00269575_s1 2.1 0.121 6830087 n.c.
217414_x_at hemoglobin, alpha 2 (HBA2) A 16 3.2 0.043 Hs00361191_gl 3.0 0.068 5053650 n.e. 206512_at U2 small nuclear RNA
auxillary factor 1-like 1 (U2AF1L1)
A 100 3.2 0.282 Hs00428253_g1 0.9 0.465 6822265 n.c.
230828_at GRAM domain containing 2 (GRAMD2/LOC196996)
B 13 3.1 0.005 Hs01584657_m1 1.8 0.197 890859 n.e.
241534_at ATPase, class I, type 8B, member 1 (ATP8B1)
B 91 3.1 0.149 Hs00194444_m1 1.4 0.121 6308651 n.e.
228766_at CD36 molecule
(thrombospondin receptor) (CD36)
B 47 3.0 0.106 Hs00169627_m1 2.1 1.000 3481681 n.e.
211699_x_at chromosome 11 open reading frame 70 (C11orf70/MGC13040)
B 2 3.0 0.048 Hs00262911_m1 1.6 0.366 6334520 n.e.
222802_at endothelin 1 (EDN1) B 25 2.8 0.005 Hs00174961_m1 validated 3.0 0.010 6824438 n.e. 206001_at neuropeptide Y (NPY) A 15 2.7 0.020 Hs00173470_m1 validated 3.5 0.039 5683102 n.c. 207896_s_at deleted in lung and
eshophageal cancer 1 (DLEC1)
A 70 2.7 0.181 Hs00201098_m1 1.7 0.366 872087 n.c.
231830_x_at RAB11 family interacting protein 1 (class I) (RAB11FIP1)
B 19 2.7 0.048 Hs00368787_m1 1.0 0.914 4945175 n.e.
209304_x_at growht arrestand DNA-damage-inducible, beta (GADD45B)
A 21 2.6 0.005 Hs00169587_m1 validated 2.2 0.020 5032648 n.c.
236894_at LINE-1 type transposase domain containing 1 (L1TD1/ECAT11)
B 11 2.6 0.034 Hs00219458_m1 undet 962927 n.e.
236034_at microcephaly, primary autosomal recessive 1 (MCPH1)
B 83 2.6 0.030 Hs00226253_m1 0.8 0.361 6416651 n.e.
IGFBP3 is overexpressed approximately twice in hIGFBP3
transgenic animals and 10 times in hmutIGFBP3 transgenic animals, but is absent in IGFBP3 knockout animals (data not shown), validating these models. Immunocytochemistry did not reveal hypocretin cell defects nor decrease in cell number inIgfbp3
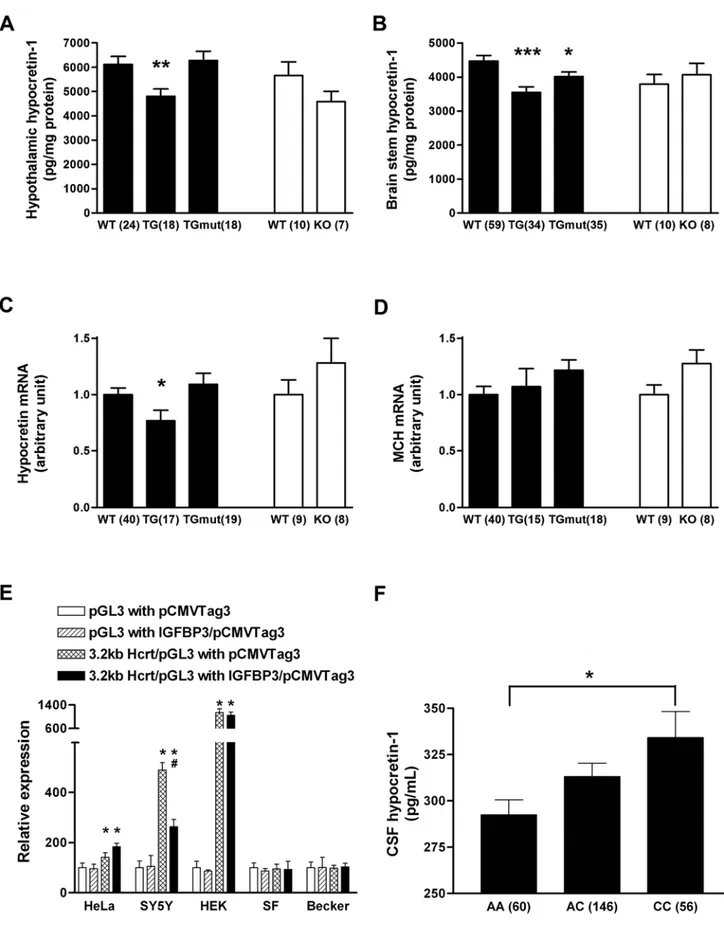
knockout or transgenic animals (data not shown). We next measured hypocretin-1 peptide content and hypothalamic pre-prohypocretin expression (Fig. 3A–C) and found that
preprohy-pocretin mRNA expression was significantly decreased inhIGFBP3
transgenic animals compared to controls, but unaltered in the other models (including hmutIGFBP3 transgenic and Igfbp3 KO mice)(Fig 3A, C). Hypocretin-1 peptide contents were significantly decreased primarily in hIGFBP3 transgenic and less so in
humtIGFBP3 transgenic mice compared to controls, indicating both IGF dependent and less prominently independent properties of IGFBP3 affect hypocretin production (Fig 3B). Hypocretin cell
Microarray data Quantitative RT-PCR data In situhybridization data
Affymetrix Probe ID
Gene Name
(Gene Symbol) Chip SAM
#
1/fold change
P (u-test)
Taqman
probe ID judgement 1/fc P
(u-test) clone ID
Localization in hyoocretin area
239151_at hypothetical protein LOC255326
B 41 2.5 0.015 n/a n.t. n/a n.t.
212143_s_at insulin-like growth factor binding protein 3 (IGFBP3)
A 11 2.5 0.001 Hs00181211_m1 validated 2.0 0.010 6437611 expressed
207526_s_at interleukin 1 receptor-like 1 (IL1RL1)
A 40 2.5 0.081 Hs00545033_m1 validated 6.1 0.028 MGC 30073421
n.e.
218775_s_at WW, C2 and coiled-coil domain containing 2 (WWC2/BOMB)
A 65 2.5 0.181 Hs00227904_m1 1.2 0.273 5142576 n.c.
231728_at calcyphosine (CAPS) B 65 2.5 0.268 Hs00362033_g1 1.1 1.000 not expr. in rodents
n.t.
n.t.; not tested, n.e.; no expression, n.c.; no coexpression in perifornical hypocretin area.
probe set ID is from aAffymetrix, QRT-PCR probe ID is from Applied Biosystems, and All clones for in situ hybridization are IMAGE clones except where noted. Gene expression was compared between 6 narcolepsy and 8 control postmortem posterior hyptothalami (A and B Genechip). Narcolepsy candidate genes selected by statistical analysis of microarray data are listed at left, quantitative RT-PCR results are in the center, and results ofin situhybridization in mouse hypothalamus are at the right. As only downregulated genes were confirmed by RT-PCR studies, upregulated candidates are not shown. Genes labeled with ‘‘validated’’ were confirmed as narcolepsy related genes. Note thatIGFBP3is the only gene validated by QRT-PCR and showing a hypocretin-like distribution pattern. Some candidates showed uniform signal over the whole brain section, potentially indicating ubiquitous expression, but we regarded the staining as background and classified the gene as not expressed if no anatomical variation in staining level was observed.
doi:10.1371/journal.pone.0004254.t002
Table 2.cont.
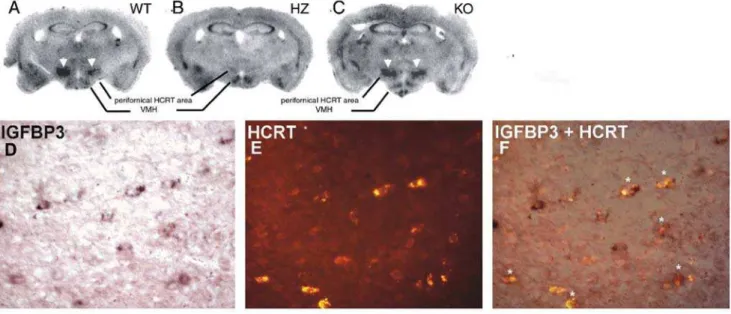
Figure 1. IGFBP3 signals in wild type, ataxin-3 hemizygous, and hypocretin KO mice.The upper panel shows IGFBP3 ISH staining in wild type (A: WT), ataxin-3 hemizygous (B:HZ) and HCRT knockout (C: KO) mice. HCRT staining in neurons (arrowheads) is markedly reduced or absent in the ataxin-3 mouse. The lower panel shows IGFPB3 ISH signal (D: purple; digoxigenin staining with BCIP/NBT), HCRT fluorescence (E: red; Alexa Fluor) immunostaining, and a composite picture (F), indicating that many hypocretin neurons (asterisks) are positive for IGFBP3 in a WT mouse. Scale bar 20mm.
counts were nonetheless normal in thehIGFBP3transgenic model (3269699 in HZ versus32306140 in WT, n = 4 each, age 8 weeks, mean6SEM). As a control, Melanin Concentrating Hormone (MCH) expression was also studied and found to be unaffected byhIGFBP3overexpression orIgfbp3absence (Fig. 3D).
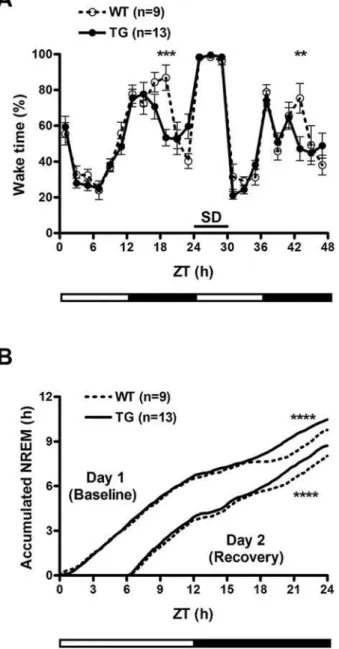
IGFBP3 overexpression increases sleep at the end of the active period
To assess whether IGFBP3 overexpression could modulate cell death,hIGFBP3transgenic mice were crossed with Hcrt-ataxin-3 transgenic mice known to develop hypocretin cell loss at 3–6 weeks of age. Hypocretin cell counts were carried out at 8 weeks of age, and no effect of the hIGFBP3 transgene was noted (595636 in double HZ (hemizygous) versus 610667 inHcrt-ataxin-3/hIGFBP3
HZ/WT, n = 5 each). We next characterized whether overex-pression of IGFBP3 and resulting effects on hypocretin transmis-sion affect sleep and wakefulness by conducting sleep studies on
hIGFBP3 transgenic mice and their littermates. Although no overall significant difference in sleep amounts were observed (Table S2), we found that these animals exhibit more sleep at the end of the dark period. Sleep deprivation was also performed, and revealed a very similar recovery profile, although more sleep was again observed in transgenic animals prior to light onset (Fig. 4). Sleep studies were not performed onmIgfbp3KO mice considering the absence of significant differences in Hypocretin mRNA and peptide content in these animals (Fig. 3).
IGFBP3 reduces promotor activity of hypocretin in neural cell lines
As IGFBP3 is known to have modulatory effects on transcrip-tion, for example through its binding to nur 77 [21], a possible explanation for IGFBP3 effects on sleep could be transcriptional
modulation of the preprohypocretin gene. To test this hypothesis, prepro-hypocretin promotor activity was examined in several cell lines of various origins in the presence of a transfected IGFBP3 construct (Fig. 3E). We found that IGFBP3 reduced promotor activity of preprohypocretinin vitro. This effect was only observed in the neural (neuroblastoma-derived) cell line SH-SY5Y, suggesting the need for neural-specific cofactors.
An IGFBP3 polymorphism known to increase IGFBP3 serum levels is associated with reduced CSF hypocretin levels
To test whether IGFBP3 activity regulates hypocretin levelsin vivo, DNA samples of 262 Caucasian subjects with normal CSF hypocretin-1 levels (.200 pg/ml), either drawn from healthy control subjects or from subjects with a complaint of sleepiness unexplained by hypocretin deficiency, were typed for rs2854744 (2202A/C IGFBP3 promoter polymorphism). As previously reported, no relationship between sleepiness/disease status, age or sex and hypocretin levels were found. Interestingly however, a significant dose dependent increase in hypocretin-1 level was found with increasing doses of rs2854744 C, the allele associated with decreased IGFBP3 levels (Fig. 3F). These results suggest that this IGFBP3 polymorphism modulates hypocretin productionin vivoin humans.
Discussion
Gene expression profiling in postmortem human brain samples using microarrays is a difficult and controversial area [22]. To validate our technique, we compared transcript abundance in regions known to contain specific neurotransmitters of importance in sleep regulation. After filtering out genes with inconsistent expression, a combination of a permutation method (SAM) and
Figure 2. Colocalization of IGFBP3 in HCRT cells in control and narcolepsy human brain.Upper panel: Distribution of hypocretin cells and fibers in the perifornical area of human hypothalamus. (A) In control brains, HCRT cells and fibers were densely stained by an anti-HCRT monoclonal antibody (red fluorescence: VectorRed), while in narcolepsy brains, staining was markedly reduced (B) Lower panel: HCRT immunoreactivity (C: red fluorescence) and IGFBP3 immunoreactivity (D: green fluorescene; Q-dot525) and a composite picture (E) arrows indicate HCRT cells colocalized with IGFBP3). Note non-neuronal autofluorescent elements. Scale bar: 500mm in A and B, 100mm in C, D and E.
descriptive quantitative ranking of fold changes was found to be the most appropriate statistical analysis. The anterior and posterior hypothalami are known to promote sleep and wake respectively. The LC area was selected as a prototypical HCRT receptor-1 bearing adrenergic cell group, while the diagonal band
was selected as an HCRT receptor-2 rich area containing cholinergic neurons.
The comparison of regions showed a remarkably high expression of genes characteristic for these regions (Table S1). In the LC, for example, enriched genes included the presynaptically
Table 3.Mouse transcripts most differentially dysregulated in the perifornical area of ataxin-3 transgenic animals versus control mice.
Affymetrix Probe ID Gene name (Gene symbol) Chip 1/Fold change
Decreased in Hz
448821_at Tyrosinase (Tyr) A 34.3
452022_at BAALC isoform 1-6-8 (Baalc) A 27.9
422411_s_at Eosinophil-associated ribonuclease 3 (Ear3) A 16.0
418353_at CD5 antigen (Cd5) A 9.2
416128_at Tubulin, alpha 6 (Tuba6) A 9.2
426003_at Neurotrophin-3 receptor non-catalytic isoform 1 (trkC) A 8.6 451014_at Receptor tyrosine kinase-like orphan receptor 1 (Ror1) A 8.0 450772_at Wingless-related MMTV integration site 11 (Wnt11) A 7.5
416266_at Prodynorphin (Pdyn) A 5.7
418035_a_at DNA primase, p58 subunit (Prim2) A 5.3
420471_at Hypocretin (Hcrt) A 5.3
439199_at Protein phosphatase 2a, catalytic subunit, alpha isoform (Ppp2ca) A 5.3
437618_x_at G protein-coupled receptor 85 (Gpr85) A 4.9
421767_at Adenosine kinase (Adk) A 4.6
450091_at Immunoglobulin mu binding protein 2 (Ighmbp2) A 4.0
427168_a_at Collagen type XIV (Col14a1) A 4.0
437502_x_at CD24a antigen (Cd24a) A 3.7
432129_a_at Paired related homeobox 1 (Prrx1) A 3.7
450315_at Pheromone receptor V3R8 (V3R8) A 3.5
455639_at Rap2 interacting protein (Rap2ip) A 3.5
423062_at Insulin-like growth factor binding protein 3 (Igfbp3) A 3.2
435950_at Periplakin (Ppl) A 3.2
421516_at Orphan receptor RTR (Nr6a1) A 3.2
419628_at Ceh-10 homeo domain containing homolog (Ch610) A 3.0 450533_a_at Zinc finger protein regulator of apoptosis and cell cycle arrest (Zac1) A 3.0
427835_at Transcription factor Oct-1 isoform 7 (Pou2f1) A 2.8
423026_at Rad51 homolog c (Rad51c) A 2.8
425175_at Gliacolin (C1ql3) A 2.8
425886_at ETS-domain transcription factor (Fev) A 2.6
418494_at Early B-cell factor 2 (Ebf2) A 2.6
426180_a_at MSG2alpha salivary protein (Vcs2) A 2.6
452380_at Ephrin receptor A7 (Epha7) A 2.6
419221_a_at Regulator of G-protein signaling 14 (Rgs14) A 2.5
449960_at Neuronal pentraxin 2 (Nptx2) A 2.5
421109_at Camello-like 2 (Cml2) A 2.5
460354_a_at Mitochondrial ribosomal protein L13 (L13mt) A 2.5
427832_at Testicular alpha tubulin (Tuba-rs1) A 2.5
Increased in Hz
418162_at Toll-like receptor 4 (Tlr4) A 19.7
The perifornical area of 30 wild type and 30 ataxin-3 transgenic mice lacking hypocretin cells were punched (see Fig. S1) and samples pooled to perform microarray experiments.Hcrt-ataxin-3 transgenic mouse dysregulated genes are listed by order of transcript abundance (fold change). Most transcripts were decreased inHcrt -ataxin-3 mice, some of which are known to be colocalized with hypocretin (NPTX2, dynorphin). Note that IGFBP3, which was identified by expression profiling using human hypothalami, was also decreased in this experiment.
locateda2A- receptors and adrenergic transporters, catecholamine
synthesizing enzymes (tyrosine hydroxylase, DOPA decarboxylase and dopamine-b-hydroxylase) and the transcription factors
PHOX2A and PHOX2Bwhich are involved in the development of this nucleus [23]. Additional work is indicated to validate and study these genes, as they are potentially important in the
neurobiology of these regions. It is notable that our study compared only four regions but was sufficient to effectively identify a large number of region-specific genes.
These promising results led us to compare narcolepsy and control posterior hypothalamus, the primary site of the biochem-ical defect in narcolepsy (Table 2). In this comparison we used slightly less stringent criteria with inclusion of the top 100 SAM dysregulated genes followed by QRT-PCR validation using the same brain sample sets. No genes were confirmed to be upregulated, whereas 9 of 35 candidates were confirmed as downregulated in the posterior hypothalamus of narcolepsy patients. As expected, preprohypocretin was the top candidate in this analysis, displaying a 9-fold change in expression through the array comparison and a more than 50 fold change when verified by RT-PCR (Table 2). This striking result suggests that if this precise neuroanatomical region had been targeted, it would have been possible to discover the central feature of narcolepsy -HCRT deficiency- without a preconceived hypothesis. A recent micro-array analysis in Parkinson’s disease also yielded excellent results after careful dissection of the substantia nigra [24]. Our work thus validates the use of postmortem samples for finding the cause of certain neuropsychiatric disorders, a nascent field, provided that careful selection of neuroanatomical regions is performed, as in these studies.
The posterior hypothalamic candidates were also subjected to neuroanatomical screening in mouse brain. The primary goal of this analysis was to identify genes that are coexpressed with HCRT and therefore lost in narcoleptic brains in association with death of these cells. Very few such candidates are currently known, and none is specific for HCRT neurons. Known coexpressed genes in various species includeNTPX2,GAL,PDYN,ENTPD3 (extonucleo-side triphosphate diphosphohydrolase 3) and CART. These transcripts were not identified in our human array analysis as they either were expressed in other areas of the brain, leading to a low SAM ranking (NPTX2,GAL,CART) or because the expression was classified as absent in most samples (PDYN, ENTPD3), although the QRT-PCR analysis indicated moderately decreased expression of these genes in narcolepsy (see results).
A combination of QRT-PCR confirmation in human hypo-thalamus and neuroanatomical screening in the mouse brain identified a single factor,IGFBP3that is coexpressed withHCRT
in both humans and mice and present in only a few other brain areas. Confirmation of the colocalization was performed using multiple techniques in both mouse (Fig. 1) and human (Fig. 2). A combination of ISH and immunostaining showedIgfbp3 expres-sion in a majority (,80%) of HCRT neurons in mice. One of the most striking findings was the observation that Igfbp3 signal decreased dramatically in the perifornical hypocretin cell region of
Hcrt-ataxin-3 transgenic mouse lacking most hypocretin producing cells.
Although the other 7 QRT-PCR confirmed genes in the human study were not found to be expressed in HCRT neurons, additional work will be needed to explore the importance of these genes in the pathophysiology of narcolepsy. In some cases, expression was not detected byin situ hybridization in mice but may still be present at low levels. Further, hypocretin cell loss in narcolepsy might be triggered by yet unknown changes in surrounding cells or structures. These factors would not be identified in animal models with disrupted hypocretin
neurotrans-production, is dose dependently associated with increased CSF hypocretin-1 levels. A, B: *: p,0.05; **, p,0.01; ***:p,0.001; C: *: p,0.001 versus without 3.2 kb promotor activity,#:p,0.001 versus promotor activity without IGFBP3; F: *: p,0.05 using ANOVA with genotype as a grouping factor. Sample numbers were indicated in parentheses.
doi:10.1371/journal.pone.0004254.g003
mission but would be downregulated in human brains. In this respect,IL1RL1may be of special interest as we found a 6.1 fold difference by QRT-PCR, and this orphan receptor has a role in immune regulation [25]. The other downregulated genes that were found, or previously known to express elsewhere (eg NPY,
GPR4), may reflect physiologically important network remodeling in narcolepsy.
Double immunostaining also revealed additional IGFBP3 immunoreactive, hypocretin negative cells in human hypothala-mus (both neurons and glial cells). The IGFBP3 protein is primarily produced and secreted by the liver and is the major carrier of insulin-like growth factors 1 and 2 (IGF1, IGF2) in the blood. The resulting IGFBP3-IGF complex is typically taken up by cells through IGF receptor 1 to produce intracellular effects [26]. In this context, uptake of IGFBP3 by brain cells could render them immunoreactive without accompanying gene expression. We found that CSF levels of IGFBP3 were high, suggesting significant translocation from serum into brain extracellular fluid. Other explanations could involve antibody specificity issues and relative differences in abundance between protein and mRNA in different cells. Induction ofIGFBP3 expression can occur in neurons and glial cells under various conditions, for example hypoxia [27], and this might also cause differences between humans and mice.
What function could IGFBP3 have in hypocretin producing cells with regard to narcolepsy? As the protein is co-localized with HCRT, IGFBP3 could have been an autoantigen involved in the hypothesized autoimmune attack directed against the HCRT neurons. We found no evidence for such autoantibodies in human sera and CSF, however. IGFBP3 levels were similar in CSF and serum of narcolepsy versus controls, and it is abundant in various human brain cells, possibly reflecting cellular uptake of circulating IGFBP3. These make it an unlikely candidate in directing an autoimmune process specifically toward HCRT neurons.
Even if not directly involved as an autoantigen in causing narcolepsy, IGFBP3 is still an interesting candidate as it plays key roles in regulating cell proliferation and apoptosis [28]. The interaction of IGFBP3 with IGFs is generally believed to have primarily pro-growth effects by favoring target availability of IGF, but growth-inhibiting effects have also been noted. IGFBP3 is also reported to have proapoptotic properties independent of IGF-binding. For example, IGFBP3 expression in cancer cells and in the circulation is associated with less malignant growth and decreased cancer risk in breast [29], prostate [30] and other cancers [31]. Of note, the proapoptotic effects commence with IGFBP3 translocation into the nucleus and binding of the retinoid-X-receptor-a(RXRa), with subsequent mobilization of the RXRa binding partner Nur77 from the nucleus to mitochondria, an event followed by caspase activation and apoptosis [21]. We found no intranuclear IGFBP3 staining in human hypocretin cells (Fig 2 D,E), suggesting no proapoptotic effects in surviving hypocretin cells.
Recently however, proapoptotic effects of IGFBP3 independent of nuclear translocation and protein secretion have been demonstrated, suggesting additional cytoplasmic pathways also promote apoptosis [30]. It is thus possible that IGFBP3 produced within hypocretin cells would not be bound to IGFs, potentially increasing vulnerability to proapoptotic processes. Indeed, hypo-cretin neurons in slice cultures are more sensitive than neighboring cells to NMDA receptor-mediated injury [32]. To test the hypothesis that excessive IGFBP3 in hypocretin cells contributes to this cell death, we crossed Hcrt-ataxin-3 transgenic mice (animals with targeted cell death 2–4 weeks after birth) with transgenic mice overexpressing human IGFBP3 (hIGFBP3), but found no effects on the speed of hypocretin cell death. The lack of
effects of IGFBP3 on cell death in this model might be due to the differences in circulating vs hypocretin cell specific IGFBP3 overexpression, or to lack of an IGFBP3 effect in the context of ataxin-induced cell degeneration, but is consistent with the notion that IGFBP3 may be proapoptotic only in specific circumstances, such as cancerous cells.
The results above do not support the involvement of IGFBP3 in causing hypocretin cell death in narcolepsy. We therefore next explored whether IGFBP3 modulates hypocretin transmission, with complementary in vitro and in vivo functional studies using
hIGFBP3 transgenic mice. We found that increased IGFBP3 decreases both hypocretin mRNA, and hypocretin peptide content in hypothalamus and target areas (Fig. 3A–C). Although these effects could be indirectly mediated by minor endocrine abnormalities in these animals, for example hyperglycemia [33], the in vitro findings that IGFBP3 expression suppresses HCRT
promotor activity (Fig. 3E) and that the functional IGFBP3 polymorphism rs2854744 is associated with reduced hypocretin transmission, observed as lower levels of Hcrt-1 in human CSF (Fig. 3F), makes this hypothesis unlikely. Overexpression of
hmutIGFBP3, a mutant form that does not bind IGF, also reduces hypocretin peptide content in brainstem but not in hypothalamus suggesting both IGF dependent and independent effects on hypocretin transmission. Hypocretin transmission was normal in
Igfbp3knockout mice, potentially reflecting functional redundancy among the 7 known IGFBP family members.
Increased IGFBP3 expression (which was stable across the 24 hrs) was shown to have functional effects on sleep, ashIGFBP3
transgenic mice slept significantly more prior to light onset. It is notable that the effect was primarily observed at the end of the active period. As hypocretin release is highest at this time of the day (equivalent to the evening in humans), higher IGFBP3 levels may affect hypocretin transmission only at times of highest demand, through the reduction of releasable peptide stores in terminals.
IGFBP3 and IGF serum levels are highest around puberty, and drop thereafter [16,34]. It is thus interesting to speculate that increased sleepiness during puberty could coincide with peak IGFBP3 levels. Most work to date has focused on the studies of Growth Hormone, the primary determinant of IGF, while the effects of IGF on sleep seem complex [35,36]. Additional investigations of the chronic effects of IGFs and IGFBP3 on sleep changes around puberty are needed [34]. IGFBP3, together with IGF, is to be added to the growing list of metabolic indicators that have been reported to regulate hypocretin activity.
In summary, this study exemplifies the successful use of human postmortem brain for microarray analysis of human neuropathol-ogy. The analysis not only confirmed known genes colocalized with hypocretin cells but also identified a new candidate with functional relevance to hypocretin cell physiology and sleep regulation. This factor, IGFBP3, is only expressed at high levels in a few neuronal cell groups besides hypocretin cells, and regulates hypocretin transcription. We hypothesize that increased IGFBP3 amount in HCRT cells decreases HCRT production and reduces wake under physiological conditions. When expression exceeds a specific threshold however, it may initiate hypocretin cell death and cause narcolepsy.
Materials and Methods
Human studies
donation program and the Stanford Brain Bank. Samples from 9 narcoleptic patients (89% Caucasian) and 14 Caucasian controls were dissected. Six narcolepsy and 11 control samples were analyzed after passing quality control (Table 1). Patients were all HLA DQB1*0602 positive with cataplexy. Sera from 11 narcolepsy and 11 controls, CSF from 27 narcolepsy and 35 controls were also used for IGFBP3 measurements. DNA samples from 130 parent-child trios (proband and parents), and 252 individuals with available CSF hypocretin level values in the control range, were obtained and used. Informed consent was obtained in accordance with Stanford human subjects policy and the principles of the Declaration of Helsinki.
Brain dissection. Four brain regions were dissected: posterior and anterior hypothalamus, LC and diagonal band of Broca. Coronal sections (0.9 mm) of hypothalamus and diagonal band, and transaxial brainstem sections were cut from frozen blocks, mounted, and stored at280uC. Digital photographs of the blocks were used for orientation and identification of target regions. The location of hypothalamic structures and the diagonal band were determined using human atlas coordinates [37]. The LC was identified by atlas location [38] and coloration.
Posterior hypothalamic samples were collected from the mam-millary body (atlas fig.32, optic chiasm+13 mm) to the level where the fornix enters the hypothalamus (fig. 25, optic chiasm+4 mm). Anterior hypothalamic samples were collected from this level (fig. 24, optic chiasm +3 mm) to the optic chiasm (fig. 19, optic chiasm
22 mm). Diagonal band areas closely surrounded the anterior hypothalamus in the same planes. Hypothalamic and diagonal band samples were dissected by scalpel, LC samples were collected with a 1.2 mm Palkovits punch (Stoelting Co., Wood Dale, IL).
RNA isolation and Array Hybridization. Biotinylated cDNA synthesized from total RNA was hybridized to microarrays (HG-U133 A and B, Affymetrix, Santa Clara, CA) according to manufacturer protocols (Genechip manual, Affymetrix). Fluorescent array images were scanned (Affymetrix GeneArray 2500 or GeneChip 3000 scanner) and analyzed with global scaling, adjusting mean target intensity to 500 for all probe sets (Affymetrix MAS 5.0 software).
Quality control and sample comparisons. The pH of each sample was measured (homogenate of a 106dilution of 0.5 g of temporal cortex or striatum in water). Samples with pH#6.5 were excluded [39]. Integrity of extracted RNA was verified by RNA nano LabChips on a 2100 Bioanalyzer (Agilent Technologies, Palo Alto, CA). Samples with a 28S/18S ratio below 0.5 were discarded (median ratio 0.81). Microarray data was also used to estimate RNA quality (ratio ofGAPDH39over 59
probe hybridization). Samples with a ratio over 8 were excluded (median ratio 2.3). Postmortem interval had less effect on RNA quality and subjects were included independent of interval (median 7 hrs, all below 48 hrs).
We compared regional transcript abundance in 11 control brains (74.0613.0 years old, PMI: 14.1617.0 hr, 63.6% male, 36.4% HLADQB1*0602positive). Sample size for brain regions (varied due to availability and sample quality) included 8 posterior hypothalami, 6 anterior hypothalami, 7 diagonal bands and 4 LCs. We compared posterior hypothalami of 6 narcoleptic patients (68.8612.3 years old, PMI 15.7616.3 hr, 33.3% male, allDQB1*0602positive) and 8 controls (73.0613.0 years old, PMI 11.8615.0 hr, 62.5% male, 37.5%DQB1*0602positive) for the A chip, and 5 narcolepsy and 7 control samples for the B chip (Table 1). Overall mean age, PMI and sex did not differ significantly.
Statistical analysis of array data. MAS 5.0 was used for signal calculation and present/absent determination combined
with SAM ranking analysis to identify significantly up/down regulated genes. Data from the A and B chips were analyzed separately. Probes with an absent or marginal call in more than 90% of samples were omitted as were array tags linked to multiple genes, and only the highest SAM ranked probe for a gene was included. Filtering eliminated 41% and 53% of the transcripts from the A and B chips in the narcolepsyvscontrol comparison. Results were reported as SAM rankings, fold changes in average expression levels, and Mann-Whitney U-testp-values. The top 15 SAM upregulated genes were used for comparisons across brain regions. Genes upregulated in two of three comparisons were reported. For the comparison of posterior hypothalamus between narcolepsy and control, the top 100 SAM up or down regulated candidates were selected and sorted based on fold changes: those above 2.5 or below 0.4 fold change were studied further.
Quantitative Reverse Transcriptase PCR. Candidate transcripts were studied by QRT-PCR (ABI 7300 system, Applied Biosystems, Foster City, CA). cDNA was synthesized from total RNA using Superscript III Reverse Transcriptase and random hexamer.(Invitrogen, Carlsbad, CA). Geometric means of b-actin and b2-microglobulin were used for normalization (geNorm analysis) [40]. After performing QRT-PCR for selected genes in parallel with b-actin and b2-microglobulin, relative expression quantity was calculated. Genes were considered validated when the mean fold change was more than 1.5 and Mann-Whitney U-test indicated statistical significance (p,0.05). Expression differences forCART[41], GAL[42],PDYN [9] and
NPTX2[10] were also verified.
Human brain immunohistochemistry. Six hypothalami (4 control, 2 narcolepsy) were fixed in 4% paraformaldehyde (PFA, pH 7.3), cryoprotected and sectioned coronally to obtain a series of 24 sections (40mm). The following steps were performed at 4uC interspersed with washes. Sections were (I) treated with 0.3% H2O2, (II) post-fixed with 4% PFA, (III) blocked in 1.5% horse
serum, (IV) incubated with mouse anti-HCRT monoclonal antibody (1:250) [43] or a monoclonal anti-NeuN antibody (1:50,000;Millipore, Billerica, MA) (V) incubated with biotinylated horse anti-mouse IgG (1:200; Vector Laboratories, Burlingame, CA), (VI) alkaline phosphatase (AP) conjugated ABC (1:100; Vector), and (VII) VectaRed AP-substrate (1:50; Vector) in 0.1 M Tris-HCl (pH 8.4) until satisfactory staining was obtained. Sections were then (VIII) incubated in 1.5% rabbit serum, (IX) goat anti-IGFBP3 antiserum (1:250; AF675 R&D Systems, Minneapolis, MN), (X) biotinylated rabbit anti-goat IgG (1:200, Vector), (XI) ABC reagent (1:100; Vector), (XII) biotinyl-tyramide (1:500; PerkinElmer) with 0.03% H2O2, and (XIII) Qdot 525
streptavidin conjugate (1:100;Invitrogen) in borate buffer (pH 8.5). Sections were mounted and analyzed under a fluorescence microscope equipped with a CCD camera: images were digitally merged to visualize the colocalization of signals.
Evaluation of hypocretin and IGFBP3 levels, antibodies and IGFBP3 genotyping. CSF and serum IGFBP3 levels were measured in duplicate using a total ELISA kit (DSL-10-6600; Diagnostic Systems Laboratories, Webster, TX) according to the manufacturer’s protocol. Average intra-assay coefficients of variation were 2.5%. CSF hypocretin-1 levels were measured using a radioimmunoassay as reported previously [2]. We tested CSF of 27 narcolepsy and 35 matched controls, and serum from 11 narcolepsy and 11 controls.
Protein extracts were run on 10% SDS-PAGE gels, transferred onto nitrocellulose, and incubated with anti-human IGFBP3 polyclonal antiserum (1:200; Santa Cruz Biotechnology, Santa Cruz, CA), followed by horseradish peroxidase (HRP)-conjugated donkey anti-goat IgG (1:4000) and then detected with Supersignal West Pico chemiluminescence reagent (ThermoFisher, Wyman, MA), revealing the 42 kDa IGFBP3 band. Similar membranes were used to detect anti IGFBP3 antibodies in human sera. Membranes were incubated with serum (1:200) followed by HRP-donkey anti-human antiserum (1:5000), and chemiluminescent detection. Twenty two narcolepsy and 20 control samples were tested.
The single base pair polymorphism in theIGFBP3 promoter (rs2854744, 2202 A/C) was genotyped in 130 Caucasian narcolepsy-cataplexy trios and 262 adult Caucasian subjects (54% females; mean age 35.860.8 years) using established methods [17].
Mouse studies
Animals and tissue preparation. Five different mouse lines were used: hypocretin-ataxin-3 transgenic mice lacking hypocretin neurons (Hcrt-ataxin-3: C57BL/6J background), preprohypocretin knockout mice (Hcrt KO: C57BL/6J background), IGFBP3 knockout mice (mIgfbp3KO: C57BL/6J background) (courtesy of Dr JE Pintar, University of Medicine and Dentistry of New Jersey, Piscataway, NJ) [18], transgenic mice overexpressing human IGFBP3 cDNA (hIGFBP3 transgenic: CD1 background), transgenic mice overexpressing the Gly56/Gly80/Gly81 mutated form of human IGFBP3 which lacks IGF binding (hmutIGFBP3
transgenic: CD1 background) (courtesy of Dr. LJ Murphy, University of Manitoba, Winnipeg, Canada) [19]. The latter two mouse strains allow differentiation between bound and IGF-independent effects of the protein. Two human IGFBP3 genes were driven by the same mouse phosphoglycerate kinase I promotor, and were used to distinguish the effect of IGF binding. In all transgenic comparisons, age matched mice of the corresponding genetic background, usually littermates, were used at all times. Mice were maintained under controlled temperature (2161uC) and 12 h:12 h light-dark cycle with free access to food and water. The entire study was approved and conducted in accordance with the guidelines of Stanford’s Administrative Panel for Laboratory Animal Care.
For neuroanatomical studies, mice were euthanized (pentobar-bital) and perfused transcardially with saline followed by 50 ml 10% formalin (pH 7.4). Brains were fixed in 10% formalin, and equilibrated with 20% sucrose/0.5% formalin. Coronal slices (30mm) containing the whole hypothalamus were sectioned into a 1:5 series and mounted.
Mouse microarray experiments. Groups of 30 wild type and 30 ataxin-3 transgenic mice were used. Perifornical hypothalamic 0.5 mm Palkovits punches encompassing the hypocretin field (Fig. S1) were collected at ZT 22. Biotinylated cRNA was synthesized from total RNA and hybridized to Affymetrix Mouse 430 microarrays and scanned fluorescent array images were analyzed with GeneChip Operating Software (Affymetrix)
In situ hybridization for candidate genes. In situ
hybridization was performed on 6–10 week male C57BL/6J mice. Mouse cDNA IMAGE clones (Table 2; Invitrogen) were sequence verified (Bionexus, Oakland, CA) and used. Plasmid DNA was linearized and transcribed with T7, T3 or SP6 polymerases (Promega, Madison, WI) and 35S-UTP (Amersham BioSciences, Piscataway, NJ) or digoxigenin-UTP (Roche Diagnostics, Indianapolis, IN) by standard methods.
Probes were diluted in standard hybridization buffer to 36106 counts per 125ml. Sections were pretreated in citrate buffer (pH 6.0), and hybridized with probe at 54uC, followed by RNase A treatment and stringent washes (26SSC at 50uC; 0.26SSC, 55uC; 0.26SSC, 65uC), dehydrated and exposed to films for 1–40 days.
In situ hybridization of IGFBP3 and HCRT immunostaining. Digoxigenin-labeled probe (1:500) was used in hybridizations as described. Sections were treated with 3% sheep serum/0.1% Triton X-100, and incubated overnight with alkaline phosphatase-conjugated sheep anti-digoxigenin antibodies (1:5000; Roche). Endogenous alkaline phosphatase was blocked (levamisole) and hybridization was visualized by incubation in 0.3 mg/ml NBT(nitroblue tetrazolium) and 0.2 mg/ml BCIP(5-bromo,4-choloro,3-indolylphosphate).
Sections with satisfactory IGFBP3 signal were immunostained with highly specific rabbit anti-HCRT-1 antiserum (1:4000; made with human HCRT-1 as immunogen). Slides were washed and incubated with (I) biotinylated goat anti-rabbit IgG (1:500; Jackson Immunoresearch, West Grove, PA), (II) ABC complex (1:1000; Vector), (III) biotinylated tyramide diluted 1:50 in amplification buffer (Perkin Elmer), (IV) Alexa Fluor-conjugated streptavidin (1:200;Invitrogen).
To stain and count hypocretin cell populations, successive sections encompassing the entire hypocretin field were stained using an anti HCRT-1 antiserum as described above. Cells were counted without corrections and blind of genotype status.
Hypocretin-1 radioimmunoassay. Frozen brain tissue of animals sacrificed at Zeitbeger time ZT2–ZT3 were extracted with 1 mL of 0.5 M acetic acid and boiled in water bath for 15 minutes. Samples were cooled on ice and centrifuged at 50006g for 10 minutes. Protein concentration in the supernatant was measured using the Bradford method (Bio-Rad Laboratories, Hercules, CA). The supernatants were dried overnight at 50uC and reconstituted in RIA buffer for radioimmunoassay using a commercially available 125I RIA kit (Phoenix Pharmaceuticals, Belmont, CA) as described [44]. The hypocretin contents were corrected against protein concentrations.
Preprohypocretin, murine/human IGFBP3 and MCH mRNA quantification. Total RNA from mice hypothalamic regions with RNA extraction reagents (Qiagen, Valencia, CA) and synthesized cDNA was subjected to TaqMan real time PCR analysis to measure relative preprohypocretin, murine/human IGFBP3, and MCH expression levels in parallel with ß-actin, hypoxanthine-guanine phosphoribosyltransferase (HPRT) and GAPDH as internal controls. HPRT was chosen for data normalization due to its stable expression across the genotypes.
Mouse sleep recording and analysis. Nine wild type (WT) and 13 transgenic (TG) mice (age 3–6 months) were implanted under isofluorane anesthesia with telemetry transmitters (ETA-F20, 3.9 g weight, Data Science International, St. Paul, MN) capable of acquiring and sending electroencephalograph (EEG), temperature, and movement data. The two EEG electrodes were secured with dental cement at the following coordinates: anterior/ posterior from bregma (AP) 1.5 mm, lateral (ML) 1.5 mm and AP
10 second epochs using SleepSign (Kissei America, Irvine, CA) according to the method developed previously [45].
Hypocretin promoter studies
Cell culture. HeLa (human cervical carcinoma), SF126 (human glioblastoma), and Becker (human astrocytoma) cells were grown in Dulbecco’s modified Eagle’s medium (DMEM; GIBCO, Grand Island, NY) supplemented with 10% fetal bovine serum (GIBCO),.and SH-SY5Y (human neuroblastoma) cells were grown in DMEM/F12 supplemented with 5% horse serum (GIBCO), at 37uC and 5% CO2.
Reporter plasmids. The pGL3-basic plasmid (Promega) encoding the firefly luciferase gene was used for the promoter activity assessment with introduced sequence and the pRL-TK plasmid (Promega) encoding Renilla luciferase was used as internal control for transfection efficiency. The plasmid 3.2 kb Hcrt/pGL3 was constructed by cloning the HCRT promoter sequence at
23278/+87 [46] into upstream of the firefly luciferase gene in pGL3-Basic plasmid; 59- ccgctcgagGGTGTCTGGCGCTCAG GGTG-39(corresponds to the first exon sequence just before the translation initiator ATG of human prepro-Hcrt gene, and 59 -CGACGCGTGGATCCAGATGCCTCTGAATAG-39 (23278) were used.
Transient transfection. Cells were seeded at a 250,000 per well in 24-well cell culture plate coated with collagen type I (BD Biosciences, Bedford MA) one day before transfection. Cells were co-transfected with three types of plasmid mixed in the following amount per well with FuGENE 6 Transfection Reagent (Roche): 200 ng firefly luciferase-encoding reporter plasmid (pGL3-basic or 3.2 kb Hcrt/pGL3), 20 ng Renilla luciferase-encoding internal control reporter plasmid (pRL-TK), and 200 ng expression vector (pCMV-Tag3 as mock or IGFBP3/pCMV-Tag3).
Luciferase activity measurements. At 24 h after transfection, cells were washed and lysed with 100mL passive lysis buffer (Promega). Activities of two luciferases encoded by reporter plasmids and internal control plasmids were measured sequentially twice using the Dual-Luciferase Reporter assay reagents (Promega) and PLATE CHAMELEON multilabel platereader (HIDEX, Finland) according to the manufacturer’s protocol. Relative luciferase activity (RLA) was determined by FLU value divided by RLU value. All RLA values were further standardized by the reference RLA value for pGL3-basic plasmid with pCMV-Tag3 vector (mock) as 1.0.
Supporting Information
Table S1 Cross-regional comparison of transcript abundance in selected human brain regions. Comparison of microarray
expression data across 4 brain regions in control subjects The listed genes have enriched expression in the indicated region, as compared to the other regions. For example, PMCH gene expression was increased 73.8 fold in the posterior hypothalamus when compared to the anterior hypothalamus and ranked #1 using the SAM analysis. Similarly, PMCH gene expression in the posterior hypothalamus ranked first versus the diagonal band sample (3.3 fold change), and the LC (275.1 fold change). Only genes enriched in one region versus at least two other regions are listed (see methods).
Found at: doi:10.1371/journal.pone.0004254.s001 (0.13 MB DOC)
Table S2 Overall sleep parameters in mice overexpressing human IGFBP3 (TG) versus wild type littermates (WT)Although total wake is decreased in TG mice, the difference is not statistically significant. Hour by hour analysis revealed that decreased wake occurred prior to light onset (see Fig. 4). Found at: doi:10.1371/journal.pone.0004254.s002 (0.06 MB DOC)
Figures S1 Perifornical hypothalamic region dissected for microarray analysis in mice (A) and transcript abundance distribution plots correlating abundance in wild type versus ataxin-3 transgenic mice (B). (A) Immunocytochemistry of hypocretin in wild type (WT, top) and Hcrt-ataxin-3 transgenic mouse (bottom). The area collected using punches is outlined by a circle in wild type versus transgenic mice lacking most hypocretin cells. Transcript abundance distribution (B) in both genotypes is highly correlated, and hypocretin is one of the outliers (circled dot). For list of differentially regulated transcripts, see Table 3. Found at: doi:10.1371/journal.pone.0004254.s003 (1.56 MB TIF)
Figure S2 Locomotion (A) and temperature (B) in wild type (WT) versus hIGFBP3 transgenic mice (Tg). Note decreased temperature and locomotion at the end of the active period in hIGFBP3 transgenic mice, mirroring changes in sleep depicted in Fig. 4.
Found at: doi:10.1371/journal.pone.0004254.s004 (5.70 MB TIF)
Author Contributions
Conceived and designed the experiments: MH EM. Performed the experiments: MH KSE SZ ST LL SEG ST KT. Analyzed the data: MH KSE ST LL SEG KT YH EM. Contributed reagents/materials/analysis tools: MH AS PEH JM MY TS YH EM. Wrote the paper: MH KSE SZ EM.
References
1. Mignot E, Lin L, Rogers W, Honda Y, Qiu X, et al. (2001) Complex HLA-DR and -DQ interactions confer risk of narcolepsy-cataplexy in three ethnic groups. Am J Hum Genet 68: 686–699.
2. Mignot E, Lammers GJ, Ripley B, Okun M, Nevsimalova S, et al. (2002) The role of cerebrospinal fluid hypocretin measurement in the diagnosis of narcolepsy and other hypersomnias. Arch Neurol 59: 1553–1562.
3. Sakurai T, Amemiya A, Ishii M, Matsuzaki I, Chemelli RM, et al. (1998) Orexins and orexin receptors: a family of hypothalamic neuropeptides and G protein-coupled receptors that regulate feeding behavior. Cell 92: 1 page following 696.
4. Chemelli RM, Willie JT, Sinton CM, Elmquist JK, Scammell T, et al. (1999) Narcolepsy in orexin knockout mice: molecular genetics of sleep regulation. Cell 98: 437–451.
5. Lin L, Faraco J, Li R, Kadotani H, Rogers W, et al. (1999) The sleep disorder canine narcolepsy is caused by a mutation in the hypocretin (orexin) receptor 2 gene. Cell 98: 365–376.
6. Hara J, Beuckmann CT, Nambu T, Willie JT, Chemelli RM, et al. (2001) Genetic ablation of orexin neurons in mice results in narcolepsy, hypophagia, and obesity. Neuron 30: 345–354.
7. Peyron C, Faraco J, Rogers W, Ripley B, Overeem S, et al. (2000) A mutation in a case of early onset narcolepsy and a generalized absence of hypocretin peptides in human narcoleptic brains. Nat Med 6: 991–997.
8. Thannickal TC, Moore RY, Nienhuis R, Ramanathan L, Gulyani S, et al. (2000) Reduced number of hypocretin neurons in human narcolepsy. Neuron 27: 469–474.
9. Chou TC, Lee CE, Lu J, Elmquist JK, Hara J, et al. (2001) Orexin (hypocretin) neurons contain dynorphin. J Neurosci 21: RC168.
12. Crocker A, Espana RA, Papadopoulou M, Saper CB, Faraco J, et al. (2005) Concomitant loss of dynorphin, NARP, and orexin in narcolepsy. Neurology 65: 1184–1188.
13. Thannickal TC, Siegel JM, Nienhuis R, Moore RY (2003) Pattern of hypocretin (orexin) soma and axon loss, and gliosis, in human narcolepsy. Brain Pathol 13: 340–351.
14. Scammell TE (2006) The frustrating and mostly fruitless search for an autoimmune cause of narcolepsy. Sleep 29: 601–602.
15. Tusher VG, Tibshirani R, Chu G (2001) Significance analysis of microarrays applied to the ionizing radiation response. Proc Natl Acad Sci U S A 98: 5116–5121.
16. Bunn RC, King WD, Winkler MK, Fowlkes JL (2005) Early developmental changes in IGF-I, IGF-II, IGF binding protein-1, and IGF binding protein-3 concentration in the cerebrospinal fluid of children. Pediatr Res 58: 89–93. 17. Jernstrom H, Deal C, Wilkin F, Chu W, Tao Y, et al. (2001) Genetic and
nongenetic factors associated with variation of plasma levels of insulin-like growth factor-I and insulin-like growth factor-binding protein-3 in healthy premenopausal women. Cancer Epidemiol Biomarkers Prev 10: 377–384. 18. Ning Y, Schuller AG, Bradshaw S, Rotwein P, Ludwig T, et al. (2006)
Diminished growth and enhanced glucose metabolism in triple knockout mice containing mutations of insulin-like growth factor binding protein-3, -4, and -5. Mol Endocrinol 20: 2173–2186.
19. Modric T, Silha JV, Shi Z, Gui Y, Suwanichkul A, et al. (2001) Phenotypic manifestations of insulin-like growth factor-binding protein-3 overexpression in transgenic mice. Endocrinology 142: 1958–1967.
20. Silha JV, Gui Y, Mishra S, Leckstrom A, Cohen P, et al. (2005) Overexpression of gly56/gly80/gly81-mutant insulin-like growth factor-binding protein-3 in transgenic mice. Endocrinology 146: 1523–1531.
21. Lee KW, Ma L, Yan X, Liu B, Zhang XK, et al. (2005) Rapid apoptosis induction by IGFBP-3 involves an insulin-like growth factor-independent nucleomitochondrial translocation of RXRalpha/Nur77. J Biol Chem 280: 16942–16948.
22. Franz H, Ullmann C, Becker A, Ryan M, Bahn S, et al. (2005) Systematic analysis of gene expression in human brains before and after death. Genome Biol 6: R112.
23. Vogel-Hopker A, Rohrer H (2002) The specification of noradrenergic locus coeruleus (LC) neurones depends on bone morphogenetic proteins (BMPs). Development 129: 983–991.
24. Mandel S, Grunblatt E, Riederer P, Amariglio N, Jacob-Hirsch J, et al. (2005) Gene expression profiling of sporadic Parkinson’s disease substantia nigra pars compacta reveals impairment of ubiquitin-proteasome subunits, SKP1A, aldehyde dehydrogenase, and chaperone HSC-70. Ann N Y Acad Sci 1053: 356–375.
25. Coyle AJ, Lloyd C, Tian J, Nguyen T, Erikkson C, et al. (1999) Crucial role of the interleukin 1 receptor family member T1/ST2 in T helper cell type 2-mediated lung mucosal immune responses. J Exp Med 190: 895–902. 26. Lee KW, Liu B, Ma L, Li H, Bang P, et al. (2004) Cellular internalization of
insulin-like growth factor binding protein-3: distinct endocytic pathways facilitate re-uptake and nuclear localization. J Biol Chem 279: 469–476. 27. Beilharz EJ, Russo VC, Butler G, Baker NL, Connor B, et al. (1998)
Co-ordinated and cellular specific induction of the components of the IGF/IGFBP axis in the rat brain following hypoxic-ischemic injury. Brain Res Mol Brain Res 59: 119–134.
28. Fang P, Hwa V, Rosenfeld R (2004) IGFBPs and cancer. Novartis Found Symp 262: 215–230; discussion 230–214, 265–218.
29. Kim HS, Ingermann AR, Tsubaki J, Twigg SM, Walker GE, et al. (2004) Insulin-like growth factor-binding protein 3 induces caspase-dependent apopto-sis through a death receptor-mediated pathway in MCF-7 human breast cancer cells. Cancer Res 64: 2229–2237.
30. Bhattacharyya N, Pechhold K, Shahjee H, Zappala G, Elbi C, et al. (2006) Nonsecreted insulin-like growth factor binding protein-3 (IGFBP-3) can induce apoptosis in human prostate cancer cells by IGF-independent mechanisms without being concentrated in the nucleus. J Biol Chem 281: 24588–24601. 31. Santer FR, Bacher N, Moser B, Morandell D, Ressler S, et al. (2006) Nuclear
insulin-like growth factor binding protein-3 induces apoptosis and is targeted to ubiquitin/proteasome-dependent proteolysis. Cancer Res 66: 3024–3033. 32. Katsuki H, Akaike A (2004) Excitotoxic degeneration of hypothalamic orexin
neurons in slice culture. Neurobiol Dis 15: 61–69.
33. Silha JV, Gui Y, Murphy LJ (2002) Impaired glucose homeostasis in insulin-like growth factor-binding protein-3-transgenic mice. Am J Physiol Endocrinol Metab 283: E937–945.
34. Carskadon MA, Acebo C, Jenni OG (2004) Regulation of adolescent sleep: implications for behavior. Ann N Y Acad Sci 1021: 276–291.
35. Schneider HJ, Pagotto U, Stalla GK (2003) Central effects of the somatotropic system. Eur J Endocrinol 149: 377–392.
36. Obal F Jr, Krueger JM (2001) The somatotropic axis and sleep. Rev Neurol (Paris) 157: S12–15.
37. Mai JK, Assheuer J, Paxinos G (1997) Atlas of the human brain. San Diego: Academic Press.
38. Paxinos G, Huang X (1995) Atlas of the human brainstem. San Diego: Academic Press.
39. Tomita H, Vawter MP, Walsh DM, Evans SJ, Choudary PV, et al. (2004) Effect of agonal and postmortem factors on gene expression profile: quality control in microarray analyses of postmortem human brain. Biol Psychiatry 55: 346–352. 40. Vandesompele J, De Preter K, Pattyn F, Poppe B, Van Roy N, et al. (2002) Accurate normalization of real-time quantitative RT-PCR data by geometric averaging of multiple internal control genes. Genome Biol 3: RESEARCH0034. 41. Broberger C, De Lecea L, Sutcliffe JG, Hokfelt T (1998) Hypocretin/orexin-and melanin-concentrating hormone-expressing cells form distinct populations in the rodent lateral hypothalamus: relationship to the neuropeptide Y and agouti gene-related protein systems. J Comp Neurol 402: 460–474.
42. Hakansson M, de Lecea L, Sutcliffe JG, Yanagisawa M, Meister B (1999) Leptin receptor- and STAT3-immunoreactivities in hypocretin/orexin neurones of the lateral hypothalamus. J Neuroendocrinol 11: 653–663.
43. Taheri S, Lin L, Mignot E (2004) The development of monoclonal antibodies against hypocretin-1 (orexin A). In Sleep. A243.
44. Lin L, Wisor J, Shiba T, Taheri S, Yanai K, et al. (2002) Measurement of hypocretin/orexin content in the mouse brain using an enzyme immunoassay: the effect of circadian time, age and genetic background. Peptides 23: 2203–2211.
45. Zhang S, Zeitzer JM, Sakurai T, Nishino S, Mignot E (2007) Sleep/wake fragmentation disrupts metabolism in a mouse model of narcolepsy. J Physiol 581: 649–663.